
記住我
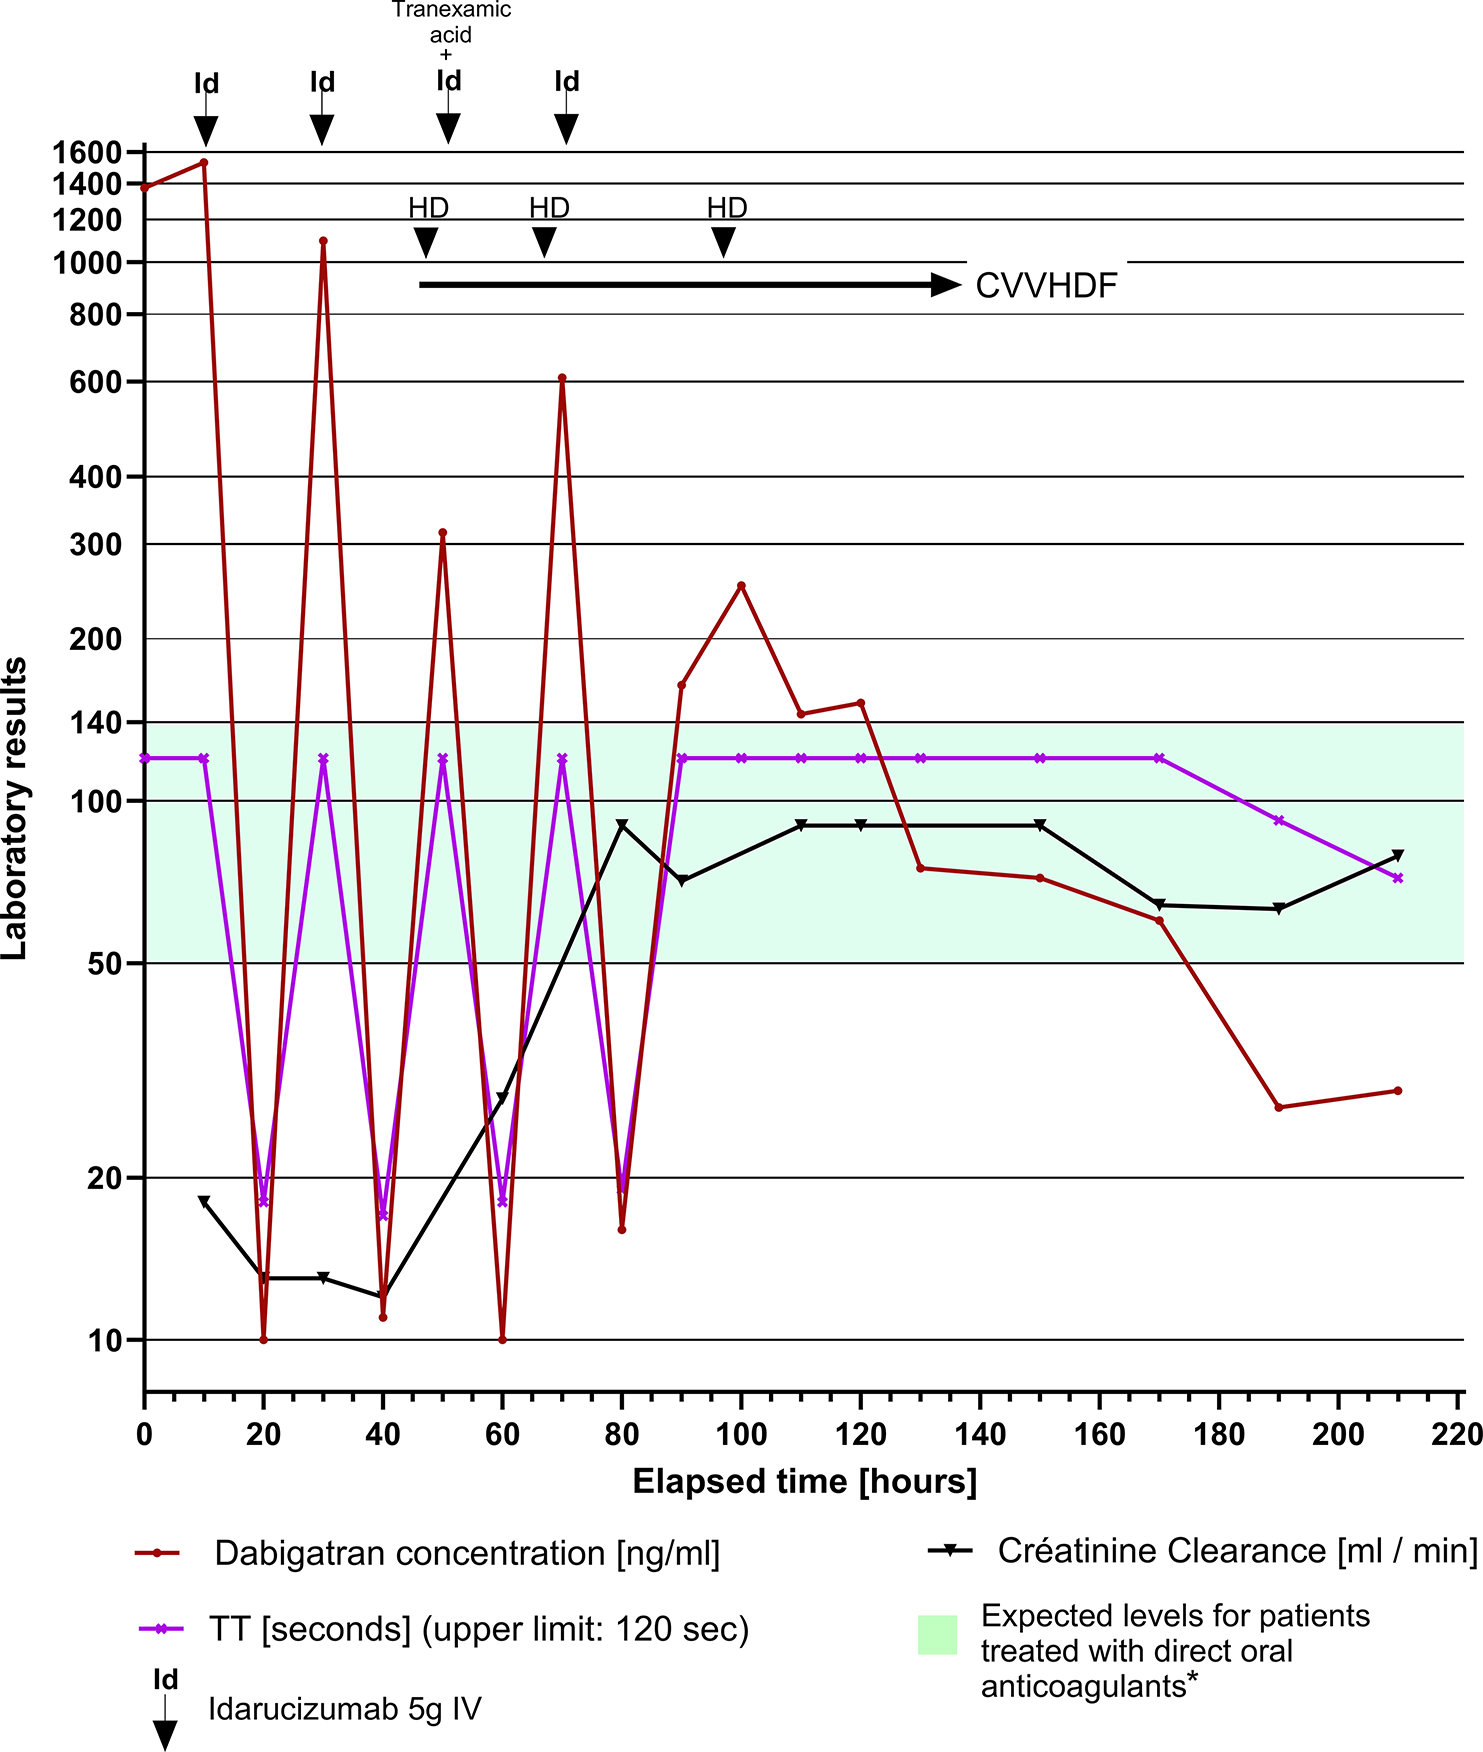

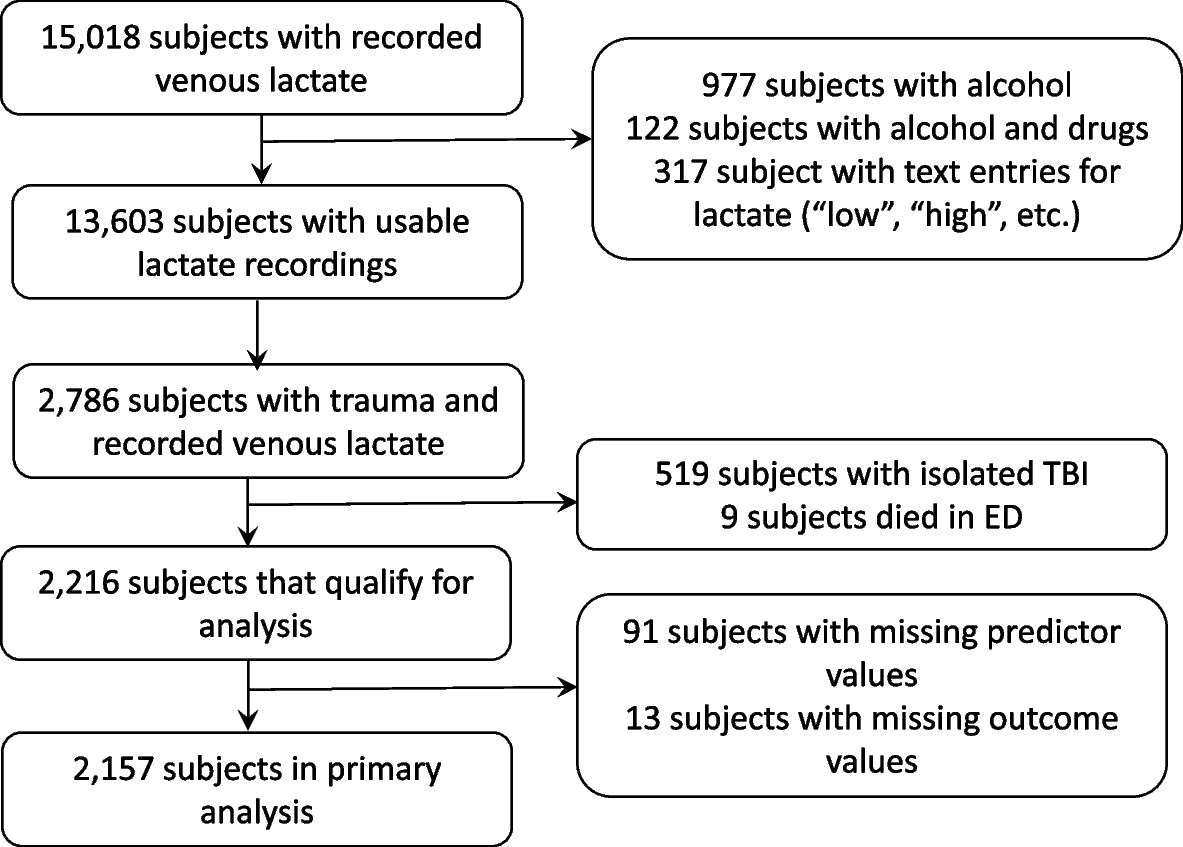
Of the patients transported over the seven-year study period, we identified 2,157 trauma patients with a prehospital lactate value (Fig. 1) obtained according to the Blood Administration protocol (Supplemental Table 1 and Appendix 2).
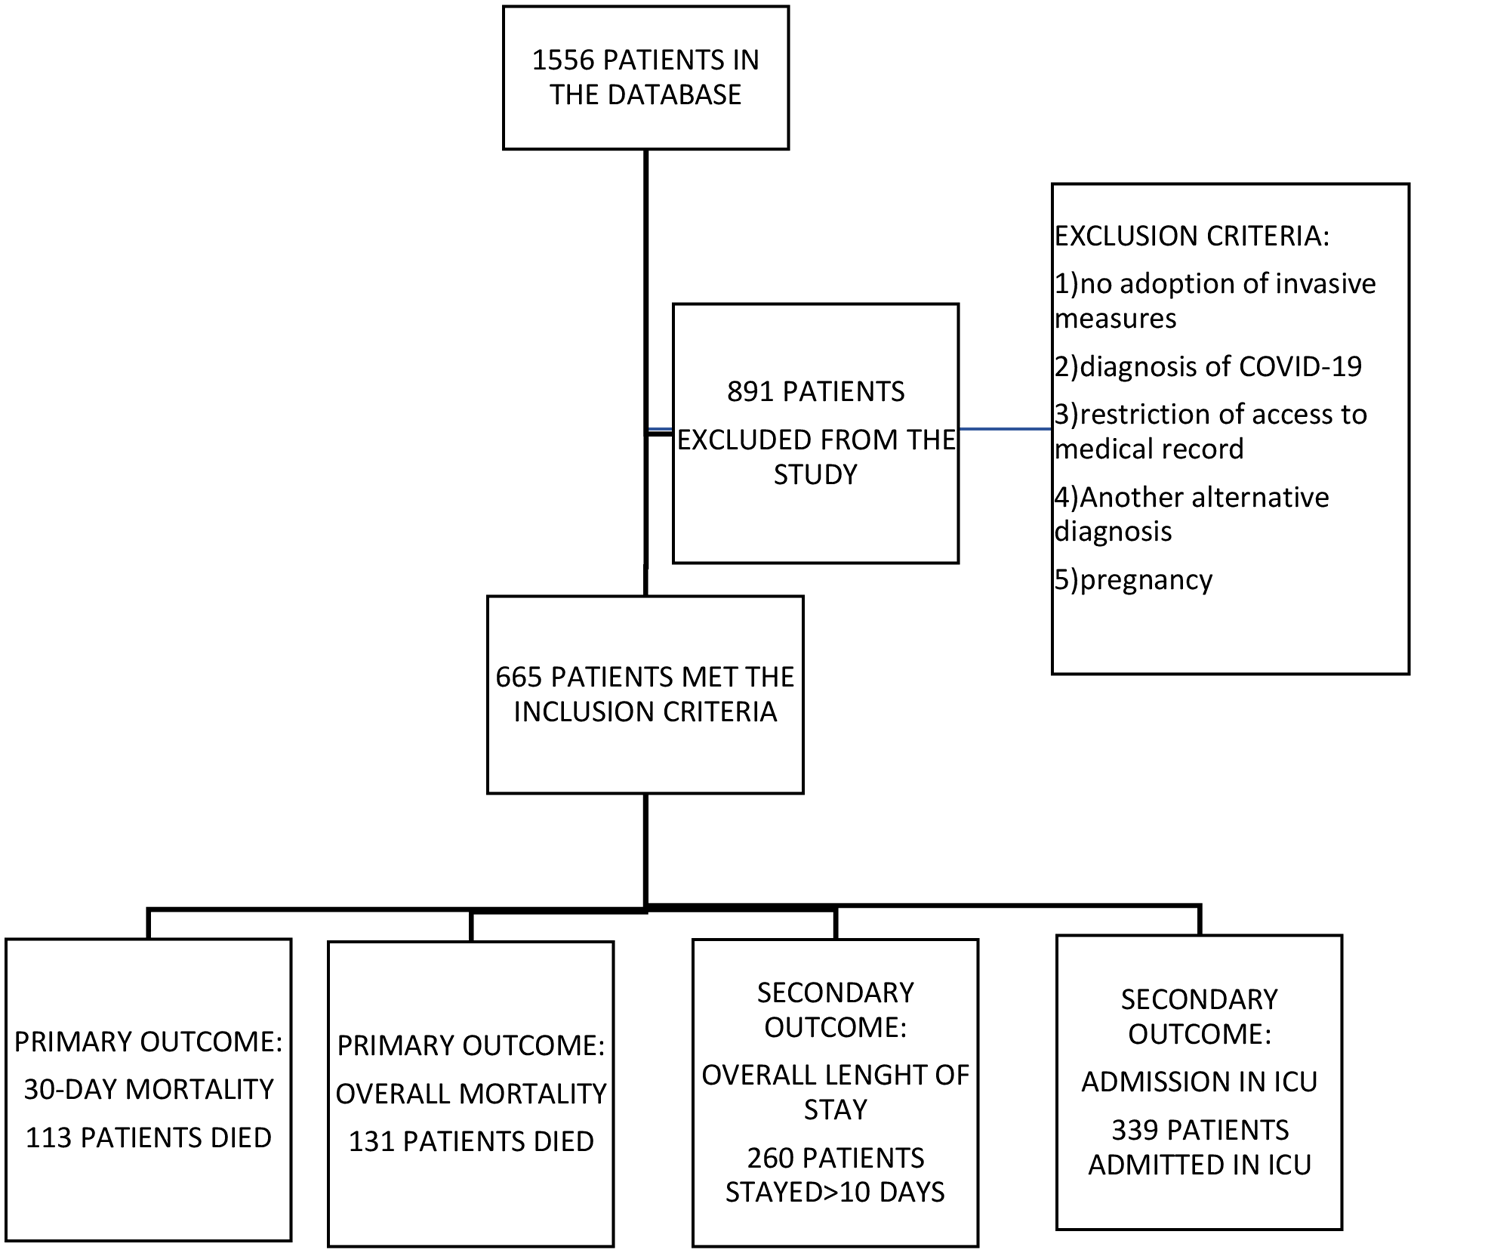
Fig. 1
Flow diagram illustrating cohort selection. STROBE guidelines are shown in grey rectangles. Subjects with trauma were received in a trauma or burn unit and/or had the following mechanisms of injury: assault, animal bite, burn, electrocution (non-lightning), gunshot wound, stabbing/cutting, machinery accident; pedestrian, bicycle, motor vehicle, all-terrain vehicle, motorcycle, water transport, or aircraft accident, crash or collision
Among the cohort, 1,480 (68.6%) patients were male, mean age was 47 (IQR = 28 – 62), and 207 (9.60%) patients had the primary outcome of requiring a blood transfusion within 4 h of admission to the Emergency Department (Table 1).
The median prehospital lactate concentration was 4.85 mmol/L for the subjects who received blood products (IQR = 2.30–5.80), and 2.48 mmol/L for the subjects who did not require hospital blood products within 4 h of arrival (IQR = 1.30 – 2.98). Of the subjects who received hospital blood products, 19 (10%) died within 24 h of admission. Only 1% of the subjects who did not require hospital blood died within 24 h of admission (n = 15). Consistently, a greater percentage of subjects who received hospital blood products needed other hospital life-saving interventions (LSIs) (Table 1).
We excluded information about prehospital blood and crystalloids given by the prehospital care service and prior to arrival from the decision process because of significant collinearity (i.e., relationship between model predictors) related to in-hospital blood administration. We provided the FFT algorithm with 13 variables to choose from based on clinical value and availability to the prehospital clinicians [12]. Among them were AIS scores provided as a surrogate for injury condition that is visible to prehospital clinician, which we also previously found to associate with hospital transfusion. While we acknowledge the AIS value would not be available in the prehospital setting, we use them here as a proxy for clinically recognizable anatomic injury patterns that are used in the field by EMS clinicians for trauma triage purposes. Five of the thirteen variables were not selected by the algorithm as they were not associated with need for blood transfusion: 1) critical high heart > 120 bpm, 2) AIS abdomen > 2, 3) AIS spine > 2, 4) injury type (blunt or penetrating), and 5) shock index (SI) range (i.e., difference between highest and lowest SI).
The algorithm generated four variables highly associated with hospital blood transfusions within 4 h of arrival (Fig. 2). The variables chosen by the algorithm were evaluated in the following sequence: 1) minimum SBP (continuous), 2) prehospital venous lactate (continuous), 3) minimal SI (continuous), and 4) AIS chest > 2 (categorical). The predictors that were not selected by the FFT algorithm were 1) age, 2) mission type (scene or interfacility transfer), 3) AIS head > 2, and 4) AIS lower extremities > 2. The sensitivity for this FFT was 0.81 and specificity 0.71 based on data-driven variable sequence and thresholds.
Fig. 2
Pilot FFT chosen by the algorithm. The top panels show the number of observations and outcome (4-h hospital blood administration). SBP_min – minimal SBP (mmHg), nlacven – prehospital lactate concentration (mmol/L), si_min – minimum SI (bpm/mmHg), ais_ab – AIS for abdomen (0/1, equal to 1 if the AIS is greater than 2). “Hits” (green triangles) refer to correct blood administrations; “misses” (red triangles) – to incorrect rejections. Sensitivity (triangles) = Hits / (Hits + Misses). Correct rejections (green circles) refer to correct decisions to not give blood, false alarms (red circles) – to false positives, or incorrect decisions to give blood. Specificity (circles) = Correct Rejections / (Correct Rejections + False Alarms). A pilot FFT was obtained using training and testing datasets (the testing dataset N = 1,121) and selected from a “fan” of possible trees as having the best balance between sensitivity and specificity. A default sensitivity weight of 0.5 resulted in a “zig-zag” shape with alternating decisions. The ROC panel shows a comparison of parameters for the resulting FFT and other common model-building approaches: CART (C, red), Logistic Regression (LR, blue), Random Forest (RF, purple) and Support Vector Machine (SVM, yellow)
We applied the FFT definitions from the pilot experiment with rounded thresholds to the entire study population and got similar performance (Supplemental Figure 1A, sensitivity = 0.84, specificity = 0.70). Next, we maximized the sensitivity parameter with an aim to administer hospital blood to the greatest number of eligible patients while minimizing erroneous administrations. Setting the weighting parameter to any value in 0.7–1 range resulted in a “positive-rake” FFT that made positive blood decisions after every node (Supplemental Figure 1B, sensitivity = 0.93, specificity = 0.39). Also, from Supplemental Figure 1B, we can see that the Positive Predictive Value (PPV) for our model is 14.0% (192 / 1,373), while the Negative Predictive Value is 98.1% (769 / 784), confirming that our model rarely mis-identifies a patient needing 4-h hospital transfusion.
The resulting FFT out-performed other model-building approaches (e.g., CART and logistic regression (LR)) by creating a decision support model for early hospital blood administration with higher sensitivity and specificity (Supplemental Figure 1B). Finally, we altered the tree definitions with conventional thresholds used in current field triage guidelines and the literature to simplify for potential use in the prehospital environment [13].
The FFT algorithm found variable thresholds that were different from conventional ones (Fig. 2). We explored thresholds already in common use (i.e., SBP threshold of 90 mmHg and prehospital lactate of 4 mmol/L) or based on ease of calculation for the prehospital provider (SI > 1 = HR > BP) [14]. Applying conventional thresholds (Supplemental Figure 1C) instead data-driven ones (Supplemental Figure 1B) to the dataset greatly reduces the sensitivity but increases the specificity parameter. We tested (a) how altering the FFT definition with conventional thresholds would influence the sensitivity and specificity parameters (Supplemental Figure 1C, Table 2, first blue row) and (b) if a balance between specificity and sensitivity can be reached by using a combination of conventional and newly found thresholds (Table 2, yellow rows). The trees were created the same way as in Supplemental Figure 1B (Table 2, first row) differing only by the threshold values (thresholds and parameters of FFT from Supplemental Figure 1B are highlighted orange in Table 2). Table 2 illustrates how varying the threshold for SBP, lactate, and shock index alters the sensitivity, specificity, and overall performance based on Youden's J index. As expected, using a higher SBP, lower lactate, or lower SI threshold increases sensitivity but decreases specificity.
Table 2 Effect of using deduced, conventional, or mixed thresholds on FFT parameters. #- indicates the FFT model number; models with number ‘2.1’ or higher did not include lactate as a variable; Sens. – sensitivity, Spec. – specificity. Youden’s J statistic = sensitivity + specificity – 1 summarizes the performance of each modelWe performed sensitivity analyses by removing the lactate term from the models and using FFT-derived vs. conventional thresholds for SBP and SI (Table 2, rows 2.1–2.4), recognizing that prehospital lactate may not be widely available. The sensitivity was often higher for the models containing the lactate term (compare rows 2.1 and 1.1/3, 2.2 and 1.2/4, 2.3 and 1.5/7, 2.4 and 1.6/8), but the specificity and Youden’s J index were lower.
We also assessed current practice of prehospital blood transfusion by the critical care service and the need for early in-hospital transfusion. Table 3 shows a cross-tabulation of actual prehospital blood administration by early hospital transfusions. Of 207 subjects who required early hospital transfusions, 79 (38.2%) subjects also received blood before arriving to the hospital (Table 3, upper left quadrant). The majority (73) of these 79 subjects had SBP < 90 mmHg and received prehospital blood according to the prehospital care service protocol for blood transfusions. Among 60 patients who received prehospital transfusions but did not require hospital blood (Table 3, upper right quadrant), 33 (55.0%) patients had SBP < 90 mmHg. Patients who received blood with systolic blood pressures > 90 mmHg, either received the product on the order of the physician or in deviation from the protocol.
Table 3 Cross-tabulation of prehospital transfusions by 24-h hospital transfusionsIn our Bayesian analysis, the most predictive model demonstrated statistically significant associations with tachycardia (OR = 1.74; 95% CI 1.12 – 2.55), elevated prehospital lactate (OR = 2.31; 95% CI 1.55 – 3.37), and hypotension (OR = 11.59; 95% CI 7.70–16.98) for early in-hospital transfusion. In the Bayesian subgroup analysis of patients with SBP > 90 mmHg (N = 1,901; 87.6%), the most predictive model included minimum shock index (OR = 25.6; 95% CI 2.54 – 113.2), elevated lactate (OR = 2.17; 95% CI 1.11 – 3.77), and tachycardia (OR = 1.59; 95% CI 0.72 – 2.94). Based on the 95% credible intervals, in the hypotensive cohort lactate and minimum shock index were significantly associated with a higher posterior probability of early in-hospital transfusion.
Synthesizing and operationalizing the results from our approaches for potential field use, we developed an algorithm for prehospital blood transfusion that incorporates prehospital SBP, prehospital lactate, shock index, and severe abdominal injuries (Fig. 3). This algorithm allows for different threshold values that may be tailored according to system resources and time considerations.
Fig. 3
Summary of obtained decision rules and how they may guide prehospital transfusions. The rules were obtained based on the need for 4-hour in-hospital transfusions
We also applied the FFT definitions from Supplemental Figure 1B but excluding the node for severe chest injuries (Supplemental Figure 2). The resulting sensitivity and specificity parameters were slightly lower than those of the four-factor model (Supplemental Figure 1B, Supplemental Figure 2).
留言 (0)