
記住我

From December 2022 to January 2023, severe acute respiratory syndrome coronavirus 2 infections surged across Mainland China following the relaxation of zero-COVID policies—a series of stringent interventions focusing on intensive testing and isolation—around 7 December 2022. According to the official surveillance estimate from the Chinese Center for Disease Control (Chinese CDC), over 90% of the population in Mainland China was infected by 19 January 2023, based on random household samples from every province.1 Before the relaxation, there were 323,686 cumulative reported coronavirus disease 2019 (COVID-19) cases in Mainland China as of 31 November 2022, amounting to around 0.02% of the total population.2,3
Previously, Cai et al.4 simulated a hypothetical Omicron wave in Mainland China and projected that in the absence of strict nonpharmaceutical interventions, there could be 1.10 COVID-19-related deaths per 1000 individuals (equivalent to approximately 1.6 million deaths in total) from March to September 2022. Leung et al.5 simulated an Omicron BA.5 wave seeded on 1 December 2022 and projected that, without nonpharmaceutical interventions, 4th dose vaccination, or antivirals, a cumulative COVID-19 death rate of 0.684 per 1000 individuals (equivalent to 964,000 in total2) could occur from December 2022 to February 2023 in Mainland China. However, the above projections were obtained before the actual surge and relied on the case-fatality ratio from contexts outside of Mainland China.
In contrast to the projections, the official in-hospital COVID-19 death count reported by the Chinese CDC was approximately 81,000 from 9 December 2022 to 30 January 2023.6 This death count only included individuals who were diagnosed with COVID-19 based on a nucleic acid test and died in hospitals. Deaths with COVID-19 as the cause of death that were reported by doctors had to undergo expert reviews before being confirmed as COVID-19 deaths. Given the large discordance between the reported death toll and the figures anticipated from modeling, we sought a novel approach to estimate the number of all-cause excess deaths occurring in Mainland China (restricting consideration to urban dwellers due to the data source) during December 2022–January 2023. To do so, we made use of obituary data from the Chinese Academy of Engineering (CAE).
METHODS Data SourcesWe estimated excess death rates based on an open cohort of senior CAE members (ie, CAE members aged ≥80 years). We used CAE data because roster information was available regarding the date of death and date of birth for every deceased CAE senior member,7 as well as the year and month of birth for every CAE member who is alive. Crucially, CAE membership is lifelong, and CAE publishes an obituary for every deceased member consistently both before and during the COVID-19 pandemic. This process allowed us to create an open cohort of CAE senior members spanning the study period from December 2017 to January 2023, with their ages available. Ethical review was not required as the CAE data (ie, lists of alive and deceased CAE members) were publicly available.7,8
As of 15 November 2023, CAE had 906 members (foreign members excluded), among whom around 427 members were senior members aged 80 years and above.8 Election to CAE is considered the nation’s highest honor in the field of engineering. New members are elected every other year by current members (67 in 2017, 75 in 2019, and 84 in 2021) in recognition of prominent and innovative contributions to knowledge and advancement in the fields of engineering, science, and technology. There is no restriction on the geographical location from which the members are based.9
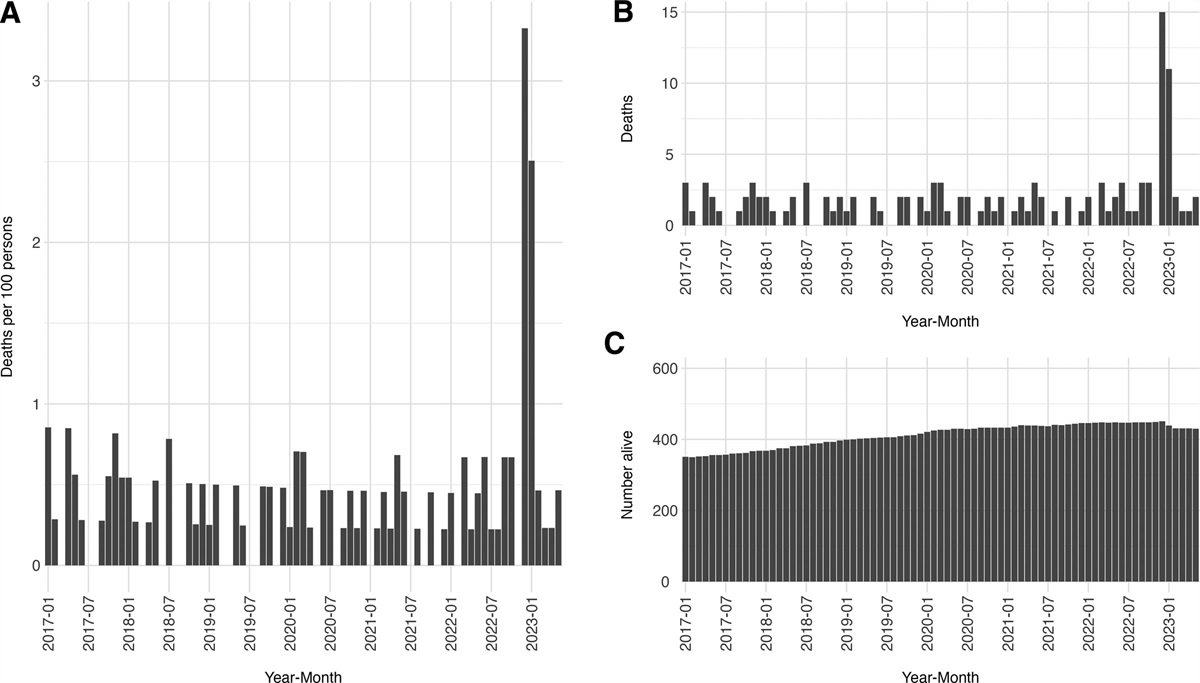
ESTIMATION OF EXCESS DEATH RATE AMONG SENIOR CAE MEMBERS BY AGE GROUPSWe defined excess deaths as the difference between observed all-cause deaths during December 2022–January 2023 and expected deaths based on all-cause deaths during the same period in the previous 5 years. We estimated excess death rates for four age categories: 80–84, 85–89, 90–94 and ≥95 years old. In each age category, we estimated the expected death rate from all causes based on deaths during December–January in the previous 5 years (ie, from December 2017 up to January 2022), which was the baseline window. Although this baseline window covered part of the pandemic, there was no sign of change in the death rate during the early period of the pandemic (Figure 1). Also, there was no nationwide disaster that would have caused abnormal mortality during that period.
 FIGURE 1.:
 Deaths per 100 persons (A), number of deaths (B), and number alive (C) among senior members of the Chinese Academy of Engineering (CAE) aged ≥80 years in each month from January 2017 to May 2023. Note that the number in panel C pertains to those aged ≥80 years who were alive by the beginning of each month.
To calculate the excess death rate μj for each age group j, we took the difference between the observed rate oj and expected rate ej. The observed death rate oj was calculated by dividing the observed death count during December 2022–January 2023 by the mean number alive at the beginning of December 2022 and the beginning of January 2023. The expected death rate was the mean deaths during the same period in the previous 5 years divided by the mean number alive at the beginning of December and January in the previous 5 years. That is ∑i=20172021(Decemberdeathsi,j+Januarydeathsi+1,j)/5∑i=20172021(Decemberalivei,j+Januaryalivei+1,j)/10, for year i and age group j. eAppendix 1; https://links.lww.com/EDE/C111 shows the death rates used for the calculation. We developed confidence intervals (CI) for the excess death rate and the total number of excess deaths in the ≥80 years old urban-dwelling men by parametric bootstrapping. Details are described in eAppendix 2; https://links.lww.com/EDE/C111. Briefly, in each iteration, we simulated the number of deaths in each age group during the surge period (December 2022–January 2023) from a binomial distribution; similarly, we simulated the expected number of deaths. Based on the simulated data, we estimated the excess death rate in age group j (denoted as μ^j∗) using the steps described above. Given μ^j∗, we multiplied by the population size in age group j and summed across j to obtain the total in the ≥80-year-old urban-dwelling men. We repeated the procedure for 100,000 iterations and obtained the bounds of the intervals from the 2.5th and 97.5th percentiles of the distributions.
EXTRAPOLATION TO URBAN DWELLERS IN MAINLAND CHINASenior CAE members were all ≥80 years old and predominantly male (over 95% of the CAE senior members who were alive as of June 2023 and all the decedents in December 2022–January 2023 were male). We estimated excess deaths in urban-dwelling men aged ≥80 years by multiplying each age-specific excess death rate with the age-specific population estimate of urban-dwelling men in Mainland China (Taiwan, Hong Kong Special Administrative Region [SAR], Macau SAR excluded) and summing across the age groups (80–84, 85–89, and 90–94, ≥95 years old). We obtained population estimates in Mainland China from the 2020 census results.2
Second, we extrapolated the excess death estimate to urban-dwelling men in general, using the age distribution of reported COVID-19 deaths based on data from the 5th wave in Hong Kong SAR, 31 December 2021 to 29 January 2023 and adjusting for the difference in relative sizes of <80 and ≥80 years old populations between Hong Kong SAR and Mainland China.10 eAppendix 3; https://links.lww.com/EDE/C111 gives details about the reported COVID-19 death data from Hong Kong. Given the excess deaths in urban-dwelling men aged ≥80 years old (denoted as Excessdeaths≥80,men,Mainland), excess deaths in urban-dwelling men aged <80 years old (Excessdeaths<80,men,Mainland) were estimated by assuming that the risk ratio (RR) of excess deaths in Mainland China urban-dwelling men is equal to the RR of COVID-19 deaths in Hong Kong. That is,
Excessdeaths<80,men,MainlandPopulation<80,men,MainlandExcessdeaths≥80,men,MainlandPopulation≥80,men,Mainland=COVID−19deaths<80,HKSARPopulation<80,HKSARCOVID−19deaths≥80,HKSARPopulation≥80,HKSAR
where population estimates in Hong Kong SAR were obtained from the 2021 population census results.11 All-age excess deaths in urban-dwelling men were the sum of excess deaths in the two age groups. We also estimated excess deaths in the ≥60-year-old urban-dwelling men using a similar method to compare our results with other excess death estimates for the ≥60-year-old specifically.
Finally, we estimated excess deaths among all urban dwellers in Mainland China by summing the excess deaths in urban-dwelling men with those in urban-dwelling women. We estimated excess deaths in urban-dwelling women based on the male-to-female ratio of reported COVID-19 deaths in Hong Kong SAR occurring both inside and outside hospitals,10 adjusting for the difference in relative sizes of male and female populations between Hong Kong SAR and Mainland China. Similar to the previous extrapolation, we estimated excess deaths in urban-dwelling women by assuming the RR of excess deaths by sex in Mainland China urban dwellers to be equal to the RR of COVID-19 deaths by sex in Hong Kong. That is, Excessdeathswomen,MainlandPopulationwomen,MainlandExcessdeathsmen,MainlandPopulationmen,Mainland=COVID−19deathswomen,MainlandPopulationwomen,MainlandCOVID−19deathsmen,HKSARPopulationmen,HKSAR.2,11
In all estimates, we developed a 95% CI to account for uncertainty in the excess death rate among the ≥80 urban-dwelling men only; it did not account for uncertainties around the census population estimates by age and sex in Mainland China urban dwellers and in Hong Kong residents, male-to-female ratio, and age distribution of COVID-19 deaths in Hong Kong. Given the large sample sizes in data giving rise to these estimates and parameters,2,10,11 their uncertainties were negligible. CIs for the extrapolated estimates were calculated by multiplying the upper and lower uncertainty bounds from the ≥80, urban-dwelling male estimate by the same factor as the point estimate.
RESULTSFigure 1 displays the number of senior members alive at the beginning of each month and those who died during that month for each month from 1 January 2017 to 31 May 2023. A total of 15 senior CAE members aged ≥80 years died in December 2022 and 11 in January 2023, compared to three or fewer deaths in each of the other months since 2017. eAppendix 1; https://links.lww.com/EDE/C111 shows the breakdown by age groups. During December 2022–January 2023, the estimated rate of excess deaths was 0.94 (95% CI = −0.54, 3.16) per 100 persons for members aged 80–84 years old, 3.95 (95% CI = 0.50, 7.84) for those 85–89 years old, 10.35 (95% CI = 3.59, 17.71) for those 90–94 years old, and 16.88 (95% CI = 0.00, 34.62) for those 95 years old and above.
EXTRAPOLATION TO NATIONWIDE URBAN DWELLERSWe estimated the number of Mainland China-wide excess deaths among urban-dwelling men aged ≥80 years to be 253,000 (95% CI = 117,000, 401,000) and among urban-dwelling men aged ≥60 years to be 407,000 (95% CI = 189,000, 644,000). We estimated the number of excess deaths among urban-dwelling men (all ages) as 575,000 (95% CI = 267,000, 911,000). Last, we estimated that 917,000 (95% CI = 425,000, 1.45 million) excess deaths occurred in Mainland China among urban dwellers of both sexes during December 2022–January 2023.
OFFICIAL COUNTThe exact number of COVID-19 deaths was not reported by the official health authority on a daily basis. We extracted the daily official death count from a graph published by the Chinese CDC showing that there were approximately 81,000 in-hospital deaths officially reported from 9 December 2022 to 30 January 2023 (Taiwan, Hong Kong SAR and Macau SAR excluded).6
DISCUSSIONBy comparing the observed death count during December 2022–January 2023 to the historical baseline in recent years among senior CAE members, we estimated the number of excess deaths due to COVID-19 among the members and extrapolated the rate to estimate the number of such deaths among the urban population in Mainland China. The wide gap between our excess death estimate of 917,000 (95% CI = 425,000, 1.45 million) and the official death toll suggests that COVID-19 had a much larger mortality impact than officially documented.
Xiao et al.12 used obituary data from three universities in Mainland China and Baidu search engine data and estimated that there were 1.87 million excess deaths among individuals aged ≥30 years old from December 2022 to January 2023 (the same estimation period as ours). Du et al.13 estimated that a total of 1.4 million deaths related to severe acute respiratory syndrome coronavirus 2 infections occurred from 8 December 2022 to 19 January 2023 in Mainland China. Our estimate was consistent with these estimates, considering that the 917,000 excess deaths pertained to urban dwellers accounting for 64% of the total population. In Hong Kong SAR, Chong et al.14 estimated an excess death rate of 0.9% among individuals aged ≥65 years old in January–May 2022. In the United Kingdom, the cumulative excess deaths were 2.2% above the average of 2015 to 2019 among ≥65 years old, January 2020–June 2022.15 We estimated 407,000 excess deaths among Mainland China urban-dwelling men aged ≥60 years, which could be converted into 0.6% excess deaths among urban dwelling men aged ≥60 years during the 2-month period (December 2022–January 2023). However, the above excess deaths are not directly comparable across populations in different regions or countries given the higher death rate in men, the difference in the length of the estimation period, the age structure of each area, and other differences such as vaccination uptake.
The fact that the official death count underestimated the true COVID-19 fatalities is a global phenomenon.16 The official COVID-19 death count in Mainland China was an undercount because it included in-hospital deaths among confirmed cases only and likely missed a substantial number of individuals who died at home or perhaps shortly after arrival at the hospital, given that hospitals were overloaded during the surge. In addition to the sudden increase in deaths among CAE members, other evidence also supported a larger death toll during that period, given the steep increase in obituaries published by the Chinese Academy of Science and other top institutions.17
One strength of this analysis of excess deaths is the use of primary data on all-cause mortality (rather than model-predicted mortality) based on the cohort of senior CAE members. Second, as CAE is one of the most prestigious academic institutes in Mainland China, members are nationally renowned scholars; it is unlikely that dates of death were misreported or any deaths were missed. However, our analysis is subject to multiple limitations. First, the extrapolation could be biased in either direction given the differences between senior CAE members and the general urban dwellers in terms of comorbidity and access to healthcare. It was plausible that senior CAE members might have access to better health care than the average urban male of the same age in mainland China. This might suggest that age- and sex-specific mortality rates would be higher among the general population than among senior CAE members. Alternatively, if this better care had been available for a substantial part of the members’ lives before the study period, those remaining alive at a given age might be frailer than those in the general population. Depending on the balance of these two effects, senior CAE members could have lower or higher mortality than similar members of the general population.18,19 Another limitation was that we used COVID-19 death data from Hong Kong to extrapolate excess deaths from ≥80-year-old male to ˂80-year-old male and then to female urban dwellers in Mainland China, adjusted for the relative population sizes. We assumed that the excess deaths were due to COVID-19 but that could be wrong, although this assumption was widely used to estimate deaths due to COVID-19 in the context of wrong death attribution and severe under-reporting. We estimated excess deaths using data from senior CAE members, and all extrapolations beyond the ≥80-year-old urban-dwelling men were based on Hong Kong’s COVID-19 death data from 31 December 2021 to 29 January 2023, which included 11 months before December 2022, whereas Omicron was the dominating variant in Hong Kong as for December 2022–January 2023 in Mainland China.10 We assumed that RR for COVID-19 deaths by age group (≤80 years old versus >80 years old) in Hong Kong was similar to RR for excess deaths by age group among urban-dwelling men in Mainland China and that the RR by sex was also similar in the two settings. Our estimate was subject to change if demographic factors, household contact patterns, access to healthcare, vaccination coverage, antiviral usage, and other factors were different between Hong Kong and China. This assumption was untestable because of the lack of historical data on COVID-19 deaths before the relaxation of zero-COVID policies: there were only two COVID-19 deaths reported in Mainland China in 2021,20 and 597 reported from January to November 2022.21–25 Age distribution and male-to-female ratio in COVID-19 deaths in Mainland China were not published. Third, the official count of 81,000 deaths from 9 December 2022 to 30 January 2023 was extracted from a graph (rather than an exact count that was reported) and thus was an approximation only. Furthermore, we could not ascertain the city of residence and city of death for each CAE member. It was common for the senior CAE members to work at universities, laboratories, and research institutes in the cities before retirement, and thus we assumed that they lived in urban areas during the study period. Finally, the estimate excluded deaths among 36% of nonurban dwellers. Due to differences in vaccination uptake, testing, healthcare resources, and comorbidity, the results based on CAE members could not be extrapolated to rural China, and there is no data that we are aware of on COVID-19 deaths in rural China.
Using time-series data on all-cause mortality among senior members of CAE, we estimated that nearly a million excess deaths occurred in December 2022–January 2023 among urban dwellers in Mainland China. The observed death count among senior CAE members was not compatible with the low death rate based on official statistics. As has occurred elsewhere in the world, the true impact of COVID-19 on mortality in Mainland China was much higher than what was officially documented.
ACKNOWLEDGMENTSWe acknowledge Pablo Robles, Vivian Wang, and Joy Dong whose article (https://www.nytimes.com/interactive/2023/02/05/world/asia/china-obits-covid.html) in the New York Times on 5 February 2023 brought this data source to our attention. This article was written after confirming that they had no plans to make an extrapolation to nationwide death rates. We also thank Dr. Ben Cowling and Dr. Peng Wu for valuable suggestions on the manuscript draft and the revised manuscript, respectively.
REFERENCES 1. Chinese Center for Disease Control and Prevention. Overview of Nationwide SARS-CoV-2 Infection Diagnosis, Treatment, and Monitoring Data. 2023. Available at: https://weekly.chinacdc.cn/fileCCDCW/cms/news/info/upload/ccdcw-surveillance-202212-202301-cn.pdf. Accessed 14 November 2023. 2. Office of the Leading Group of the State Council for the Seventh National Population Census. China Population Census Yearbook 2020. 2023. Available at: http://www.stats.gov.cn/sj/pcsj/rkpc/7rp/zk/indexch.htm. Accessed 21 November 2023. 3. National Health Commission of the People’s Republic of China. Briefing on the Latest Situation of the Novel Coronavirus Pneumonia Epidemic (as of November 30, 2022). 2023. Available at: https://www.gov.cn/xinwen/2022-12/01/content_5729767.htm. Accessed 14 November 2023. 4. Cai J, Deng X, Yang J, et al. Modeling transmission of SARS-CoV-2 omicron in China. Nat Med. 2022;28:1468–1475. 5. Leung K, Leung G, Wu J. Modelling the adjustment of COVID-19 response and exit from dynamic zero-COVID in China. medRxiv. 2022. 6. Chinese Center for Disease Control and Prevention. Latest Nationwide Situation of the Novel Coronavirus Pneumonia Epidemic. 2023. Available at: https://www.chinacdc.cn/jkzt/crb/zl/szkb_11803/jszl_13141/202302/t20230201_263576.html. Accessed 14 November 2023. 7. The Chinese Academy of Engineering. List of deceased members. 2023. Available at: https://www.cae.cn/cae/html/main/col56/column_56_1.html. Accessed 23 June 2023. 8. The Chinese Academy of Engineering. List of all members (as of November 15, 2023). 2023. Available at: https://www.cae.cn/cae/html/main/col48/column_48_1.html. Accessed 15 November 2023. 9. The Chinese Academy of Engineering. Implementation Guidance on Election of Members of Chinese Academy of Engineering. 2023. Available at: https://www.cae.cn/cae/html/main/col244/2023-05/31/20230531081256138374494_1.html. Accessed 15 November 2023. 10. Centre for Health Protection. Provisional Data Analysis on COVID-19 Reported Death Cases. 2023. Available at: https://www.coronavirus.gov.hk/pdf/death_analysis/death_analysis_20230129.pdf. Accessed 14 November 2023. 11. Census and Statistics Department, Hong Kong Special Administrative Region. 2021 Population Census: Main Results. 2022. Available at: https://www.censtatd.gov.hk/en/data/stat_report/product/B1120109/att/B11201092021XXXXB0100.pdf. Accessed 14 November 2023. 12. Xiao H, Wang Z, Liu F, Unger JM. Excess all-cause mortality in China after ending the zero COVID policy. JAMA Netw Open. 2023;6:e2330877. 13. Du Z, Wang Y, Bai Y, Wang L, Cowling BJ, Meyers LA. Estimate of COVID-19 deaths, China, December 2022–February 2023. Emerg Infect Dis. 2023;29:2121–2124. 14. Chong KC, Chan PK, Hung CT, et al. Changes in all-cause and cause-specific excess mortality before and after the Omicron outbreak of COVID-19 in Hong Kong. J Glob Health. 2023;13:06017. 15. Office for National Statistics (ONS). Comparisons of All-Cause Mortality between European Countries and Regions: 28 December 2019 to Week Ending 1 July 2022. 2022. Available at: https://www.ons.gov.uk/peoplepopulationandcommunity/birthsdeathsandmarriages/deaths/articles/comparisonsofallcausemortalitybetweeneuropeancountriesandregions/28december2019toweekending1july2022. Accessed 15 November 2023. 16. Wang H, Paulson KR, Pease SA, et al. Estimating excess mortality due to the COVID-19 pandemic: a systematic analysis of COVID-19-related mortality, 2020–21. Lancet. 2022;399:1513–1536. 17. Robles P, Wang V, Dong J. In China’s Covid Fog, Deaths of Scholars Offer a Clue. 2023. Available at: https://www.nytimes.com/interactive/2023/02/05/world/asia/china-obits-covid.html. Accessed 15 November 2023. 18. Vaupel JW, Yashin AI. Heterogeneity’s ruses: some surprising effects of selection on population dynamics. Am Stat. 1985;39:176–185. 19. Beckett M. Converging health inequalities in later life—an artifact of mortality selection? J Health Soc Behav. 2000;41:106–119. 20. The National Administration of Disease Control and Prevention. The Epidemic Situation of Statutory Reporting Infectious Diseases in 2021. 2022. Available at: http://www.nhc.gov.cn/jkj/s3578/202204/4fd88a291d914abf8f7a91f6333567e1.shtml. Accessed 14 November 2023. 21. The National Administration of Disease Control and Prevention. The Epidemic Situation of Statutory Reporting Infectious Diseases in November 2022. 2022. Available at: https://www.cdctj.com.cn/system/2022/12/28/030099083.shtml. Accessed 14 November 2023. 22. The National Administration of Disease Control and Prevention. The Epidemic Situation of Statutory Reporting Infectious Diseases in January to May and July, 2022. 2022. Available at: http://www.nhc.gov.cn/jkj/s3578/new_list.shtml. Accessed 14 November 2023. 23. The National Administration of Disease Control and Prevention. The Epidemic Situation of Statutory Reporting Infectious Diseases in June, 2022. 2022. Available at: http://www.nhc.gov.cn/jkj/s3577/202207/d81b8cfb483a4165942acc1f63377039.shtml. Accessed 14 November 2023. 24. The National Administration of Disease Control and Prevention. The Epidemic Situation of Statutory Reporting Infectious Diseases in August, 2022. 2022. Available at: http://www.nhc.gov.cn/xcs/fkdt/202209/3aa12c2c369a436e856d1340a54d92e8.shtml. Accessed 14 November 2023. 25. The National Administration of Disease Control and Prevention. The Epidemic Situation of Statutory Reporting Infectious Diseases in September-October 2022. Gazette of the National Health Commission of the People’s Republic of China. 2022(9-10):6–8.
留言 (0)