
記住我

Many observational studies have consistently found that individuals with cancer have a lower risk of developing dementia when compared with individuals with no history of cancer.1–4 One of the first observations of this inverse association included residents of Hiroshima and Nagasaki when they were over 60 years old (1992–1996),5 a finding replicated in many other studies following similar analytic techniques.6–14 This body of research has motivated substantial conjectures and research toward biologic mechanisms, including molecular and genetic pathways that may explain this association, and has resulted in discussions of repurposing or augmenting current cancer treatments for dementia. In turn, researchers have also raised concerns related to the competing event of death, unmeasured confounding, and ascertainment error that could explain the repeatedly observed cancer-dementia inverse association.10,15 However, understanding these or other potential sources of bias first requires making explicit a causal question.
Though not explicitly rendered, the body of research on biologic mechanisms that might explain this association is implicitly interpreting cancer status as a proxy for the unmeasured (nonexistent) treatment or unmeasured mechanism behind it. So far, the strongest arguments to conceptualize potential targets for treatment rely on more recent lab-based studies that outline novel mechanistic pathways. One of these is related to the protein Pin1, which is involved in different processes during the cell cycle, such as cell proliferation and apoptosis. It works as a molecular timer that activates or inactivates different pathways, like a switch.12,13,16,17 In cancer, Pin1 is overstimulated and increases cell proliferation, angiogenesis, migration and invasion, and inhibits apoptosis of tumor cells in several ways. Conversely, Pin1 is inhibited in Alzheimer's disease (AD), and previous studies have shown that Pin1 knockout mice developed a syndrome similar to AD characterized by hyper-phosphorylated tau and neurodegeneration.18 Recent observational studies have speculated that Pin1 overexpression explains the inverse association between cancer diagnosis and dementia, though again Pin1 was not explicitly part of each study’s stated research question.19–26
Therefore, if we—hypothetically speaking—1 day could develop a drug that increases Pin1 expression specifically in brain tissue in hopes of preventing dementia, we could pose the question: What is the effect of this Pin1-targeting drug on the risk of dementia over time compared with standard treatments? Since the research community is interested in learning about this effect using current real-world data, we discuss the challenges that arise from leveraging assumptions on proxy variables that are measured, such as cancer diagnosis. We discuss key issues that have been raised in the literature on this topic and illustrate how these translate into different analytic decisions using data collected from the Rotterdam Study, a population-based cohort study. We emphasize that enumerating an explicit causal question is one step toward tying a research study to a question that is relevant to decision-making,27,28 especially since these results are motivating discussions of repurposing or augmenting current cancer treatments for dementia prevention.14 In the discussion we return to how our approach is guided by, yet departs from, some commonly accepted best practices in causal inference.29,30
METHODS Research QuestionIf this hypothetical Pin1-targeting drug was developed, the best way to understand its effect on dementia risk would be to have a well-conducted randomized trial. If this drug was intended for prevention, the target population could be defined as individuals in late midlife (e.g., ages 50–60 years) without a history of cancer and free of cognitive decline at baseline. Participants would have their Pin1-brain-specific plasma biomarker measured at baseline and be randomly assigned to either receive this drug or not. All participants would be closely monitored for dementia onset over a lengthy follow-up.
Methodologic Challenges to Answer This Question With Current Observational DataSince this drug is currently nonexistent, at best we could use observational data on Pin1 plasma measurements, and hypothesize that lower levels would increase the risk of dementia, while higher levels would reduce this risk. Once Pin1 biomarker tests are approved and available, researchers can measure this biomarker using stored blood samples from participants who meet the same eligibility criteria as for the ideal trial, recruited for a population-based cohort. However, Pin1 expression is not an available biomarker for population-based research, which directs us to the use of a proxy measurement that captures this mechanism. Since several observational studies have outlined Pin1 as a potential mechanism behind the inverse association between cancer diagnosis and dementia, we argue that cancer diagnosis has been used implicitly as a proxy for Pin1 expression. The underlying argument is that Pin1 is over-expressed in tumors,12,16,17,31 and tumors are only diagnosed through the clinical diagnosis of cancer. With that reasoning, below we discuss two methodological challenges that arise when we make this leap. Going forward, we only attempt to test the sharp causal null hypothesis that Pin1 has no effect on dementia in any individuals. That is, an (adjusted) association between cancer and dementia in our proposed analyses is at best interpretable as evidence against a null effect. Though effect estimation may also be possible, it would take further and unenumerated assumptions about the relationship between Pin1 and cancer diagnosis to describe how the magnitude of cancer-dementia association is related to the likely magnitude of a Pin1-dementia effect.
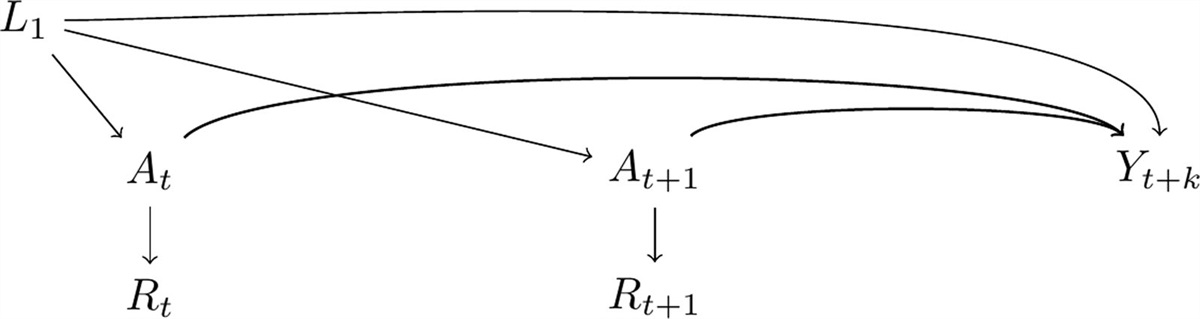
Cancer OperationalizationIn the causal diagram32 in Figure 1, we present Pin1 expression as At and At+1 and dementia diagnosis by time t+k as Yt+k and L1 represents shared causes between the exposure and the outcome. In this graph Rt and Rt+1 represent cancer diagnosis over time, the measured proxy of At and At+1, respectively. Although this means we would measure the association between cancer diagnosis over time and dementia in the observed data, we are assuming that the captured effect is only through the pathway that involves Pin1 expression over time. That is, we only have measurements of Rt+1 and a subset of L1, but our question remains focused on the effect of At and At+1. We consider Pin1 and cancer diagnosis as time-varying exposures, because unlike measuring Pin1 at the same time for all participants (though this would not necessarily mean this would be the ideal time to measure it, we discuss this point further in the Discussion section), cancer diagnosis is frequently collected during follow-up. Although L1 can be time-varying in nature, we only depict L1 at one time point for readability.
 FIGURE 1.: Causal-directed acyclic graph highlighting the use of incident cancer diagnosis as a proxy for Pin1 expression. Pin1 at time
 t
andt+1
are represented asAt
andAt+1
, respectively; dementia at timet+k
is represented asYt+k
;L1
represents shared causes of Pin1 and dementia; incident cancer diagnosis at timet
andt+1
are represented asRt
andRt+1
. To isolate the effect ofAt
andAt+1
onYt+k
we need to block the backdoor pathYt+k←L1→At
andYt+k←L1→At+1
. Although we representL1
as a single node for readability,L1
is time-varying too.Using incident cancer diagnosis as the proxy for Pin1 adds a layer of complexity. As opposed to the randomized trial where both treatment and control arm have their “time zero” aligned—that is, the time when eligibility criteria are met, “treatment” is assigned, and screening for dementia begins, in this setting we only have time for follow-up. Previous studies offered contradictory recommendations to operationalize cancer for this question, given this challenge. For example, a literature review on this topic recommended excluding prevalent cancer cases or analyzing separately prevalent and incident cases because prevalent cases are vulnerable to survival bias.4 However, a more recent study that studied this association in the UK Biobank restricted the analysis specifically to “prevalent cancer cases” claiming this would prevent survivor bias.33 In the past, studies have defined the exposed group with cancer as those participants with prevalent or incident cancer diagnosis (alternatively defined as “ever cancer”).19 This meant that a participant who had cancer diagnosis over follow-up contributed all their person-time to the cancer arm, including the time before the cancer diagnosis, which induces immortal time bias.30,34
Being explicit about using cancer as the proxy for Pin1 is helpful because the timing closer to the diagnosis might be more representative of Pin1 overexpression, compared with the time when cancer treatment could have affected Pin1 expression. Therefore, excluding prevalent cancer cases seems more reasonable. However, recognizing the time-varying nature of cancer diagnosis is not free of assumptions.2,12,24 In this case we are implicitly assuming that Pin1 would overexpress at the time of cancer diagnosis and not before, which is biologically implausible. The time between the first biological changes that eventually can lead to cancer and cancer manifestation can range between 5 and 40 years.31 Moreover, cancer diagnosis will only be measured in the subset of participants who are alive over follow-up. Thus, in Figure 2 we included death before cancer diagnosis as Dt+1 and an arrow between Dt+1 and At+1 such as that At+1 is only observed if Dt+1 is zero. This can also create immortal time bias, if not addressed correctly, though there are several analytic strategies to overcome it.30,34 In addition, we added an arrow between L1 and Dt+1, since covariates such as smoking may affect Pin1 overexpression but also affect the risk of death due to other causes such as from chronic obstructive pulmonary disease.
 FIGURE 2.: Causal-directed acyclic graph highlighting the time-varying nature of cancer diagnosis and immortal time bias. Pin1 at time
 t
andt+1
are represented asAt
andAt+1
, respectively; dementia at timet+k
is represented asYt+k
;L1
represents shared causes of Pin1 and dementia; incident cancer diagnosis at timet
andt+1
are represented asRt
andRt+1
.Dt+1
represents death at timet+1
, cancer diagnosis att+1
can only be measured among those who are alive att+1
.Death as a Competing EventFurthermore, death plays a major role in this question, as it acts as a competing event for dementia. We illustrate this feature in Figure 3, where we exclude the time-varying process of cancer diagnosis for better interpretability and focus on Pin1 (and cancer diagnosis) as it had been measured in all participants at time t+1. In this causal diagram we include a node for death after Rt+1 has been measured, represented as Dt+k, which acts as a competing event of Yt+k because if a participant dies by t+k, the participant cannot have a dementia diagnosis subsequently. Since Dt+k and Yt+k are events related to aging and its consequences, L2 represent the shared causes of both events such as cardiovascular conditions. We also include an arrow between L1 and Dt+1 following the argument discussed previously.
 FIGURE 3.: Causal-directed acyclic graph highlighting death as a competing event of dementia Pin1 at time
 t
andt+1
are represented asAt
andAt+1
, respectively; dementia at timet+k
is represented asYt+k
;L1
represents shared causes of Pin1 and dementia; incident cancer diagnosis at timet
andt+1
are represented asRt
andRt+1
;Dt+1
represents death at timet+1
. In this graph we only focus attention to the exposure as if it was measured for all at timeAt+1
. We includeDt+k
as death at timet+k
sinceYt+1
is only observable when participants are alive att+k
.L2
represents possible shared causes of dementia and death (such as cardiovascular comorbidities). Pin1 may affect the risk of death through cancer diagnosis, represented as an arrow betweenRt+1
andDt+k
. To isolate the direct effect ofAt+1
andYt+k
, we have to block the backdoor pathway fromYt+k←L2→Dt+k←Rt+1←At+1
andYt+k←Dt+k←L1→At+1
.In the setting where At+1 represents the targeted drug for Pin1, and if this drug had no systemic side effects such as that there is no arrow between At+1 and Dt+k, a total effect would quantify the effect of At+1 on Yt+k that does not include any pathway mediated throughDt+k.35 However, in the context of cancer diagnosis as the proxy for Pin1 overexpression, we cannot rule out the effect of cancer on death, represented as the arrow between Rt+1 and Dt+k. Since the total effect of At+1 in Yt+k includes the indirect causal pathway mediated by the effect of cancer diagnosis on mortality, this may translate into an inverse association36 if we consider the effect of cancer itself, not the treatment after cancer diagnosis.
To isolate the direct effect of At+1 in Yt+k from the effect mediated by Dt+k, we consider a scenario where death could have been prevented and define death as a censoring event. This has been the most frequent approach in prior studies on this association, but there has been some misconceptions around this term, considering censoring equivalent to ignoring.23 When we define death as a censoring event we rely on conditional exchangeability for censoring, also defined as the conditional independent censoring assumption.35,36 This assumption requires that we have measured all shared causes L2 to block the pathway Yt+k←L2→Dt+k←Rt+1←At+1. Several studies have defined death as a censoring event, although failed to make the independent censoring assumption explicity and did not consider its plausibility.23 Moreover, adjusting for time-fixed shared causes between dementia and death may be insufficient to block this pathway, and therefore time-varying measurements L2 (including cancer itself) should be considered.
To summarize, spelling out the data generation mechanisms to identify the effect of Pin1 on dementia risk while using cancer diagnosis as proxy for Pin 1 how many layers of assumptions are required to attempt to obtain a valid estimate. The full graph is observed in Figure 4—we acknowledge that this is a simplified version since we omitted additional arrows from L1 to Rt and Rt+1 for brevity, and other sources of measurement error and the time-varying nature of all nodes and feedback loops between them, which would further complicate interpretability.32
 FIGURE 4.: Causal-directed acyclic graph depicting multiple challenges to using the proxy of cancer diagnosis to study the effect of Pin1 on risk of dementia. Pin1 at time
 t
andt+1
are represented asAt
andAt+1
, respectively; dementia at timet+k
is represented asYt+k
;L1
represents shared causes of Pin1 and dementia; incident cancer diagnosis at timet
andt+1
are represented asRt
andRt+1
;Dt+1
andDt+k
represents death at timet+1
andt+k
;L2
represents possible shared causes of dementia and death. The distinct challenges were highlighted separately in Figures 1–3.STUDY POPULATIONWe use data collected in the Rotterdam Study, a population-based prospective cohort study among persons living in the Ommoord district in Rotterdam, the Netherlands. Recruitment and initial assessments were held between 1990 and 1993, a second wave of recruitment was held between 2000 and 2001. Participants from the first subcohort had follow-up visits between 1993 and 1995, 1997 and 1999, 2002 and 2005, and 2008 and 2010, while the second subcohort had follow-up visits between 2004 and 2005, and between 2011 and 2012.37 All participants had data on history of cancer and dementia and incident diagnosis, collected from medical records of general practitioners (including hospital discharge letters) and through linkage with national registries (more description in eAppendix; https://links.lww.com/EDE/C107). Date and cause of death were collected via municipal population registries. These ascertainment methods imply that the Rotterdam Study has functionally no loss to follow-up with respect to dementia diagnosis and death.
Eligibility criteria included: ages 60 to 70 years at study entry; no history of cancer diagnosis, no history of dementia diagnosis; and free of cognitive decline (defined by a Mini-Mental Score ≥26). Out of 10,998 persons who participated in the study entry, 3634 were considered eligible. Time to cancer diagnosis, time to dementia diagnosis, and death status were measured for all participants. All participants were followed from study entry until dementia diagnosis, death, or 20 years after their individual baseline date, whichever occurred first. Given that participants from the second subcohort were followed for 15 years, we assume that they would have had a similar distribution of dementia risk and mortality as the first subcohort, between years 15 and 20 of follow-up.
The Rotterdam Study has been approved by the Medical Ethics Committee of the Erasmus MC (registration number MEC 02.1015) and by the Dutch Ministry of Health, Welfare, and Sport (Population Screening Act WBO, license number 1071272-159521-PG). The Rotterdam Study Personal Registration Data collection is filed with the Erasmus MC Data Protection Officer under registration number EMC1712001. The Rotterdam Study has been entered into the Netherlands National Trial Register and into the WHO International Clinical Trials Registry Platform under shared catalogue number NTR6831. All participants provided written informed consent to participate in the study and to have their information obtained from treating physicians.
STATISTICAL METHODSWe illustrate the association between cancer and dementia diagnosis under two scenarios, the first of which replicates a common analytic strategy and the second which mitigates some (but not all) the biases described above. Scenario A replicates the setting that defines cancer proxy as “cancer ever vs. never,”19 meaning we compare dementia outcomes in individuals who ever develop cancer during follow-up to those who were not observed to develop cancer during follow-up. Scenario B defines cancer diagnosis as time-varying meaning that time before cancer diagnosis is allocated to the nonexposed arm, and the time after cancer diagnosis to the exposed arm. To address confounding, we fit inverse probability treatment weights, truncated at the 99th percentile. In Scenario A, weights were defined as the inverse of the probability of cancer diagnosis conditional on the following baseline covariates: age at study entry, sex, APOE-ε4 status, educational attainment, cohort, and smoking status. In contrast, for Scenario B, weights were defined to represent the product of the inverse probability of being diagnosed with cancer over time, conditional on the time-varying covariate history before cancer diagnosis.35 Once participants had cancer, their weights were set to 1. Baseline covariates included age at study entry, sex, APOE-ε4 status, educational attainment, and the time-varying covariates included smoking status, systolic blood pressure, body mass index, and prevalent and incident hypertension and diabetes.
We calculated inverse probability censoring weights for death, assuming independent censoring conditional on measured covariates. In Scenario A, weights represent the inverse of the probability of not dying conditional on cancer diagnosis (ever vs. never) and the baseline covariates age, educational attainment, APOE-ε4 status, and baseline measurements of smoking status, hypertension status, systolic blood pressure, body mass index, history of diabetes and cohort. For individuals who died, their censoring weight is zero.32 In Scenario B time-varying weights represent the product of the inverse probability of surviving in each year before t, conditional on the measured shared causes of death and dementia. For an individual who has died by time t, the year t censoring weight is zero.35 We fitted weights including the same covariates used for time-varying cancer diagnosis, and added time-varying cancer, stroke, and heart disease diagnosis as predictors for death. Further details are presented in the eAppendix; https://links.lww.com/EDE/C107.
To estimate the controlled direct effect of Pin1 on the risk of dementia, we compared the complement of a weighted Kaplan–Meier survival estimator for participants who developed cancer versus those who did not, with time indexed in years. The weights are time-varying by follow-up year, defined as a product of the year-specific inverse probability of treatment weights and the inverse probability of censoring by death weights. Estimates of the controlled direct effect are presented as 20-year risk differences and risk ratios (RR). We calculated all 95% confidence intervals (CI) using percentile-based bootstrapping based on 500 bootstrap samples. For illustrative and comparative purposes, we also calculated hazard ratios (HR). Hazards, unlike risks, inherently condition surviving both dementia and death, and as such a causal interpretation is problematic.35
Since the conditional independent censoring assumption is untestable, we compute Peterson upper and lower bounds36 to represent extreme scenarios of dependency: (1) the lower bound refers to a scenario where those who died would never develop dementia and (2) the upper bound that refers to a scenario where those who died would have a dementia diagnosis had they not died. The lower bound is calculated with the Aalen–Johansen estimator treating death as a competing event, and the upper bound is calculated with the Kaplan–Meier estimator for the combined outcome of dementia or death.
All analysis were performed using R. Code is available on GitHub (https://github.com/palolili23/2023_cancer_dementia).
RESULTSParticipants had a mean age of 64.5 years, and 54% (n = 1979) were women (Table 1). Over follow-up, 25% (n = 899) developed cancer, with a median age of cancer diagnosis at 73 (IQR = 69, 78). From the total sample, 13% (n = 460) were diagnosed with dementia over follow-up with a median age of 79 (IQR = 75, 83) years. Among participants with incident cancer, 6% (n = 53) had a dementia diagnosis, 63% (n = 567) died over follow-up, and 31% (n = 279) remained alive and dementia-free at 20 years since the study entry. eTable 1 in the eAppendix; https://links.lww.com/EDE/C107
留言 (0)