
記住我

Throughout the SARS-CoV-2 (i.e., COVID-19) pandemic, there were well-documented US racial–ethnic disparities in COVID-19 vaccination. Non-Hispanic Black, Hispanic, and American Indian and Alaska Native populations, for example, were less likely to receive the COVID-19 vaccine compared to White adults.1–3 Many studies attributed disparities to individual-level decisions (e.g., Black adults reported less confidence in the safety and efficacy of the COVID-19 vaccine than White adults.4,5 Black and Hispanic adults were more likely to have concerns about missing work due to the side effects of COVID-19 vaccine uptake than White adults6). However, disparities can also arise from structural factors, which include a longstanding history of systemic racism throughout the US healthcare system.7–10
There are documented examples of ways in which the US healthcare system can impact individuals’ healthcare utilization, including vaccination intentions. Previous studies found that individuals’ perceptions of the healthcare system were important drivers of intentions to use healthcare services11 (e.g., when individuals perceived barriers to their healthcare and/or concerns over receiving equal treatment, they were less likely to engage with the healthcare system12–14). In many cases, negative perceptions of the healthcare system decreased intentions to vaccinate.15–17 Moreover, prior research found that individuals developed perceptions of healthcare system inequities through both direct and indirect experiences with the healthcare system (i.e., personal experiences as well as vicarious experiences such as learning about negative healthcare experiences from friends, family, or the media).18,19 Given that racial–ethnic inequities in COVID-19 healthcare occurred throughout the pandemic (e.g., racial–ethnic disparities in access to COVID-19 testing, allocation of COVID-19 vaccine across racial–ethnic groups, and medical treatment for patients with COVID-1920–22), individuals from marginalized racial–ethnic groups may have directly or indirectly developed negative perceptions of the healthcare system. Therefore, perceived racial–ethnic inequities in COVID-19 healthcare may partially explain racial–ethnic disparities in COVID-19 vaccination uptake.
Recent studies examined perceived healthcare system inequities in the COVID-19 context.23–25 One nationally representative US study conducted during the COVID-19 pandemic found that compared to Non-Hispanic White adults, Non-Hispanic Black adults were more likely to report that “African Americans had a harder time accessing care than White Americans,” whereas Hispanic adults were less likely to report that “Latinos had a harder time accessing care than White Americans.”23 Another nationally representative study of Black adults living in the United States found that greater perceived racial differences in medical care and treatment by the healthcare system were associated with greater mistrust of the COVID-19 vaccine and, in turn, lower intentions of being vaccinated for COVID-19.24 In addition, a recent study conducted among a sample of US college students found that students who perceived higher racial–ethnic inequities in COVID-19 healthcare had greater COVID-19 vaccination intentions.25 This study25 measured perceived COVID-19 healthcare system inequities as an underlying or “latent” construct using three indicators of healthcare inequities.
Although these prior studies found evidence of racial–ethnic differences in perceived healthcare system inequities and their association with COVID-19 vaccination intentions, only one study25 examined perceived racial–ethnic inequities in COVID-19 healthcare as a latent construct. The use of a latent construct model measured by multiple indicators is well suited for assessing perceived racial–ethnic inequities in COVID-19 healthcare given that perceptions of healthcare system inequity are multifaceted26,27 and can be captured by various aspects of healthcare (e.g., interactions with providers, receipt of different health care services such as vaccinations or diagnostic tests). The multifaceted construct also represents underlying attitudes about the healthcare system, which provides a broader, well-rounded concept of perceived healthcare compared to single indicators. Given that attitudes are often difficult to measure using distinct, observable indicators, attitudes are typically conceptualized as latent constructs rather than using composite (i.e., average) scores of the indicators.28 The use of latent constructs also provides greater explanatory power and accounts for measurement error across items compared to single observed indicators and/or composite scores.29 In addition, previous studies23–25 did not directly examine associations between perceived racial–ethnic inequities in COVID-19 healthcare and willingness to receive the COVID-19 vaccine. Finally, previous studies used relatively smaller samples and were not nationally representative across all racial–ethnic groups and/or age groups.
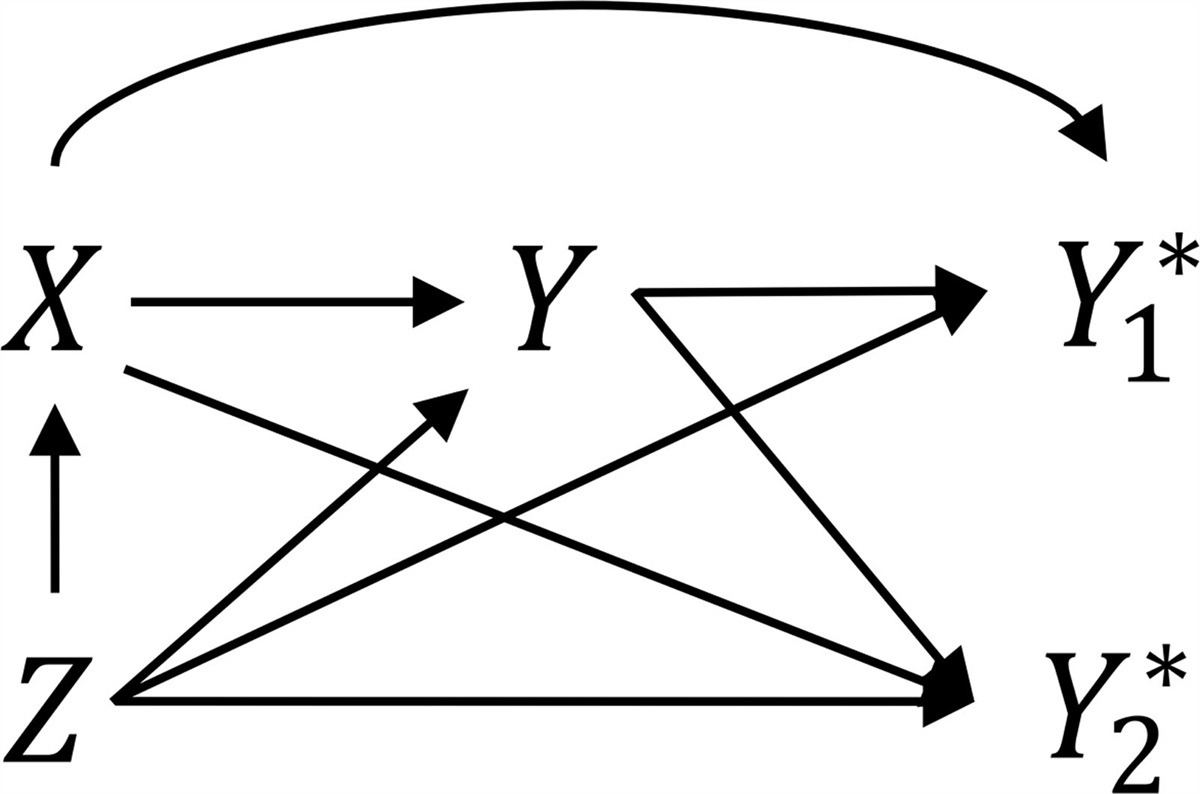
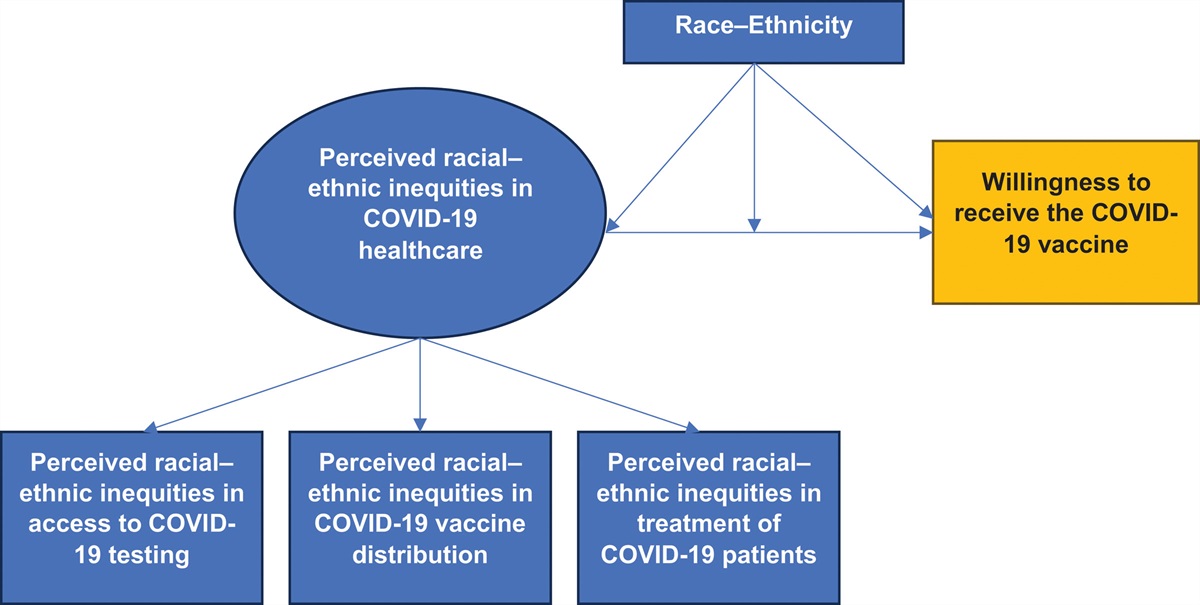
The present study addressed these gaps in the literature by using a large, nationally representative, diverse sample of US adults to first examine whether a latent factor of perceived racial–ethnic inequities in COVID-19 healthcare varied across racial–ethnic groups. Next, this study examined whether the latent factor was associated with willingness to receive the COVID-19 vaccine in the overall study population (Figure 1). Finally, the study examined whether the association between perceived racial–ethnic inequities in COVID-19 healthcare and willingness to receive the COVID-19 vaccine varied across racial–ethnic groups.
 FIGURE 1.:
 Conceptual model of perceived racial–ethnic inequities in COVID-19 healthcare and willingness to receive the COVID-19 vaccine.
METHODS Data Source and Study PopulationThe Race-Related Experiences Associated with COVID-19 and Health in the United States (REACH-US) study30 is a cross-sectional, online survey that was administered to a diverse, nationally representative sample of US adults between January 26, 2021 and March 3, 2021 using the YouGov, Inc. participant panel. YouGov Inc. is a nonpartisan research firm that recruits participants (~1.8 million US residents) via online advertising, email communication, and partner-sponsored solicitations.31 Participants received rewards or incentives for their participation.
The REACH-US study included 5500 adults, aged 18 years and older, from seven racial–ethnic groups (i.e., 500 American Indian/Alaska Native, 1000 Asian, 1000 Black/African American, 1000 Hispanic/Latino, 500 Multiracial, 500 Native Hawaiian/Pacific Islander, and 1000 White adults) living in the United States. YouGov panel members were proximity matched to a target sample of US adults generated from the 2018 American Community Survey 1-year data to achieve nationally representative estimates. Additional details about the recruitment methods, the stratified sampling approach to include a diverse set of racial–ethnic groups, the matching process, and propensity scoring to generate sample weights and nationally representative estimates within racial–ethnic groups are published elsewhere.32
Sample Sizes and Inclusion CriteriaFirst, we excluded participants who had received at least one dose of the COVID-19 vaccine (n = 355) from the analysis to capture their willingness to receive the COVID-19 vaccine. This resulted in a sample size of 5145 adults. Next, given the measurement noninvariance of the latent factor, we excluded the Hispanic or Latino Spanish language preference subgroup (n = 489) (see Statistical Analysis and Results sections for additional details). In the adjusted latent regression analyses, we further excluded participants who were missing any of the covariates (n = 33) or because of small cell sizes for gender identity (i.e., self-identified as transgender [n = 15] or reported their gender as not listed [n = 19]), which resulted in a sample size of 4589 participants. De-identified data were provided to the study team. The study was considered exempt, nonhuman subject research as determined by the Institutional Review Board of the National Institutes of Health.
Measures Willingness to Receive the COVID-19 VaccineWillingness to receive the COVID-19 vaccine was captured by asking participants, “Do you plan to get the COVID-19 vaccine once it becomes available?.” Response options included: (0) definitely not, (1) probably not, (2) probably yes, (3) definitely yes, (4) I have received one dose of the COVID-19 vaccine, and (5) I have received two doses of the COVID-19 vaccine. Consistent with prior literature,33 these responses were treated as an ordinal variable in the analysis: (1) “definitely not,” (2) “probably not,” (3) “probably yes,” and (4) “definitely yes.” To capture willingness to receive the COVID-19 vaccine, participants who had received at least one dose of the COVID-19 vaccine (n = 419) were excluded from the analysis.
Indicators of Perceived Racial–Ethnic Inequities in COVID-19 HealthcareWe used three indicators to capture perceived racial–ethnic inequities in COVID-19 healthcare. Access to COVID-19 testing was measured by “How true is it that racial and ethnic minority groups have less access to COVID-19 testing compared to Whites?” Response options included: (1) very true, (2) somewhat true, and (3) not true. COVID-19 vaccine distribution was measured by “How confident are you that the COVID-19 vaccine will be distributed fairly across racial and ethnic groups?” Response options included: (1) not confident, (2) somewhat confident, and (3) very confident. Given that this question asked about fair distribution, we reverse-coded these items to reflect increasing perceptions of inequity. Treatment of COVID-19 patients was measured by “How often have racial and ethnic minority patients with COVID-19 been treated unfairly by the US health care system because of their race or ethnicity?” Response options included: (0) never, (1) somewhat often, and (2) very often.
Race–Ethnicity and Sociodemographic CovariatesParticipants self-identified their race–ethnicity using three items. Participants self-identified whether they were of Hispanic, Latino, or Spanish origin (i.e., “no” or “yes”). If participants selected “yes,” we included them in a subgroup labeled “Hispanic/Latino,” which included participants from all gender identities (see gender items below). We further divided this Hispanic/Latino group by language preference (i.e., English or Spanish). Finally, participants self-identified their race using categories from the 2020 US Census. These three items were combined to include the race–ethnicity items of American Indian/Alaska Native, Asian, Black/African American, Hispanic/Latino English language preference, Hispanic/Latino Spanish language preference, Multiracial, Native Hawaiian/Pacific Islander, and White.
Sociodemographic characteristics included age in years (18–34, 35–49, 50–64, 65 and older), gender (man, woman, nonbinary, transgender, or not listed), education (high school or less, some college or 2-year college, 4-year college, or post-graduate), and annual household income (<20,000, 20,000–49,000, 50,000–100,000, or ≥100,000). In addition, we included sociodemographic items previously associated with COVID-19 vaccination as covariates34–37 (i.e., political ideology [conservative, liberal, moderate, and not sure], health insurance coverage [not covered or covered], and high-risk chronic health condition).
Statistical AnalysesThe present study consisted of three types of analyses: (1) descriptive analyses, (2) latent factor analyses, and (3) regression analyses. All analyses were weighted to be nationally representative within each racial–ethnic group. In sensitivity analyses, we reran all analyses when including the 355 participants who we previously excluded from the main analyses because they received at least one dose of the COVID-19 vaccine. These participants were included in the category of “definitely yes” in the sensitivity analyses.
Descriptive AnalysesWe used descriptive analyses to examine the distribution of sociodemographic characteristics in the study population, indicators of perceived racial–ethnic inequities in COVID-19 healthcare, and willingness to receive the COVID-19 vaccine. We performed descriptive analyses in R Version 4.1.2. We used chi-square difference tests to assess differences in the distributions of sociodemographic characteristics, indicators of perceived racial–ethnic inequities in COVID-19 healthcare, and willingness to receive the COVID-19 vaccine when stratified by race–ethnicity.
Latent Factor AnalysesIn the latent factor analyses, we used confirmatory factor analysis to examine perceived racial–ethnic inequities in COVID-19 healthcare as a latent factor and to examine the latent factor mean scores across racial–ethnic groups. The latent factor analyses were conducted in Mplus Version 8.6. The confirmatory factor analysis included probit regression and a diagonally weighted least squares estimator. Given the small number of missing responses for each of the indicators (i.e., <0.1%), a pairwise deletion approach was used with this estimator. This approach mitigated the loss of data by using all available cases in the data38 and allowed for the use of the full weighted study population (N = 5145) when examining the presence of the latent factor.
We used confirmatory factor analysis to examine the factor loadings (i.e., associations between the three indicators of perceived racial–ethnic inequities in COVID-19 healthcare and the latent factor representing perceived racial–ethnic inequities in COVID-19 healthcare). Standardized coefficient cutoffs for the correlations between each item and the latent factor included ≥0.50 as acceptable and ≥0.70 as strong factor loadings.39 Next, we assessed “measurement invariance” to confirm that the three indicators of perceived racial–ethnic inequities in COVID-19 healthcare measured the same underlying latent factor consistently across racial–ethnic groups.40 Multigroup confirmatory factor analysis was used to test model fit when introducing increased constraints of the factor loadings, thresholds, and residuals across racial–ethnic groups (eAppendix Figure 1; https://links.lww.com/EDE/C123). Additional details on the measurement invariance testing methods are included in the eAppendix; https://links.lww.com/EDE/C123. Racial–ethnic groups with measurement noninvariance were excluded from the subsequent analysis comparing latent factor mean scores and latent factor regression.
Following the confirmatory factor analysis and measurement invariance testing, we estimated the scores for each latent factor for each participant using maximum a posteriori estimation.41 We used an analysis of variance test to examine whether the average latent factor scores of perceived racial–ethnic inequities in COVID-19 healthcare varied across racial–ethnic groups.
Regression AnalysesWe conducted regression analyses to examine the association between perceived racial–ethnic inequities in COVID-19 healthcare and willingness to receive the COVID-19 vaccine in the overall study population and across racial–ethnic groups (see eAppendix Figure 2; https://links.lww.com/EDE/C123 for conceptual model). Latent factor regression was conducted in Mplus Version 8.6 and used an ordinal probit model with listwise deletion (i.e., excluding participants with missing data on any of the covariates [n = 33] or exclusion due to small cell sizes [gender identities of transgender and not listed ] from the regression analyses). The final weighted sample used in the regression analyses included 4589 participants. We used probit estimates and 95% confidence intervals (CIs) to assess the association between perceived racial–ethnic inequities in COVID-19 healthcare and willingness to receive the COVID-19 vaccine in the overall study population, adjusting for race–ethnicity and sociodemographic covariates.
We conducted the multigroup analysis using ordinal probit regression to examine the association between perceived racial–ethnic inequities in COVID-19 healthcare and willingness to receive the COVID-19 vaccine in each racial–ethnic group. In multigroup analysis, we estimated the overall regression model (i.e., willingness to receive the COVID-19 vaccine regressed on perceived racial–ethnic inequities in COVID-19 healthcare) in each racial–ethnic group, adjusting for sociodemographic covariates. We used Wald tests to examine differences in the associations between perceived racial–ethnic inequities in COVID-19 healthcare and willingness to receive the COVID-19 vaccine across racial–ethnic groups. Additionally, we assessed the adjusted probabilities of reporting “definitely not” to receiving the COVID-19 vaccine based on perceived racial–ethnic inequities in COVID-19 healthcare using item characteristic curves generated in Mplus and exported them to R for plotting.
RESULTS Descriptive AnalysesParticipants’ sociodemographic characteristics varied across racial–ethnic groups (Table 1). Overall, most participants (36%) reported that they would definitely get the COVID-19 vaccine once it became available (Table 2). COVID-19 vaccination intentions also varied across racial–ethnic groups. Asian adults had the highest proportion of participants who would definitely get the COVID-19 vaccine (47%), while American Indian/Alaska Native (29%) and Black/African American adults (22%) had the highest proportions of participants who would definitely not get the COVID-19 vaccine.
TABLE 1. - Study Population Characteristics and Perceptions of Racial-Ethnic Inequities in COVID-19 Healthcare Across Racial–Ethnic Groups Total (N = 5145) AI/AN (N = 458) Asian (N = 926) Black/AA (N = 951) Hispanic/Latino ELP (N = 463) Hispanic/Latino SLP (N = 489) MultiracialWeighted to be nationally representative within each racial–ethnic group (the weighted total for each racial-ethnic group is rounded and will not add to the weighted overall total). Less than 1% of participants were missing age (total population [0.1%] and Asian [0.1%]), gender (total population [0.1%], Multiracial [0.2%], White [0.3%]), annual household income (total population [0.2%], Asian [0.1%], Black/AA [0.3%], Multiracial [0.2%], White [0.5%]), political ideology (total population [0.1%], Black/AA [0.1%]), and health insurance coverage (total population [0.2%], AI/AN [0.4%], Asian [0.1%], Black/AA [0.1%], Hispanic/Latino SLP [0.2%], NH/PI [0.2%], White [0.2%]). Less than 2% of participants selected their gender as nonbinary (total population [1.2%], Asian [0.7%], Black/AA [0.6%], Hispanic/Latino ELP [0.6%], Hispanic/Latino SLP [0.2%], NH/PI [0.3%], White [0.9%]), transgender (total population [0.3%], Asian [0.6%], Hispanic/Latino ELP [0.3%], Multiracial [1.9%], NH/PI [0.5%], White [0.1%]) and not listed (total population [0.4%], Asian [0.6%], Hispanic/Latino ELP [0.3%], Multiracial [1.9%], NH/PI [0.5%], White [0.1%]).
All categories of sociodemographic characteristics varied across racial-ethnic groups (P values < 0.01).
We selected high-risk chronic health conditions using the Centers for Disease Control (CDC) guidelines on medical conditions (e.g., heart conditions, type 2 diabetes, asthma) that increase the risk for severe illness due to COVID-19. High-risk chronic health condition was included as a covariate and coded as 1 if participants reported at least one medical condition that was considered a high-risk chronic health condition. All other responses were coded as 0.
AI/AN indicates American Indian/Alaska Native; B/AA, Black/African American; ELP, English Language Preference; NH/PI, Native Hawaiian/Pacific Islander; SLP, Spanish Language Preference.
Weighted to be nationally representative within each racial-ethnic group. Less than 1% of participants perceived racial-ethnic inequities in access to COVID-19 testing (total population [0.1%], Asian [0.1%], Multiracial [0.4%], White [0.2%]), perceived racial-ethnic inequities in COVID-19 vaccine distribution (total population [0.1%], Black/AA [0.1%], White [0.2%]), perceived racial-ethnic inequities in treatment of COVID-19 patients (total population [0.1%], Asian [0.1%], Black/AA [0.1%], Multiracial [0.4%], White [0.2%]).
All categories of sociodemographic characteristics varied across racial-ethnic groups (P values <0.01).
AI/AN indicates American Indian/Alaska Native; Black/AA, Black/African American; ELP, English Language Preference; NH/PI, Native Hawaiian/Pacific Islander; SLP, Spanish Language Preference.
Overall, most participants (60%) reported that it was at least somewhat true or very true that marginalized racial–ethnic groups have less access to COVID-19 testing (34% and 26%, respectively) (Table 2). Most participants (71%) were not fully confident in the fair distribution of the COVID-19 vaccine (39% reported being somewhat confident and 32% reported not confident). Most participants (62%) reported that COVID-19 patients from marginalized racial–ethnic groups were treated unfairly by the healthcare system somewhat often (40%) to very often (22%). These responses to each indicator varied across racial–ethnic groups. Black/African American adults had the highest proportion of participants who reported that it was very true that marginalized racial–ethnic groups had less access to COVID-19 testing (37%), that they were not confident in the fair distribution of the COVID-19 vaccine across racial–ethnic groups (40%), and that COVID-19 patients from marginalized racial–ethnic groups very often get treated unfairly by the healthcare system (35%). White adults had the highest proportion of participants who perceived that it was not true that marginalized racial–ethnic groups have less access to COVID-19 testing (53%) and who reported that they were very confident that the COVID-19 vaccine was fairly distributed across racial–ethnic groups (40%). Hispanic/Latino adults with Spanish language preference had the highest proportion of participants who reported that COVID-19 patients from marginalized racial–ethnic groups were never treated unfairly by the healthcare system (53%).
Latent Factor AnalysesThe three indicators of perceived racial–ethnic inequities in COVID-19 healthcare were well represented by the latent factor and were measured consistently across all racial–ethnic groups, except for the Hispanic/Latino Spanish language preference subgroup. Therefore, we excluded the Hispanic/Latino Spanish language preference subgroup from the latent factor regression analysis. Additional details on the confirmatory factor analysis and measurement invariance testing results are included in the eAppendix; https://links.lww.com/EDE/C123.
The average l
留言 (0)