
記住我

Quantitative bias analysis is a set of methodologic approaches designed to address systematic sources of error (bias) in epidemiologic research. Analytic approaches exist to adjust for unmeasured confounding, measurement error of continuous variables, misclassification of categorical variables, and selection bias. Quantitative bias analysis is typically a two-step process, first involving estimation of bias parameter values that quantify the magnitude and uncertainty of systematic error due to unmeasured confounding, measurement error, or selection bias. Then, the bias parameter values are applied to study data or effect estimates to adjust for systematic error in a deterministic or probabilistic bias analysis. In recent years, there have been methodologic developments related to quantitative bias analysis, but comparatively less focus on approaches for estimating bias parameters.
Bias parameters are often estimated through validation studies. When a researcher is faced with concerns about a potential source of bias in their study, they can conduct a validation study to estimate bias parameter values and then apply the bias parameter values in quantitative bias analysis. There are two sources of data to inform the values for bias parameters from a validation study: internal and external. Internal validation data come from within (i.e., are internal to) the analytic cohort for the study. An example of this is when there is a gold standard measurement of exposure available for a subset of individuals in a study cohort, and a less accurate measure of exposure available for the total cohort. These internal validation data can be used to estimate the bias parameter values required for quantitative bias analysis. In other instances, there may be no internal validation data, and investigators must turn to external data sources to estimate bias parameters for analysis. This is a common occurrence, especially for researchers using large-scale data resources that have been collected for nonresearch purposes. Consider a medical claims database with billing codes that can be used to estimate the exposure–outcome relationship of interest, but with no data available on potentially relevant confounding variables such as smoking status. Researchers could turn to an external data source to obtain estimates of the bias parameter values for a quantitative bias analysis of unmeasured confounding: information on the strength of the relationships between the confounder and exposure and confounder and outcome. Under specific assumptions, estimates of bias parameter values from an external data source can be applied to the study data for quantitative bias analysis.
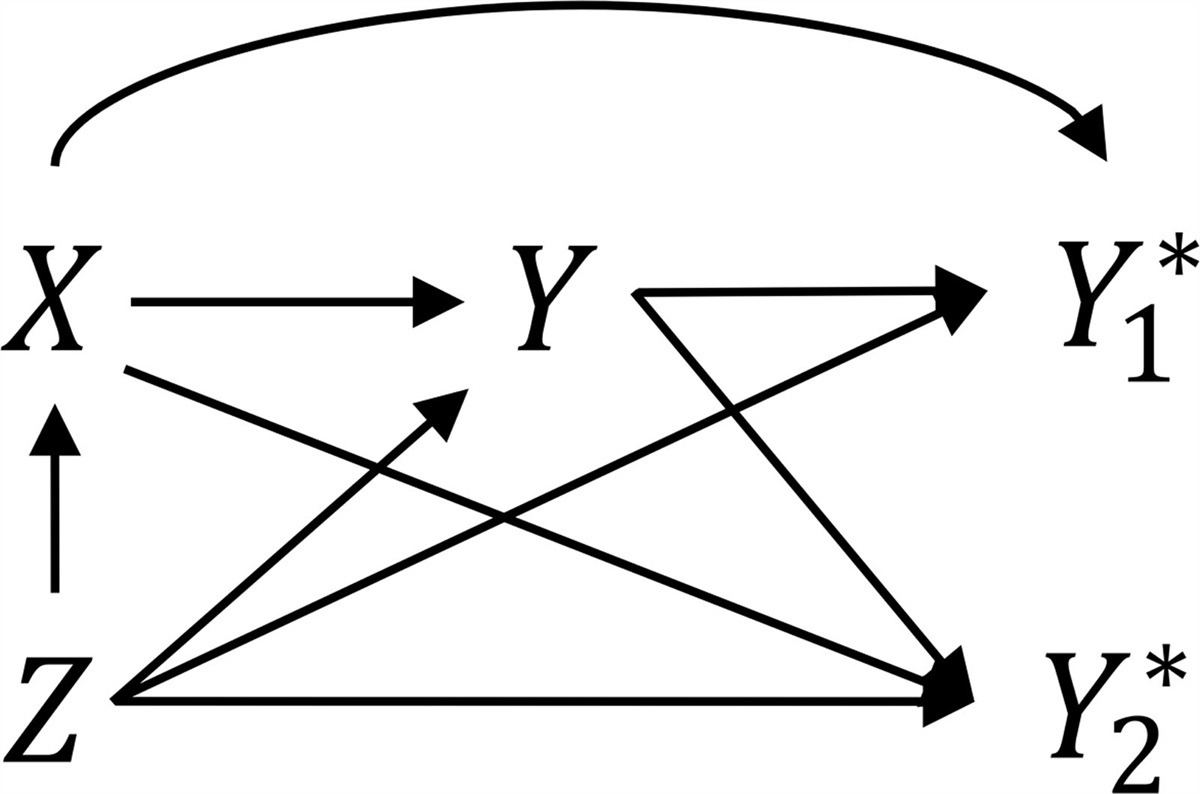
In this issue of Epidemiology, Ross and colleagues1 describe the transportability of bias parameter values from external validation studies, using an applied example estimating the causal effect of maternal HIV infection on the risk of preterm birth in Lusaka, Zambia. Their paper specifically outlines the assumptions required for the transportability of bias parameters from external data for outcome misclassification, though many of the concepts are broadly applicable to other types of quantitative bias analysis. Bias parameter values from external data are unconditionally transportable to the study sample if the misclassification is nondifferential. In the presence of confounding of the exposure–outcome relationship, this assumption further requires that the misclassification must also be nondifferential across strata of the confounding variables. However, when misclassification is differential, transporting misclassification parameters from external validation data is more complicated. If there are nonconfounding covariates, sometimes called predictors of misclassification, whose distribution differs between the study data and validation data, the bias parameter values are not unconditionally (marginally) transportable. To achieve transportability, one must therefore condition on the set of nonconfounding covariates to satisfy a relaxed assumption of conditional exchangeability. Ross et al.1 describe two approaches, conditioning on the set of nonconfounding covariates and an iterated approach that incorporates nonconfounding covariates into the outcome model in the study data.
THE ROLE OF W: NONCONFOUNDING COVARIATESWhen estimating bias parameters for misclassification from any type of external data source, it is important to assess whether there are predictors of misclassification and whether the distribution of these variables differs in the validation data and study data. As an example, Ross et al.1 examined parity (proportion nulliparous) as a predictor of misclassification of outcome status, preterm birth. Note the conceptual difference between a confounder, a common cause of the exposure and outcome, and a predictor of misclassification, a variable that influences the magnitude of misreporting and resulting bias.
IT'S TIME TO THINK ABOUT TIMEIn addition to W, predictors of misclassification, temporal (secular) trends may influence the potential for misclassification of variables of interest. For a self-report variable, social desirability or stigma could influence the accuracy of a self-report variable relative to the true measured version of the same variable. As an example, we might expect the likelihood of an individual accurately reporting their smoking status in the 1960s to be vastly different than in 2023, as our knowledge of the risks of cigarette smoking and social stigma related to smoking have dramatically increased. Also, improvement in measurement tools or laboratory technology may influence our ability to detect “the truth,” and this would affect bias parameter values calculated from validation data. Finally, as others have demonstrated,2,3 prevalence has a well-documented effect on positive and negative predictive values (PPVs and NPVs, respectively) as they are derivative of sensitivity, specificity, and prevalence of the variable of interest. If the prevalence of a variable has changed markedly over time, this could have downstream consequences for predictive values used in quantitative bias analysis. The influence of secular trends has been largely overlooked in the literature on validation studies and estimating bias parameter values.
TYPES OF EXTERNAL VALIDATION DATAWhen thinking about the timing of data collection for a validation study relative to your current study, three types of external validation data exist: (A) data from an external source population collected during the same time period as the study data, (B) data collected from an external source population at a different (usually earlier) time period than the study data, and (C) data collected from the same source population as the study population, but at a different time. If validation data were collected from the same source population at the same time as the study data, this is internal validation data and will not be discussed here further. The manuscript by Ross et al.1 is an example of Type C validation data. The study data were from an electronic health record, the Zambia Electronic Perinatal Record System, from 25 clinics and one hospital in Lusaka, Zambia, collected between 2008 and 2013. The validation data were collected between 2015 and 2020, from two of the clinics in Lusaka, with a gold standard measure of the outcome. There was no overlap in the time from which the study data and validation data were drawn, though both were drawn from the same source population of health clinics in Lusaka.
Data collected from a Type A or B external validation data source may have a different target population than the study data; keep this in mind when applying bias parameter values in quantitative bias analysis to adjust study results. An extreme example would be using routinely collected survey data from a high-income country, like the United States, as an external validation data source for a study being conducted using electronic health records in a lower-income country, such as Zambia. These two data sources have different target populations. If the study is being conducted in the present day (2023) in Zambia, an example of Type A validation data would be data collected in the United States, also in 2023. In the same scenario, with a research study being conducted in Zambia, an example of Type B validation data would be data collected in the United States, 20 years ago, in 2003.
EMPIRICAL EXAMPLE: SELF-REPORT VERSUS MEASURED OBESITYIn this example, we illustrate that when using external validation data, the timing of data collection can affect the validity and transportability of bias parameter values. The estimated bias parameter values from Type B or C validation data (i.e., collected at a different time period), are influenced by changes in the distribution of the misclassified variable(s) and changes in prevalence over time. Also, secular changes in the distribution of predictors of misclassification (W) can affect estimated bias parameter values.
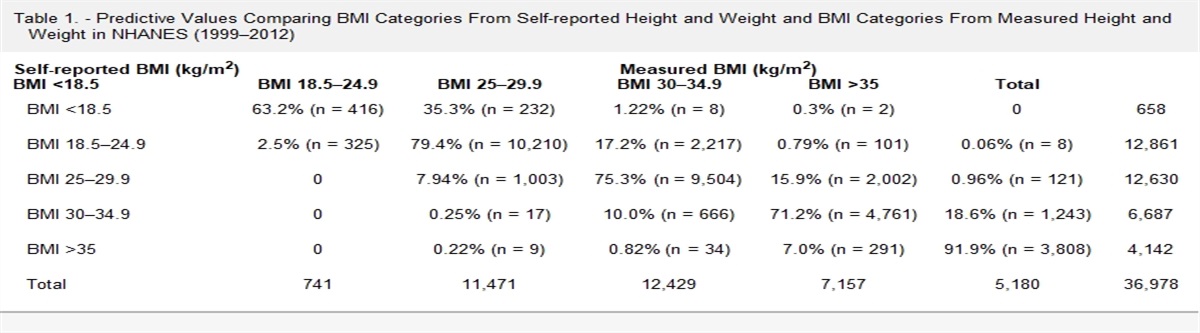
We demonstrate this point empirically, using data from the US National Health and Nutrition Examination Survey (NHANES). This data is publicly available for download on the National Center for Health Statistics website and does not require IRB review. We used data from 1976 to 1980 (NHANES II), 1988 to 1994 (NHANES III), and 1999 to 2018 (continuous NHANES) for this example. NHANES contains data on both self-report and measured height and weight, which can be used to calculate self-report and measured body mass index (BMI). According to guidance from the US Centers for Disease Control and World Health Organization, a BMI greater than or equal to 30 kg/m2 is obese.4,5 We suspect smoking status is a predictor of misclassification of obesity status (i.e., our W variable). On average, individuals who smoke have lower body weight, and smoking is associated with weight loss.6,7
Our results are presented in Figure. The bar graph at the bottom is a comparison of the prevalence (%) of obesity derived from self-reported BMI and measured BMI; the lines at the top represent bias parameter values (sensitivity, specificity, positive predictive value [PPV], NPV). This information is also presented in tabular format in the eAppendix. We observe that starting in NHANES II, the sensitivity for obesity classification was 72% (95% confidence interval [CI] = 69%, 74%), specificity was 99% (95% CI = 99%, 99%), and the true prevalence of obesity was 12% (95% CI = 12%, 13%). In the most recent version of NHANES (2017–2018), we observe that the sensitivity improved to 83% (95% CI = 81%, 84%) but there was little change in specificity (98%, 95% CI = 98%, 99%), as might be expected given that most individuals are more likely to underreport their weight than overreport their weight.8,9 The 11% change in sensitivity between NHANES II and NHANES 2017–2018 indicates that older NHANES data are not a valid source of bias parameter values for a quantitative bias analysis involving recently collected study data. The true prevalence of obesity has increased substantially over the years from 12% (95% CI = 12%, 13%) in NHANES II to nearly 41% (95% CI = 33%, 37%) in NHANES 2017–2018. The increase in the prevalence of obesity impacts measures of PPV and NPV. In Figure and in eTable 1; https://links.lww.com/EDE/C93, we see that PPV has increased from 91% in NHANES II to 97% in the 2017–2018 iteration of NHANES and NPV has decreased over the same time, from 96% to 90%. These results demonstrate the influence of temporal variation on bias parameter values and underscore the importance of time when using Type B or C external validation data.
 FIGURE.:
 Bias Parameters for Misclassification of Obesity Status by NHANES Survey Waves.
Further, we illustrate in the Table that a strong predictor of misclassification may also impact the accuracy of obesity classification over time—using smoking status as an example of a W variable. Similar to obesity, the population prevalence of smoking has changed dramatically over the past 50 years. The prevalence of self-reported current smoking decreased by approximately 20% between NHANES II and the 2017–2018 NHANES survey (63% to 42%), which almost exactly mirrors the increase in obesity prevalence over the same time. Estimates of sensitivity for obesity classification vary by smoking status and across time. On average, sensitivity is lower among nonsmokers than smokers. There is a consistent, nearly linear, increase in sensitivity from NHANES II to 2017–2018. Among smokers, sensitivity was 74% in NHANES II and 87% in the NHANES 2017–2018. Among nonsmokers the sensitivity estimates were 69% in NHANES II and 83% in the 2017–2018 NHANES survey. Specificity estimates across the years are high and relatively constant (97%–99%), regardless of smoking status. The decrease in smoking prevalence over time impacted PPV and NPV estimates within strata of smoking status. We observed increases in PPV and decreases in NPV across strata of smoking; however, among smokers, the PPV estimates are slightly lower and the NPV estimates are slightly higher due to the lower prevalence of obesity among smokers.
TABLE. - Bias Parameter Values (95% CI) for Misclassification of Obesity Status From NHANES, Stratified by Smoking Status Year N1 Sensitivity Specificity PPV NPV Prevalence of Measured Obesity Prevalence of Current Smoking Smokers NHANES II 4,223 0.74 (0.70, 0.78) 0.99 (0.99, 0.99) 0.89 (0.86, 0.92) 0.97 (0.96, 0.97) 0.11 (0.01, 0.12) 0.63 (0.61, 0.64) NHANES III 4,296 0.78 (0.75, 0.81) 0.98 (0.97, 0.98) 0.89 (0.87, 0.91) 0.95 (0.94, 0.96) 0.17 (0.16, 0.19) 0.53 (0.51, 0.55) 1999–2000 881 0.79 (0.73, 0.84) 0.97 (0.96, 0.98) 0.90 (0.85, 0.94) 0.93 (0.91, 0.95) 0.24 (0.20, 0.27) 0.50 (0.47, 0.53) 2001–2002 1,045 0.78 (0.73, 0.83) 0.97 (0.96, 0.98) 0.91 (0.87, 0.94) 0.93 (0.91, 0.94) 0.26 (0.23, 0.29) 0.50 (0.48, 0.53) 2003–2004 1,041 0.85 (0.81, 0.89) 0.97 (0.95, 0.98) 0.92 (0.88, 0.95) 0.94 (0.92, 0.96) 0.29 (0.26, 0.33) 0.50 (0.48, 0.53) 2005–2006 1,003 0.79 (0.74, 0.84) 0.96 (0.95, 0.98) 0.90 (0.86, 0.93) 0.92 (0.90, 0.94) 0.28 (0.25, 0.31) 0.49 (0.47, 0.52) 2007–2008 1,227 0.85 (0.81, 0.88) 0.97 (0.96, 0.98) 0.92 (0.89, 0.95) 0.94 (0.92, 0.95) 0.28 (0.25, 0.31) 0.49 (0.46, 0.51) 2009–2010 1,275 0.87 (0.84, 0.90) 0.95 (0.93, 0.96) 0.88 (0.85, 0.91) 0.94 (0.92, 0.96) 0.30 (0.27, 0.33) 0.46 (0.43, 0.48) 2011–2012 1,034 0.85 (0.81, 0.89) 0.97 (0.95, 0.98) 0.93 (0.90, 0.96) 0.93 (0.91, 0.95) 0.32 (0.28, 0.36) 0.45 (0.42, 0.48) 2013–2014 1,156 0.85 (0.81, 0.88) 0.96 (0.95, 0.97) 0.92 (0.88, 0.94) 0.93 (0.91, 0.94) 0.33 (0.30, 0.37) 0.46 (0.44, 0.49) 2015–2016 1,026 0.83 (0.79, 0.86) 0.97 (0.95, 0.98) 0.94 (0.91, 0.96) 0.91 (0.88, 0.93) 0.38 (0.34, 0.42) 0.43 (0.40, 0.45) 2017–2018 940 0.87 (0.83, 0.90) 0.98 (0.96, 0.99) 0.96 (0.93, 0.98) 0.92 (0.90, 0.94) 0.38 (0.33, 0.42) 0.42 (0.39, 0.45) Nonsmokers NHANES II 2,856 0.69 (0.64, 0.73) 0.99 (0.98, 0.99) 0.91 (0.87, 0.93) 0.94 (0.93, 0.95) 0.15 (0.13, 0.16) – NHANES III 4,103 0.74 (0.72, 0.77) 0.98 (0.97, 0.98) 0.93 (0.91, 0.95) 0.91 (0.90, 0.92) 0.26 (0.24, 0.28) – 1999–2000 1,151 0.79 (0.75, 0.83) 0.96 (0.95, 0.98) 0.92 (0.89, 0.95) 0.90 (0.87, 0.92) 0.34 (0.30, 0.37) – 2001–2002 1,208 0.80 (0.75, 0.84) 0.98 (0.96, 0.99) 0.94 (0.91, 0.97) 0.91 (0.89, 0.93) 0.33 (0.29, 0.36) – 2003–2004 1,245 0.83 (0.79, 0.87) 0.96 (0.95, 0.98) 0.92 (0.89, 0.95) 0.92 (0.90, 0.94) 0.34 (0.31, 0.37) – 2005–2006 1,166 0.83 (0.79, 0.86) 0.97 (0.95, 0.98) 0.94 (0.91, 0.96) 0.91 (0.89, 0.93) 0.37 (0.33, 0.40) – 2007–2008 1,368 0.83 (0.79, 0.86) 0.96 (0.94, 0.97) 0.93 (0.90, 0.95) 0.90 (0.88, 0.92) 0.37 (0.33, 0.40) – 2009–2010 1,435 0.84 (0.80, 0.87) 0.97 (0.96, 0.98) 0.95 (0.93, 0.97) 0.90 (0.87, 0.91) 0.38 (0.35, 0.42) – 2011–2012 1,168 0.84 (0.81, 0.88) 0.97 (0.95, 0.98) 0.94 (0.92, 0.96) 0.91 (0.89, 0.93) 0.37 (0.33, 0.41) – 2013–2014 1,265 0.84 (0.80, 0.87) 0.97 (0.95, 0.98) 0.95 (0.93, 0.97) 0.90 (0.87, 0.92) 0.42 (0.39, 0.46) – 2015–2016 1,232 0.78 (0.75, 0.82) 0.96 (0.95, 0.98) 0.94 (0.92, 0.96) 0.85 (0.82, 0.88) 0.44 (0.40, 0.48) – 2017–2018 1,219 0.83 (0.80, 0.86) 0.99 (0.97, 0.99) 0.98 (0.96, 0.99) 0.87 (0.84, 0.89) 0.48 (0.43, 0.52) –In this empirical example, we illustrate that when researchers use Type B or C validation data, time trends in classification accuracy can influence bias parameters. Time trends may impact the results of quantitative bias analysis, especially when the underlying true prevalence of the misclassified variable has changed substantially. This is an additional consideration required when using external validation data as it impacts the transportability of bias parameters.
PRACTICAL TIPS FOR USING EXTERNAL VALIDATION DATATransportability of estimated bias parameter values depends on predictors of misclassification (i.e., nonconfounding covariates) and temporal differences in reporting accuracy or the true prevalence of the variable of interest. The analytic strategies presented by Ross et al.1 are helpful when using either Type B or Type C validation data and there are known variables that strongly predict the probability of misclassification. In this commentary, we demonstrate the impact of secular trends, and when the validation data were collected relative to the study data, on estimated bias parameter values. Ensuring the validation data accurately represents the time period and target population of the study of interest is essential for transportability. Once bias parameter values have been estimated from the validation data, using probabilistic or Bayesian quantitative bias analysis are formal approaches to incorporate uncertainty around the bias parameter values estimated from an external validation study. We look forward to seeing the continued development of methodologic approaches to account for the influence of secular trends in validation studies and quantitative bias analysis.
ABOUT THE AUTHORSHailey R. Banack is an Assistant Professor in Epidemiology at the University of Toronto. Her research is focused on age-related changes in body composition and obesity, with particular interest in methodological approaches to address bias in epidemiologic research. Christopher D. Kim is a second-year PhD student in Epidemiology at the Dalla Lana School of Public Health at the University of Toronto. Lindsay J. Collin is a postdoctoral fellow at the Huntsman Cancer Institute. She is a molecular and cancer epidemiologist interested in understanding multilevel determinants of adverse outcomes among individuals diagnosed with breast, ovarian, or melanoma cancer. She is also interested in epidemiologic methods, specifically related to validation substudy design and quantitative bias analysis.
REFERENCES 1. Ross RK, Cole SR, Edwards JK, et al. Leveraging external validation data: the challenges of transporting measurement error parameters [published online ahead of print]. Epidemiology. 2023. doi:10.1097/EDE.0000000000001701. 2. Fox MP, Lash TL, Greenland S. A method to automate probabilistic sensitivity analyses of misclassified binary variables. Int J Epidemiol. 2005;34:1370–1376. 3. Greenland S. Basic methods for sensitivity analysis of biases. Int J Epidemiol. 1996;25:1107–1116. 4. World Health Organization. Physical status: the use of and interpretation of anthropometry, Report of a WHO Expert Committee. World Health Organ Tech Rep Ser. 1995;854:1–452. 5. Clinical guidelines on the identification, evaluation, and treatment of overweight and obesity in adults: executive summary. Expert Panel on the Identification, Evaluation, and Treatment of Overweight in Adults. Am J Clin Nutr. 1998;68:899–917. 6. Albanes D, Jones DY, Micozzi MS, Mattson ME. Associations between smoking and body weight in the US population: analysis of NHANES II. Am J Public Health. 1987;77:439–444. 7. Molarius A, Seidell JC, Kuulasmaa K, Dobson AJ, Sans S. Smoking and relative body weight: an international perspective from the WHO MONICA Project. J Epidemiol Community Health. 1997;51:252–260. 8. Jeffery RW. Bias in reported body weight as a function of education, occupation, health and weight concern. Addict Behav. 1996;21:217–222. 9. Hattori A, Sturm R. The obesity epidemic and changes in self-report biases in BMI. Obesity (Silver Spring). 2013;21:856–860.
留言 (0)