
記住我
Mechanical ventilation weaning difficulties are among the common problems in modern ICUs.1
Diaphragm is the main respiratory muscle with prolonged mechanical ventilation which can result in compromised diaphragm function secondary to atrophy and impairment with resulting difficult weaning process.2
Preserved diaphragm function is important to recover spontaneous respiration during the weaning process.2
It can be challenging to decide the optimal timing for extubation from mechanical ventilation and traditional predictor weaning tools are not very accurate.3
Ultrasound has emerged as a less expensive, available, free-of-radiation, bedside tool for evaluating diaphragm movement characteristics such as force, amplitude, contraction velocity, special movement patterns, and changes in diaphragmatic inspiratory thickness.4
Assessment of diaphragmatic thickness and diaphragmatic excursion (DE) by ultrasound in invasively mechanically ventilated patients can predict weaning outcome.1
2 Patients and methodsA case-cohort study includes 90 patients who were invasively mechanically ventilated in the ICU of Fayoum University hospital from July 2018 to July 2019 and our research was ethically approved by Fayoum university ethical committee No. 338 on October 14, 2018. We studied ultrasound assessment of diaphragmatic function as a predictor for weaning from mechanical ventilation.
2.1 Patient's selectionStudied patients were divided into two groups based on their response to weaning studies; successful weaning group who is were able to maintain their own breathing for 48 hours after extubation without any level of ventilator support and failed weaning group which is defined as either failure of the patient to pass spontaneous breathing trials (SBT) or reintubation within 48 hours after extubation.5
2.2 Inclusion criteriaPatients with prolonged mechanically ventilated (>48 hours). All ICU patients who met the criteria to start the weaning process as hemodynamic stability, PaO2 < 60 mm Hg while breathing with an FIO2 ≤ 0.4 (PaO2/FiO2 > 200), Positive end-expiratory pressure (PEEP) ≤ 8 cm H2O, tidal volume (TV) > 5 mL/kg, RSBI < 100 breath/min/L, patients was fully conscious and cooperative, and secretion management, no electrolyte imbalance.
2.3 Exclusion criteriaAge < 18 years, History of neuromuscular diseases, Diaphragmic anatomical malformation of the, Using muscle paralyzing agent during ventilation, Hemodynamic instability, Not fulfilling criteria to start the weaning process.
3 MethodsAll participants gave their informed consent for inclusion before sharing in the study. Every person was submitted to complete history taking, general and chest examination, laboratory and radiological evaluation and ventilator parameters was recorded. Ultrasound evaluating diaphragmatic function at right hemi-diaphragm using ultrasound machine (Philips HD11XE).
Diaphragmatic thickness assessment using B-mode ultrasound in semi-recumbent position, the higher frequency linear probe (9MH) was placed intercostally perpendicular to the chest wall in the 8th or 9th intercostal space between the anterior and mid axillary line. The diaphragm appeared as 3-layered structure (2 parallel echogenic lines which represent the pleura and the peritoneum with central hypoechoic space representing the diaphragmatic muscle). The diaphragmatic thickness was measured from the middle of the pleural line to the middle of the peritoneal line6 as shown in Figure 1. The thickness was measured during end inspiration and end expiration. This was repeated to take the average followed by diaphragmatic thickness fraction (DTF) calculation by this equation ((Thickness at the end inspiration — thickness at the end expiration)/Thickness at the end expiration) × 100.7
 Figure 1: Diaphragmatic ultrasound.6.
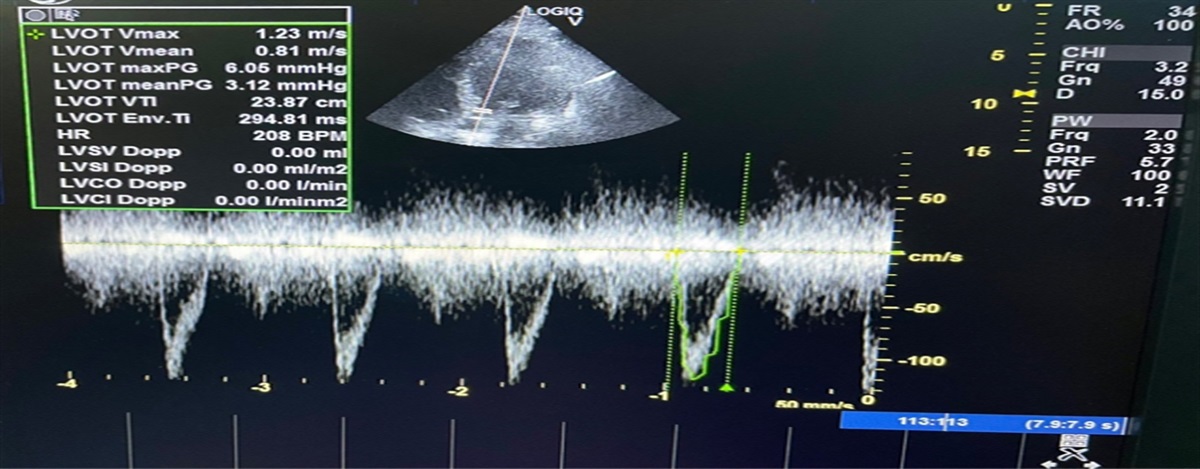
DE assessment by lower frequency curvilinear probe (4MH) is placed subcostally parallel to the intercostal space between mid clavicular and anterior axillary lines, directed medially, cranially and dorsally in order to demonstration of the posterior third of the right diaphragm. Figure 2 demonstrates diaphragmatic movement using M-mode method with the cursor crossing the diaphragm and assess the high and low peak points, the mean DE was calculated in cm after recording the maximal displacements in successive 5 breathing cycles.8
 Figure 2: M mode ultrasound of the diaphragm from an anterior subcostal view for hemi diaphragmatic excursion measurement.8.
The inspiratory time (Tinsp) assessment by placing the cursor on the baseline at the beginning of inspiratory slope and drawing an horizontal line which connects it to the imaginary vertical line that passes through the inspiratory peak; and for expiratory time (Texp), then extending the horizontal line from this point of intersection to baseline at the ending of successive expiratory slope as shown in Figure 3. Cycle duration (Ttot)(Tinsp + Texp).9 Contraction velocity is calculated from the excursion and inspiratory time as follows: Contraction velocity (cm/s) = Diaphragm excursion (cm)/inspiratory time (s).10
 Figure 3: Ultrasonic diaphragmatic motion assessment.11.
Relaxation rate is calculated from the excursion and expiratory time as follows: (Excursion/Trelax (Ttot — Tinsp).
This diaphragmatic ultrasound measures are assessed during first 24 hours of intubation, first 24 hours from starting weaning process and among successful weaning group the same measures are assessed after extubation (within first 48 hours) and before discharge or referral to ward.
3.1 Statistical analysis of dataSPSS (Statistical Package for Social Sciences) version 12.0 was used for data analysis. Mean and standard deviation are descriptive values for quantitative data with median and range for non-normally distributed data. Student t test and non-parametric t test (Mann-Whitney test) was used for comparing means of 2 independent groups and Kruskal-Wallis ANOVA (analysis of variance) for comparing means of more than 2 groups. Paired t test and non-parametric paired t test (Wilcoxon signed rank test) was used for comparing means of 2 dependent groups. Chi-square – Fisher exact test were the tests for proportion independence. P value is significant at.05 levels. The receive operating characteristic (ROC) curve was used to determine the discrimination value of DE, DTF, contraction velocity and relaxation rate for weaning outcome and to define optimal cut-points for sensitivity and specificity. For interpretation of results of tests of significance, significance was adopted at P ≤ .05.
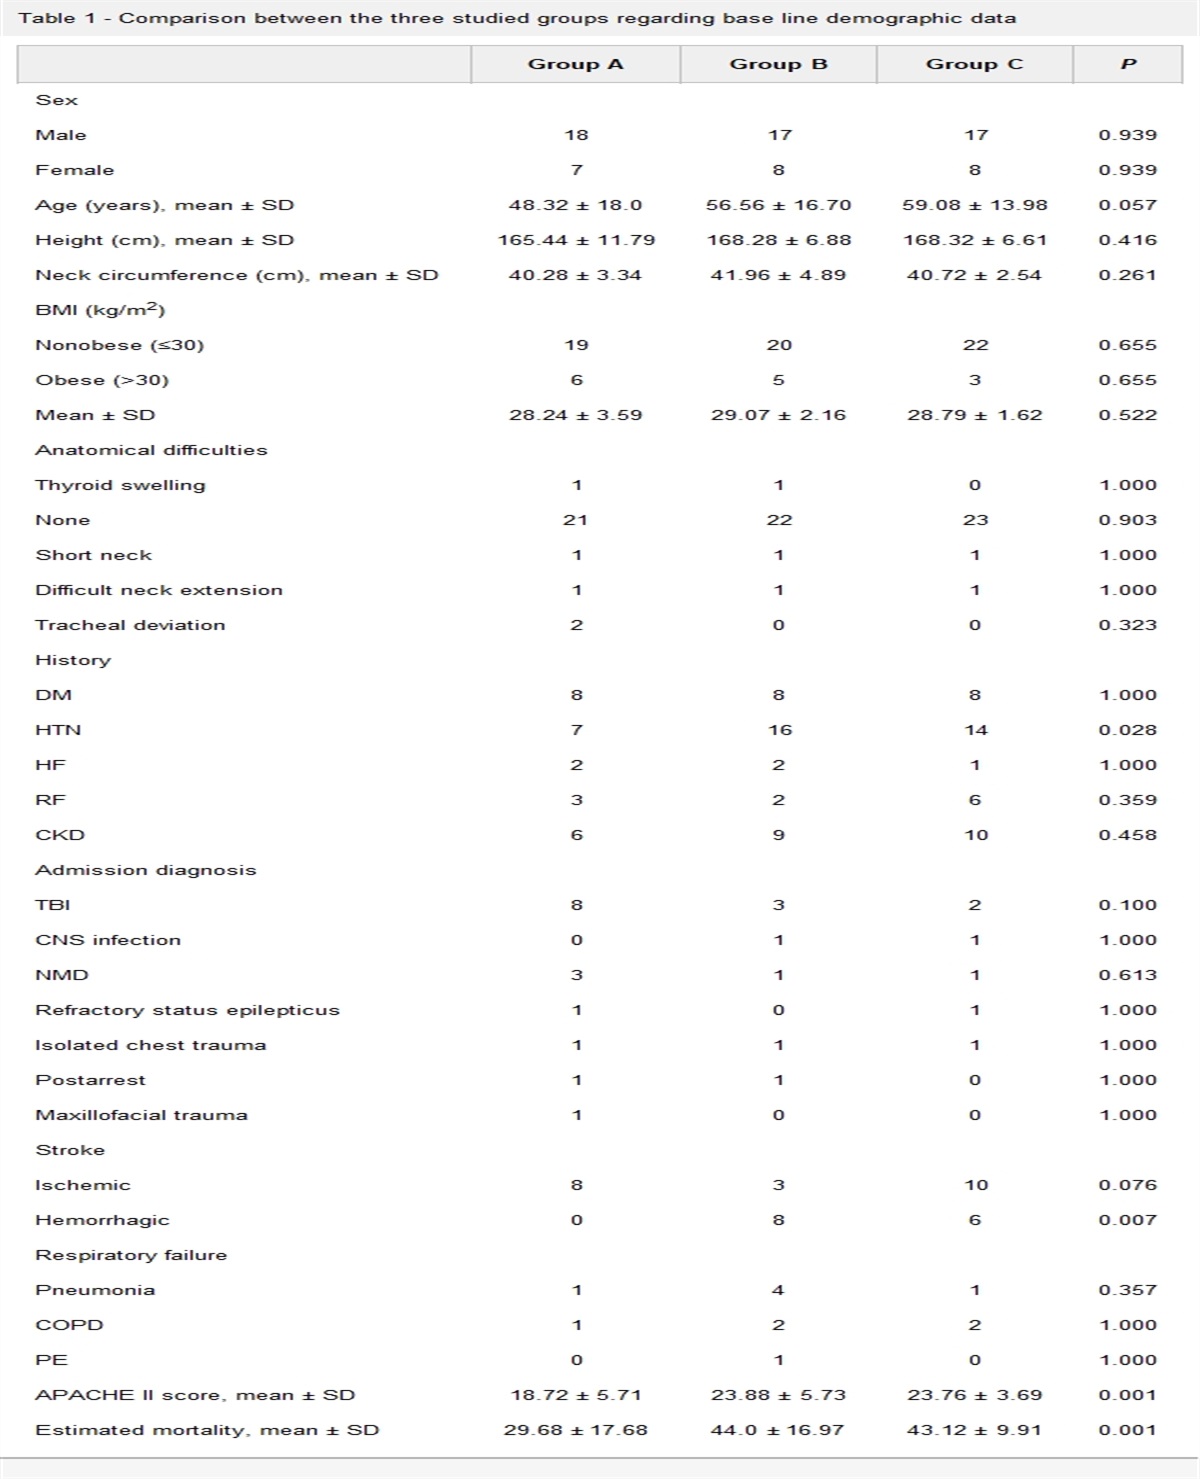
4 Results 4.1 Demographic characteristics of the study populationThe study was conducted over 90 patients, their age range from 18 to 97years old with a mean ± SD of 57.2 ± 19.4. Regarding sex, more than half of studied patients 51/90 (56.7%) were males and 39/90 (43.3%) were females.
The causes of respiratory failure and mechanical ventilation in the study group: 36.7% was due to COPD exacerbation, 26.7% due to pneumonia, 13.3% due to ILD exacerbation, 13.3% due to others as shock, organ failure, and metabolic come and 10% due to CNS causes as cerebrovascular stroke and convulsion (Fig. 4).
 Figure 4:
 Causes of respiratory failure and mechanical ventilation in the study group.
Patients are classified in our study as regarding weaning outcome into successful weaning group which represent 51/90 (56.6%) and failed weaning group which represent 39/90 (43.3%) (Fig. 5).
 Figure 5:
 Classification of patients in our study as regarding weaning outcome.
As regarding diaphragmatic ultrasound measures there was a statistically significant difference in DE between patients with successful weaning and those with failed weaning during weaning trial. Patients with DE mean value above 1.27 ± 0.5 cm showed successful weaning while patients with value below 0.7 ± 0.3 cm showed failed weaning (P value.003) (Fig. 6).
 Figure 6:
 The relation between DE in successful weaning and in failed weaning group during weaning trial. DE, diaphragmatic excursion.
Among patients with successful weaning, DE increased significantly with repeated measures as the mean DE is 0.9 ± 0.5 cm during first 24 hours of ventilation, 1.3 ± 0.5 cm during weaning trial, 1.5 ± 0.7 cm after extubation and 1.5 ± 0.9 cm before discharge (P < .0001) (Fig. 7).
 Figure 7:
 The relation between DE measures among successful weaning group during first 24 h. DE, diaphragmatic excursion.
As regarding DTF there was a statistically significant difference between patients with successful weaning and those with failed weaning during weaning trial. Patients with DTF mean value above 19.2 ± 7.2% showed successful weaning while those with DTF mean value below 10 ± 3.8% showed failed weaning (P < .0001) (Fig. 8).
 Figure 8:
 The relation between DTF in successful weaning and in failed weaning group during weaning trial. DTF, diaphragmatic thickening fraction.
In this study among patients with successful weaning, DTF increased significantly with repeated measures as the mean DTF is 11.7 ± 4.8% during first 24 hours of intubation, 19.2 ± 7.2% during weaning trial, 20.6 ± 7.3% after extubation and 22.6 ± 8.5% before discharge (P < .0001) (Fig. 9).
 Figure 9:
 The relation between DTF measures among successful weaning group during first 24 h of intubation, weaning trial, after extubation, and before discharge. DTF, diaphragmatic thickening fraction.
But there was no statistically significant difference in total cycle duration and inspiration duration during weaning trial with P-value.202 and.526 respectively within successful weaning group and failed weaning group (Table 1).
Table 1 - The relation between total cycle duration and inspiration duration in successful weaning and failed weaning group during weaning trial During weaning trial Variable Outcome Mean SD Total cycle duration Successful weaning 2.5 0.3 Failed weaning 2.3 0.6 P .202 Inspiration duration Successful weaning 0.9 0.2 Failed weaning 0.8 0.3 P .526As regarding contraction velocity there was a statistically significant difference as patients with contraction velocity mean value during waning trial above 1.5 ± 0.7 cm/s showed successful weaning while patients with contraction velocity mean value below 1 ± 0.6 cm/s show failed weaning (P value.039) (Fig. 10).
 Figure 10:
 The relation between contraction velocity in successful weaning and in failed weaning group during weaning trial.
Among patients with successful weaning, contraction velocity changed significantly between repeated measures as the mean value is 1 ± 0.7 cm/s during first 24 hours of intubation, 1.5 ± 0.7 cm/s during weaning trial, 1.6 ± 0.7 cm/s after extubation and 1.3 ± 0.7 cm/s before discharge with P < .004 (Fig. 11).
 Figure 11:
 The relation between contraction velocity measures among successful weaning group during first 24 h of intubation, during weaning trial, after extubation, and before discharge.
Regarding relaxation rate there were a statistically significant difference between patients with successful weaning (value above 0.8 ± 0.3 cm/s) and those with failed weaning (value below 0.5 ± 0.2 cm/s) during weaning trial (P value.012) (Fig. 12).
 Figure 12:
 The relation between relaxation rate in successful weaning and in failed weaning group during weaning trial.
Among patients with successful weaning, relaxation rate changed significantly between repeated measures as the mean value is 0.4 ± 0.3 s/s during first 24 hours of intubation, 0.8 ± 0.3 cm/s during weaning trial, 1.1 ± 0.4 cm/s after extubation and 0.9 ± 0.5 cm/s before discharge with P < .0001 (Fig. 13).
 Figure 13:
 The relation between relaxation rate measures among successful weaning group during first 24 h of intubation, during weaning trial, after extubation, and before discharge.
Among failed weaning group there was a statistically significant difference in DTF, total cycle duration and relaxation rate between first 24 hours of intubation and during weaning trial measures. There is no statistically significant difference between DE, contraction velocity and inspiration duration as shown in Table 2.
Table 2 - The relation between first 24 h of intubation and during weaning trial measures as regards DE, DTF, total cycle duration, inspiration duration, contraction velocity and relaxation rate among failed weaning group During first 24 h of intubation During weaning trial Variable Outcome Mean SD Mean SD P DE Failed weaning 0.7 0.2 0.7 0.3 .690 Total cycle duration Failed weaning 3.2 0.4 2.3 0.6 .002 Inspiration duration Failed weaning 1 0.3 0.8 0.3 .078 Contraction velocity Failed weaning 0.7 0.3 1 0.6 .142 Relaxation rate Failed weaning 0.3 0.1 0.5 0.2 .020 DTF Failed weaning 16.8 7.5 10 3.8 .010DE, diaphragmatic excursion; DTF, diaphragmatic thickening fraction; SD, standard deviation.
Table 3 illustrates that the cut off values during weaning trials for diaphragmatic measures were 1.3 cm (P value.004) for DE with 61.1% sensitivity and 100% specificity. The area under curve (AUC) was 0.813. 13.5% was the cut off value during weaning trials for DTF with P < .0001, 83.3% sensitivity, and 91.7% specificity. The AUC was 0.894 (Fig. 14).
Table 3 - The relation between DE, DTF, contraction velocity and relaxation rate during weaning trial Variables AUC P Cut-off point Sensitivity (%) Specificity (%) DE 0.813 .004 1.3 61.1 100 Contraction velocity 0.745 .025 0.95 77.8 66.7 Relaxation rate 0.750 .022 0.70 66.7 91.7 DTF 0.894 <.0001 13.5 83.3 91.7AUC, area under curve; DE, diaphragmatic excursion; DTF, diaphragmatic thickening fraction.
 Figure 14:
 ROC curves in predicting successful weaning. ROC, receiver operating characteristic.
As regarding Contraction velocity 0.95 cm/s was the cut off value during weaning trials with P value.025, 77.8% sensitivity, and 66.7% specificity. The AUC was 0.745. 0.7 cm/s was the cut off value during weaning trials for relaxation rate with P value 0.022, 66.7% sensitivity, and 91.7% specificity. The AUC was 0.75 (Fig. 14).
5 DiscussionWeaning from mechanical ventilation act as one of the most challenges in critical care unit.12,13
Twenty percent of the patients inside the ICU show difficulties in weaning process, while 40% of them spent much time in ICU during weaning trials.2
In the present study, we aimed to assess whether the degree of diaphragm thickening expressed as thickening fraction, diaphragmatic motion which is expressed as diaphragm excursion and the speed of diaphragmatic contraction and relaxation rate can be used to predict successful weaning using ultrasound as a mode of diaphragm evaluation.
The DE, DTF, contraction velocity and relaxation rate were collected for each group and correlated with weaning outcome groups.
Ninety patients who were invasively mechanically ventilated for more than are 48 hours were included in the study. Patient age ranged from 18 to 97years old with a mean of 57.2 ± 19.4year. Regarding sex, more than half of studied patients (56.7%) were males and (43.3%) were females They were divided into 2 groups according to their response to weaning trials; successful weaning and failed weaning group.
Patients were on assisted control mode from the start of ventilation and shifted to PS mode during weaning.
In this study 56.6% of patients show successful weaning while 43.3% show failed weaning. Controversy to Osman A and Hashim R et al.,2 Saeed et al.14 and Baess et al.1 who showed failure rate about 25%, 26.7%, and 23.3%, respectively. Farghaly et al.15 was 30%, Spadaro et al.16 was 34% and increases in Nassar et al.,17 Ferrari et al.18 and Huang et al.19 to be 54.2%, 63%, and 70%, respectively. This difference is due to non-uniform rule in study population selection with different causes for mechanical ventilation as well as different ventilation periods before starting weaning process and different weaning time which may affect the outcome of the weaning process.
The evaluation of the DTF reflects diaphragm contractile activity and its effect on lung volume change Ferrari et al.18
This study show that patients with DTF mean value during waning trial above 19.2 ± 7.2% showed successful weaning while patients with DTF mean value during weaning trial below 10 ± 3.8% showed failed weaning (P < .0001). In the same context with Farghaly et al.,15 Ferrari et al.,18 Osman A and Hashim R et al.,2 and Ali ER and Mohamed AM et al.4 stated that DTF was higher in the successful extubation group compared to the failed one.
In the current study, the cut off point value for weaning from mechanical ventilation was 13.5% with P < .0001, 83.3% sensitivity, and 91.7% specificity.
This result was less than previous studies that showed variable DTF cut off points starting from ≥30% reported by DiNino et al.20 who investigate DTF with Sensitivity of 88%, specificity of 71%. Furthermore, Farghaly et al.,15 who evaluated DE and DTF was found that DTF ≥34.2% with sensitivity of 90%, specificity of 64.3%. Additionally, DTF was >36% by Ferrari et al.18 who evaluated the DTF asa predictive index of weaning with Sensitivity of 82%, specificity of 88%. However, Hu S et al.21 and Umbrello et al.22 has lesser cut off values as DTF was >24% and 20% respectively, with sensitivity of 76% and specificity of 79%.
DTF reflects diaphragm strength and muscle shortening during contraction, so differences in DTF cut off values may be due to differences in the time of assessment as we assess the diaphragm within first 24 hours of weaning rather than other studies which assess diaphragm within 12–36 hours before extubation, also difference in Pressure support level will decrease DTF as with increased level of PS (high PS > 12 cm H2O) will lead to over assistance and the only role of the diaphragm will be just triggering the ventilator then relaxed and became inactive again resulting in.22 Also, different patient population and different durations on MV will affect recovery of the muscle contractile activity leading to decrease in muscle mass and change in its thickness with contraction. Other explanation was the variability of diaphragmatic thickness which depends on body weight, muscular power and the degree of diaphragm muscle atrophy Farghaly et al.15
Among patients with successful weaning DTF increase significantly between repeated measures as the mean DTF is 11.7 ± 4.8% during first 24 hours of intubation, 19.2 ± 7.2% during weaning (increases by 46% when switch from VAC to PS), 20.6% ± 7.3% after extubation and 22.6 ± 8.5% before discharge (P < .0001). This is in concordant with Ali ER and Mohamed AM et al.4 which shows that patients on PSV showed significant increase in DTF by switching from CMV to PS by 34% (31.3 ± 25 to 42.2 ± 33.21) and remains stationary till after extubation.
DE correlated well with transdiaphragmatic pressure and is considered one of the more valuable traditional volume based weaning parameters.23
This study shows that patients with DE mean value during weaning trial above 1.27 ± 0.5 cm showed successful weaning while patients with DE mean value during weaning trial below 0.7 ± 0.3 cm showed failed weaning (P value 0.003).
The cut off value 1.3 cm (P value 0.004) with 61.1% sensitivity and 100% specificity. Our result were in concordant with Carrie et al.,24 Farghaly et al.,15 Palkar et al.10 and Nassar et al.17 who stated that mean values of DE taken during SBT were higher in patients who succeeded weaning attempt when compared to patients with failed waning.
Variable cut-off points were reported in different studies as >1 cm by Kim et al.,25 Osman A and Hashim R et al.2 and Palkar et al.10 with sensitivity of 60%, 83.3%, and 30% respectively and specificity of 76%, 100%, and 92.5% respectively for predicting extubation. Also, DE was < 1.1 cm in Hu S et al.21 and Spadaro et al.16 with sensitivity of 92% and specificity of 100%. The same result was by Saeed et al.14 with sensitivity of 86.4% and specificity of 87.5%. It was higher in Nassar et al.17 who found that DE was <1.4 cm. Furthermore, DE was >1.5 cm by Farghaly et al.15 and Ali ER and Mohamed AM et al.4 with sensitivity of 87.5% and 88.7%, specificity of 71.2%and 84.3%, respectively. Up to >2.5 cm by Lerolle et al.26 who measure DE post-cardiac surgery to predict weaning.
Regarding timing of measurements; our measurements were taken during first 24 hours of weaning unlike studies by Ali ER and Mohamed AM et al.,4 Nassar et al.17 and Kim et al.25 where it was taken before extubation, while the study by Osman A and Hashim R et al.2 the measurements were taken after extubation. Regarding patient position, in our study the patients were kept in semi recumbent position as in Farghaly et al.15 and Lerolle et al.,26 while in supine position with the head of the bed at 0 degree as studies by Ali ER and Mohamed AM et al.,4 Nassar et al.17 and Kim et al..25 Houston et al.27 compared DE measurements during supine and seated position for the same patient and it was found that the average value of DE on supine position allowed greater mobility of the diaphragm while on sitting position allowed lesser mobility of the diaphragm. Regarding study population our study population were medical ICU patients as studies by Ali ER and Mohamed AM et al.,4 Nassar et al.,17 Farghaly et al.,15 Hu S et al.,21 Spadaro et al.16 and Kim et al.,25 while in Lerolle et al.,26 the study group patients were on post-CABG population. The higher values in the study may be due to that there patient's population are more susceptible to develop lung atelectasis and the higher risk for injury of phrenic nerve that leads to diaphragm dysfunction.
Among patients with successful weaning, DE differed statistically significantly between repeated measures as the mean DE is 0.9 cm ± 0.5 cm during first 24 hours of intubation, 1.3 ± 0.5 cm during weaning trial (DE increases by 44% when switch from VAC to PS), 1.5 ± 0.7 cm after extubation and 1.5 cm ± 0.9 cm before discharge (P < .0001). This is in concordant with Ali ER and Mohamed AM et al.,4 which show that patients on PSV showed significant increase in DE among successful group by switching from CMV to PS by <100% (0.9 ± 3.27 to 1.9 ± 4.83) and remains stationary till after extubation.
About contraction velocity which represents the speed of diaphragm contraction, there was a statistically significant difference between patients with successful weaning and those with failed weaning during weaning trial (P value 0.039). Patients with contraction velocity mean value during waning above 1.5 ± 0.7 cm/sec showed successful weaning while patients with contraction velocity mean value during weaning trial below 1 ± 0.6 cm/s show failed weaning. 0.95 cm/s was the cut off value with P value 0.025, 77.8% sensitivity, and 66.7% specificity. It differed statistically significantly between repeated measures as the mean value is 1 ± 0.7 cm/s during first 24 hours of intubation, 1.5 ± 0.7 cm/s during weaning trial, 1.6 ± 0.7 cm/s after extubation and 1.3 ± 0.7 cm/s before discharge with
留言 (0)