
記住我
Intensive care unit (ICU) patients at high risk of morbidity, mortality, and prolonged care need implementing practical approaches to improve outcomes during the early phase of critical illness.1
When energy and protein are delivered to critically ill patients, recovery potentially improved. Despite the potential benefits of nutrition therapy, feeding is usually stopped intermittently in 85% of critically ill patients because of essential procedures and symptoms of food intolerance. These feed stops cause patients to meet only 40%–60% of their energy and protein requirements, rather than allowing optimal delivery and meeting the minimum 80% of energy and protein requirements recommended by clinical practice guidelines.2–4
Most ICUs worldwide use an hourly “rate-based” feeding approach, but evidence suggests changing from a rate-based to volume-based feeding to mitigate accrued feed deficits without increasing feed intolerance in medical and some surgical ICU patients.5–7
Controversial views are expressed regarding the amount of proteins to be given during the early phase of critical illness, when muscle protein breakdown outweighs muscle synthesis because of the resistance to anabolic stimuli.8
The proportion of nitrogen losses to be compensated by protein intake in the critically ill patients is a matter of debate, as reflected by recommendations cited in the most published guidelines (1.2–2.5 g/kg of protein per day), and the provision of an amount of protein lower than nitrogen losses, in agreement with the “baby stomach” concept.9,10
Whey is a rich source of leucine and branched-chain amino acids. The peak activation of muscle protein synthesis is proportional to the leucine content of the meal, whereas both casein and whey contain all the amino acids required to effectively stimulate muscle protein synthesis; whey has a considerably higher leucine concentration and has been demonstrated to have a greater postprandial muscle protein synthesis.11
1.1. Aim of the workIn this study, we aimed to compare the effect of higher protein intake (1.5 g/kg/day) in previously malnourished patients with standard one (1 g/kg/day) in ICU settings using whey protein during the early phase of the patients' critical illness and its impact on laboratory and clinical outcomes.
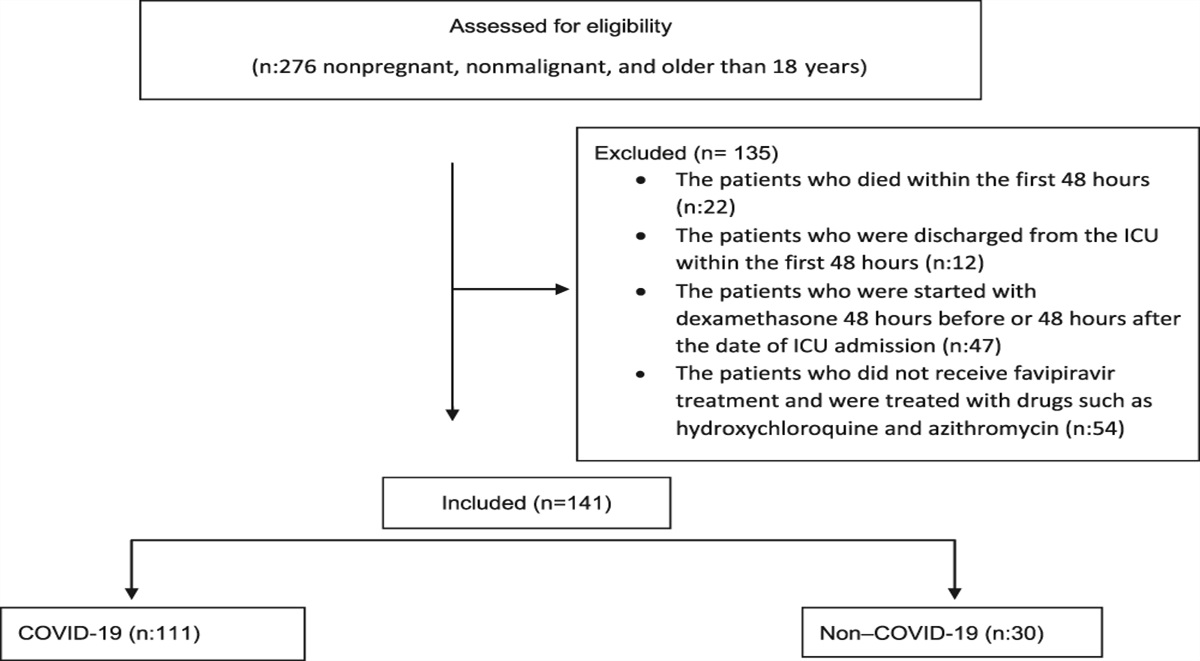
2. Patients and methodsThis prospective interventional nonrandomized control study was conducted on forty patients; all patients were admitted to critical care department, Cairo University, intubated and mechanically ventilated for at least 3 days. This study was conducted between August 2020 and March 2021.
All patients (or his closest relative) provided consent and were fully informed of the procedure before being involved in this study. This study was approved by the local ethics committee (MS 29-2020) and was registered on ClinicalTrials.gov (NCT04977440).
2.1. Inclusion criteria Older than 18 years Mechanically ventilated patients (for 3 days or more) 2.2. Exclusion criteria Contraindication for enteral nutrition (gut ischemia, obstruction, or perforation) Expected intolerance for enteral nutrition (paralytic ileus) Inability to start enteral nutrition within 24 hours (ie, surgery or other interventions) Short bowel syndrome Hemodynamic instability (ie, shock state, need for vasopressors) Child C liver cirrhosis or acute liver failure Dialysis dependency 2.3. Study designAfter selection of the patients according to the inclusion and exclusion criteria, all patients were subjected to the following:
Detailed medical history. Anthropometric measures: body mass index (BMI), midupper arm circumference, midupper arm muscle circumference, and triceps skinfold thickness.12,13 Clinical severity indices were calculated for all patients: APACHE II score (Acute Physiology and Chronic Health Evaluation II score14) SOFA score (Sequential Organ Failure Assessment score15,16) Routine laboratory tests: daily with emphasis on serum electrolytes and blood sugar levels. Resting energy expenditure (REE) was calculated for all patients according to the patient's actual body weight as follows:REE (Kcal/day) = 25 × actual body weight (kg)
Enteral feeding: Enteral feeding was started within 24 hours of mechanical ventilation (MV). Patients were divided after 3 days of MV into two groups according to the previous nutritional status using the Nutrition Risk in Critically ill (NUTRIC) score: Group (I): enteral feeding with high protein intake (1.5 g/kg/day) in 20 patients with NUTRIC score more than 5. Group (II): enteral feeding with normal protein intake (1.0 g ptn/kg/day) in 20 patients with NUTRIC score less than 5.The NUTRIC score is the first nutritional risk assessment tool developed and validated specifically for ICU patients. The recognition that not all ICU patients will respond the same to nutritional interventions was the main concept behind the NUTRIC score because most of the other risk scores and assessment tools consider all critically ill patients to be at high nutrition risk.
In our study, we excluded interleukin-6 from the scoring system because of unavailability.17
The protein supplement that was used is whey protein gold standard. Every 1 serving contains 24 g protein, 1 g fat, and 3 g of carbs with total 120 Kcal. Every 1 serving was added to 200 cc water, shacked well, and given through the nasogastric tube after checking for residual gastric volume. The patient's nonprotein-caloric intake was calculated according to REE: (25 × actual body weight in kg) and the following are the findings:18,19 ✓ 1/2 the calculated amount of caloric intake on day 1 ✓ 3/4 of the calculated amount of caloric intake on day 2 ✓ Full calculated caloric amount on day 3 This regimen was followed long because the patient was tolerating the amount of feeding, and in case of intolerance: ✓ The volume of feeding boluses was decreased or ✓ The time interval between boluses was increased or ✓ IV metoclopramide or oral erythromycin was given Water intake20,21 ✓ Water intake was calculated for all patients as follows (30 mL/kg/day): ✓ Increased water intake is required if the patient has fever, burns, tachypnea, surgical drains, polyuria, or ongoing significant gastrointestinal losses. ✓ Daily insensible water loss of average 500 mL was considered. Gastric residual volume was checked every 4 hours for detection of feed intolerance, and gastric prokinetics could be used. Random blood sugar was checked every 6 hours to avoid hyperglycemia or hypoglycemia. Follow-upAll patients were followed up for food intolerance, BMI, midupper arm muscle circumference, triceps skinfold thickness, weaning from ventilator, length of ICU stay, and 30-day mortality with a follow-up of serum electrolytes and random blood sugar.
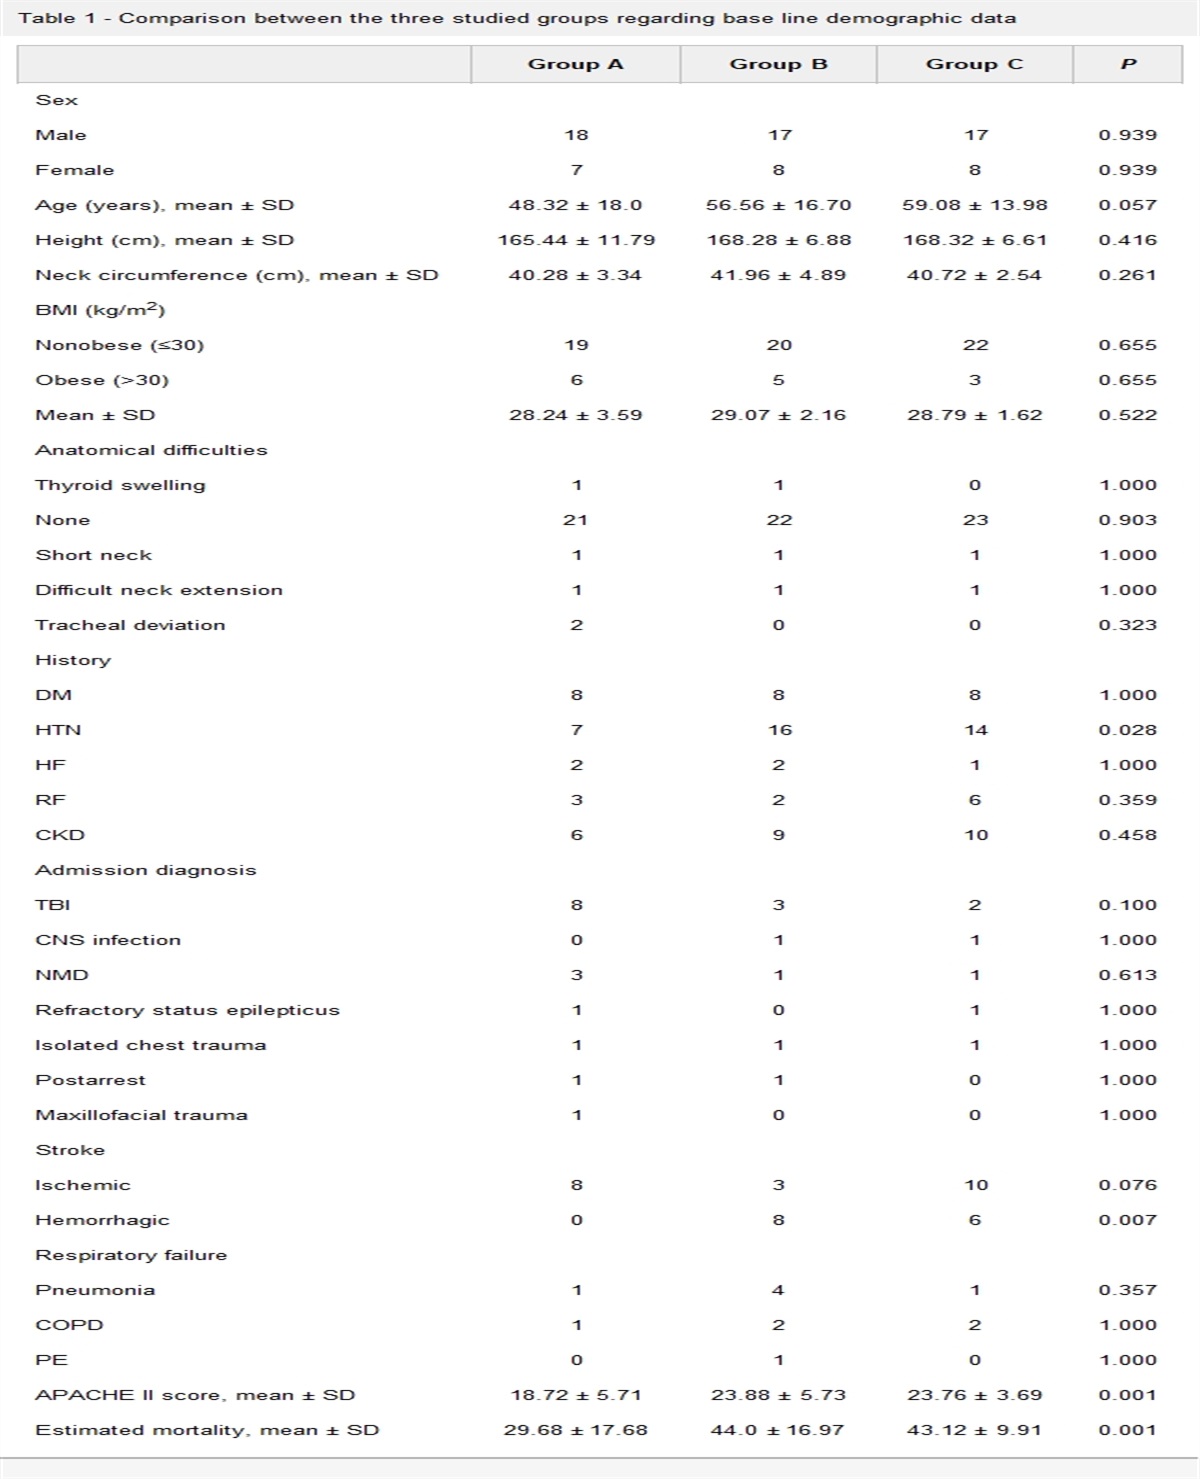
2.4. Statistical analysisData were coded and entered using the Statistical Package for the Social Sciences (SPSS) version 26 (IBM Corp, Armonk, NY). Data were summarized using mean, standard deviation, median, and minimum and maximum quantitative data using frequency (count) and relative frequency (percentage) for categorical data. Comparisons between groups were performed using the unpaired (t) test in normally distributed quantitative variables while the nonparametric Mann-Whitney test was used for non-normally distributed quantitative variables.22 For comparing categorical data, the chi-square test was performed. The exact test was used instead when the expected frequency is less than 5.23P-values less than .05 were considered statistically significant (Tables 1 and 2).
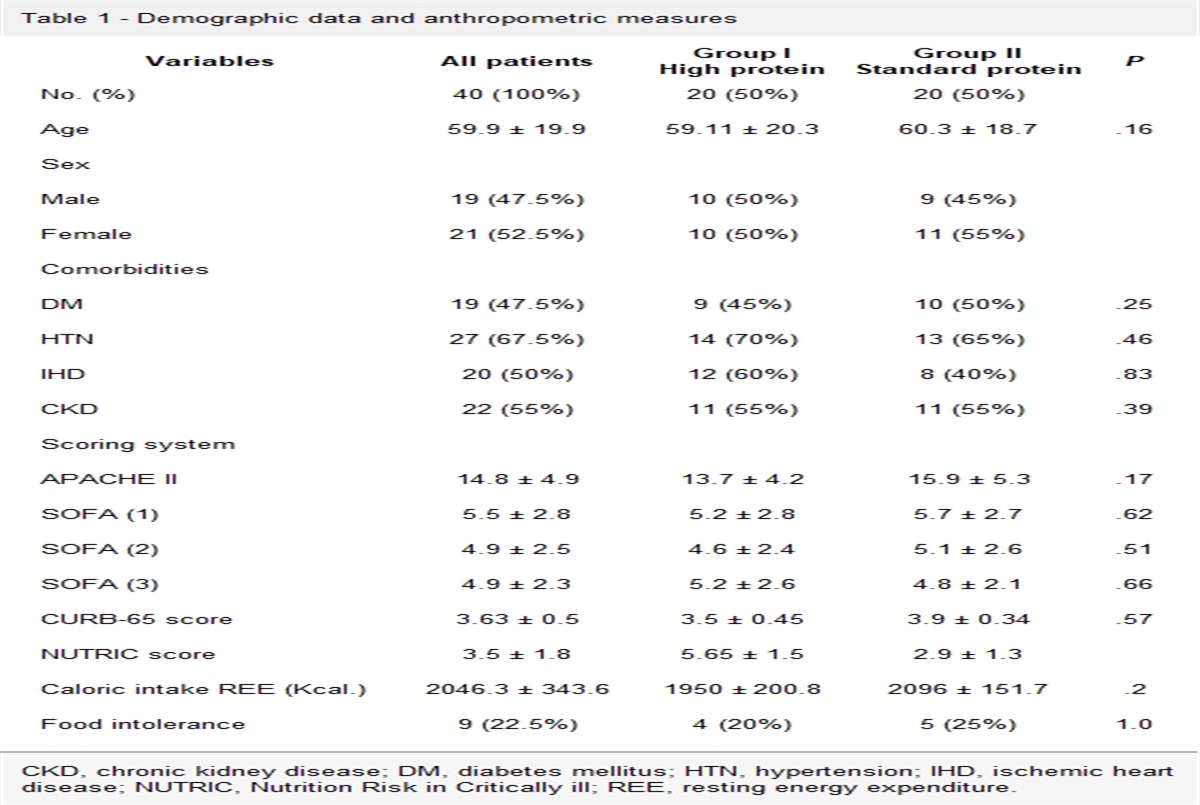
Table 1 - Demographic data and anthropometric measures Variables All patients Group ICKD, chronic kidney disease; DM, diabetes mellitus; HTN, hypertension; IHD, ischemic heart disease; NUTRIC, Nutrition Risk in Critically ill; REE, resting energy expenditure.
BMI, body mass index; MUAC, midupper arm circumference; MUAMC, midupper arm muscle circumference.
The mean value for serum electrolytes during the first 7 days of admission was calculated, and the results are shown in Table 3.
Table 3 - Serum electrolytes of both groups Group IHigh protein intake showed the following:
1. Significant lower serum Na level at day 7 (P = .042) 2. Significant lower serum K level at day 1 (P = .036) 3. Significant higher serum Ca level at days 3–7 (P = .001) 4. Significant lower serum P level at day 5 (P = .041) 5. Significant lower serum Mg level at day 3 (P = .018)The high protein diet does not affect total proteins and albumin levels, as shown in Table 4.
Table 4 - Total proteins and albumin and urea levels Protein intake 1 g/kg/day Protein intake 1.5 g/kg/day Mean SD Median Range Mean SD Median Range P Urea (D1) 72.00 52.56 49.00 24.00 252.00 55.10 18.88 49.00 30.00 94.00 .799 Albumin (D1) 3.14 0.88 3.05 1.70 4.50 3.26 0.71 3.25 2.20 4.50 .678 Total protein (D1) 5.24 0.80 5.40 3.40 6.40 5.07 11.19 5.00 4.00 55.00 .565 Urea (D2) 63.05 50.30 47.50 18.00 248.00 54.90 21.42 45.00 35.00 100.00 .862 Albumin (D2) 3.01 0.97 3.10 1.50 4.50 3.39 0.65 3.50 2.40 4.50 .253 Total protein (D2) 5.25 0.76 5.40 3.50 6.00 5.25 0.71 5.40 4.00 6.70 .758 Urea (D3) 64.53 52.61 47.00 4.50 248.00 53.25 18.54 47.50 35.00 104.00 .968 Albumin (D3) 3.01 0.90 3.00 1.50 4.50 3.49 0.88 3.50 1.90 5.00 .121 Total protein (D3) 5.03 0.75 5.10 3.50 6.00 5.33 0.81 5.50 4.00 6.50 .221High protein intake led to a significant reduction in blood sugar level during first 2 days of ICU stay (P-values = .035 and .048, respectively) but no significant reduction in BMI (P = .47) between day 1 and day 7 (Tables 5–7).
Table 5 - Blood sugar levels of both groups All patients Group I
留言 (0)