
記住我
Mechanical ventilation prolongation increases intensive care unit (ICU) stay, cost, and associated with increased morbidity and mortality. Tracheostomy facilitates earlier ventilator weaning, reduce sedation requirements, work of breathing thus decreases incidence of ventilator-acquired pneumonia, duration of ICU/hospital length of stay, and mortality.1 Tracheostomy procedure has evolved over the years; recently, the majority are now inserted by the intensivists in the ICU.2 The emergence of percutaneous tracheostomy has increased the number of tracheostomies performed and encouraged their use earlier in the course of ICU stay as it has advantages over surgical tracheostomies such as quicker time to perform and decreased risk of procedural complications, additionally better resource utilization, and reduction of hospital costs.1
Percutaneous dilational tracheostomy (PDT) is usually performed under real-time fiberoptic bronchoscopy guidance to allow needle insertion into the trachea while protecting the posterior tracheal wall from damage and to verify cannula location and enhance safety.3 Bronchoscopy guidance was the established standard and the initially recommended method for PDT. However, it may be accompanied with some complications including accidental loss of the airway, needle damage to the optical fiber, and a shortage of devices and operators, which made many specialists reluctant to perform it with bronchoscopy.4 In addition, with bronchoscopy, it is difficult to identify the cervical anatomical structures and it does not prevent potential complications, such as vascular lesions or thyroid punctures.5,7
The use of ultrasound during PDT has increased recently. Ultrasound is considered a simple procedure with high portability, safety, and reliability that has several advantages, such as identification of the thyroid gland and vascular structures in the neck, determination of the correct tracheal puncture position, and guidance of the needle inside the trachea. In addition, ultrasound can determine the distance between the skin and the anterior tracheal wall.3 Ultrasound-guided PDT has shown to improve efficacy and reduce complications compared with other percutaneous tracheostomy techniques, especially the landmark-guided method.4
Complications of tracheostomy placement are infrequent but can be life threatening, especially during the procedure or during the first 24–48 hours.6,8 The validation of the safety and efficacy of tracheostomy procedure techniques and approach still requires further evaluation.
1.1. Research quality and ethical statementThis study was approved by the Institutional Review Board/Ethical Committee at Cairo University. The authors followed the applicable EQUATOR network (http://www.equator-network.org/) guidelines, specifically the STROBE Guidelines, during the conduct of this research project.
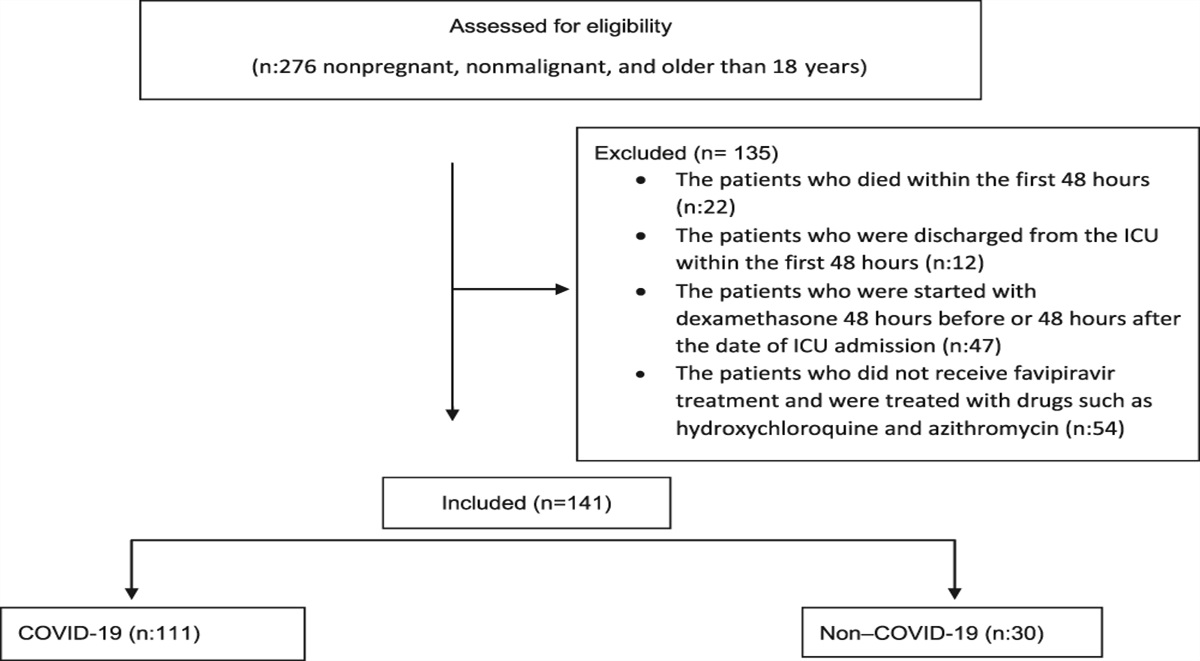
2. Patients and MethodsOur study was a prospective observational study enrolling 75 critically ill ventilated patients admitted to the ICU, Damanhour Medical National Institute, Egypt. Requiring elective tracheostomy to facilitate weaning from the ventilator. Patients were enrolled sequentially into 3 groups (25 patients each) to undergo tracheostomy procedure by one of the following techniques: ultrasound-guided percutaneous dilational (group A), fiberoptic bronchoscopic-guided percutaneous dilational (group B), or blind percuatneous dilational procedure (group C).
All patients or next of kin signed informed consent before enrollment. All study population enrolled in our study were selected based on the following criteria.
2.1. Inclusion criteriaPatients older than 18 years admitted to the Critical Care Unit, with the diagnosis of respiratory or airway compromise requiring intubation and mechanical ventilation, scheduled for elective tracheostomy procedure for one of the following indications.
Prolonged ventilatory support defined by translaryngeal endotracheal intubation for more than 14 days. Expected prolonged mechanical respiratory support (early tracheostomy scheduled before 12 days of translarygeal endotracheal intubation). Difficulty to wean from mechanical ventilation (between 12 and 21 days, with multiple failed attempts of weaning and extubation). 2.2. Exclusion criteria Younger than 18 years. Pregnancy. Active cutaneous infection over proposed tracheostomy site. Distorted neck anatomy with unidentifiable anatomical landmarks, scar of prior neck surgery, presence of hematoma, and radiation exposure. Uncontrolled bleeding disorder. Tracheal stenosis. Surgical emphysema. Applied high positive end expiratory pressure >15 cm H2O. Recent myocardial infarction. Asthma exacerbation.All study populations were subjected to full medical history and clinical examination to identify patient demographics and comorbidities, full laboratory evaluation, and APACHE II score calculation. Cause of ICU admission, indication for endotracheal intubation, number of days on mechanical ventilation before tracheostomy, and indication for tracheostomy procedure.
Patients were enrolled consecutively into one of the three groups (25 patients each) based on the technique used to perform percutaneous tracheostomy procedure: group A: ultrasound-guided percutaneous dilational tracheostomy, group B: fiberoptic bronchoscopy-guided percutaneous dilational tracheostomy, and group C: blind (anatomical) percutaneous dilational tracheostomy.
After complete fulfillment of standard preprocedural preparations and requirements, aseptic approach, necessary staff, appropriate monitoring ICU tools, and adequate oxygenation, patients were scheduled to undergo PDT using Ciaglia Blue Rhino G2 Advanced Percutaneous Tracheostomy Introducer Set (C-PTIS-100-HC, Blue Rhino, COOK MEDICAL LLC, Bloomington, IN) by one of the following techniques.
2.3. Percutaneous dilational tracheostomyPercutaneous tracheotomy technique was performed by using Ciaglia Blue Rhino® G2 Advanced Percutaneous Tracheostomy Introducer Set (C-PTIS-100-HC Blue Rhino, COOK) with the insertion of a suitable-sized tracheotomy tube. The set consisted of a puncture needle, a guide wire, a small dilator, the special Blue Rhino dilator, and three curved stylets for placement of the tracheostomy tube. The endotracheal tube was repositioned above the site of the proposed tracheostomy, then the endotracheal tube cuff was slightly deflated, and it was withdrawn or pulled back so that it lies at the level of the cricoid cartilage or just below the vocal cords by the assistant or the designated anesthetist; then, the endotracheal tube (ETT) cuff was reinflated again. Blood pressure, cardiac rhythm, arterial oxygen saturation, and end tidal CO2 were continuously monitored throughout the procedure.
The cricoid cartilage was palpated, and a 1-cm transverse incision was made through the skin and superficial subcutaneous fascia between the first and second or second and third tracheal rings or midway between the thyroid cartilage and sternal notch or 1.5 or 2 fingerbreadths from the sterna notch. The trachea was punctured with a 15-gauge cannula-on-needle in a posterio-caudal direction, and tracheal entry of the needle or cannulation was confirmed by the aspiration of air into the saline-filled syringe.
After successful placement of the tracheal cannula, a “J” tip guide wire was passed through the cannula into the tracheal lumen; the cannula was then withdrawn, leaving the guide wire in situ. A well-lubricated initial 14Fr dilator was passed over the guide wire into the trachea to start stoma formation and was later removed.
A guiding catheter (a white plastic sheath) was advanced over the guide wire until the safety ridge of the guiding catheter lay inside the tracheal lumen. Over the guide wire and guiding catheter, the Ciaglia Blue Rhino was passed to the appropriate skin marking, resulting in tracheal dilatation.
Finally, the tracheostomy tube was loaded over an appropriate and well-lubricated introducer and inserted through the tracheal stoma. The introducer, the guide wire, and the guiding catheter were then removed, leaving the tracheostomy tube in situ.
2.4. Ultrasound-guided percutaneous dilational tracheostomyBefore PDT, ultrasound (Toshiba 35A-590A, Canon Medical Service, Chicago, IL) linear probe 7.5 MHz was used to perform longitudinal sections to locate the cricoid cartilage, the tracheal rings, and the puncture site. Then, they performed transversal sections to identify arteries, veins, thyroidgl, and trachea and endotracheal tube. Then, they visualize the needle in an “out-of-plane” mode (that is, the needle path was determined by the presence of a distinct acoustic shadow ahead of the needle) on a transversal section of the neck region.
2.5. Fiberoptic bronchoscopy-guided percutaneous dilational tracheostomyETT and tracheal suctioning were performed thoroughly with the help of the flexible fiberoptic bronchoscope (Pentax Ltd, UK). The choice of site of intended skin incision and then tracheal puncture was helped by the appearance of endoscopic indentation of the anterior tracheal wall on gentle pressure by the finger of the operator and by transillumination. ETT withdrawal was performed under the visual control of the bronchoscope. All steps were performed by the visual control of the bronchoscope, thus avoiding any structural injury. The bronchoscope was removed from the ETT and inserted into the tracheostomy tube to confirm proper positioning.
All study populations were followed up during the PTD procedure up to 28 days. Aiming to evaluate all three techniques and compare the number of tracheal needle punctures, duration of the procedures, incidence of perioperative complications (pneumothorax, surgical emphysema, cardiopulmonary arrest, hypoxemia, hypercarbia, bradycardia, and bleeding), incidence of early complications in the first week after placement (tracheostomy tube obstruction or displacement, aspiration, and hemorrhage), incidence of late complications occurring later than 1 week from tracheostomy tube placement (local inflammatory changes, tracheomalacia, tracheoesophageal fistula, and subglottic stenosis).
Patients were also assessed for the feasibility of mechanical ventilation weaning, possibility of decannulation of tracheostomy, and 28-day mortality.
2.6. Statistical analysisThe results were tabulated and statistically analyzed by using a personal computer using MICROSOFT EXCEL 2016 and SPSS v. 21 (SPSS Inc, Chicago, IL). Statistical analysis was performed using descriptive, for example, percentage (%), mean, and standard deviation, and analytical that includes Fisher' exact test, chi-squared, one-way analysis of variance, and Kruskal-Wallis test. A value of P less than 0.05 was considered statistically significant.
3. Results 3.1. Baseline group characteristicsOur study showed that there was no statistically significant difference between the three groups regarding age, sex, height, weight, body mass index (BMI), neck circumference, or anatomical difficulties (thyroid swelling, short neck, difficult neck extension, and tracheal deviation). In addition, all 3 groups were similar regarding admission diagnosis and cause of respiratory failure (P > 0.05) as shown in Table 1.
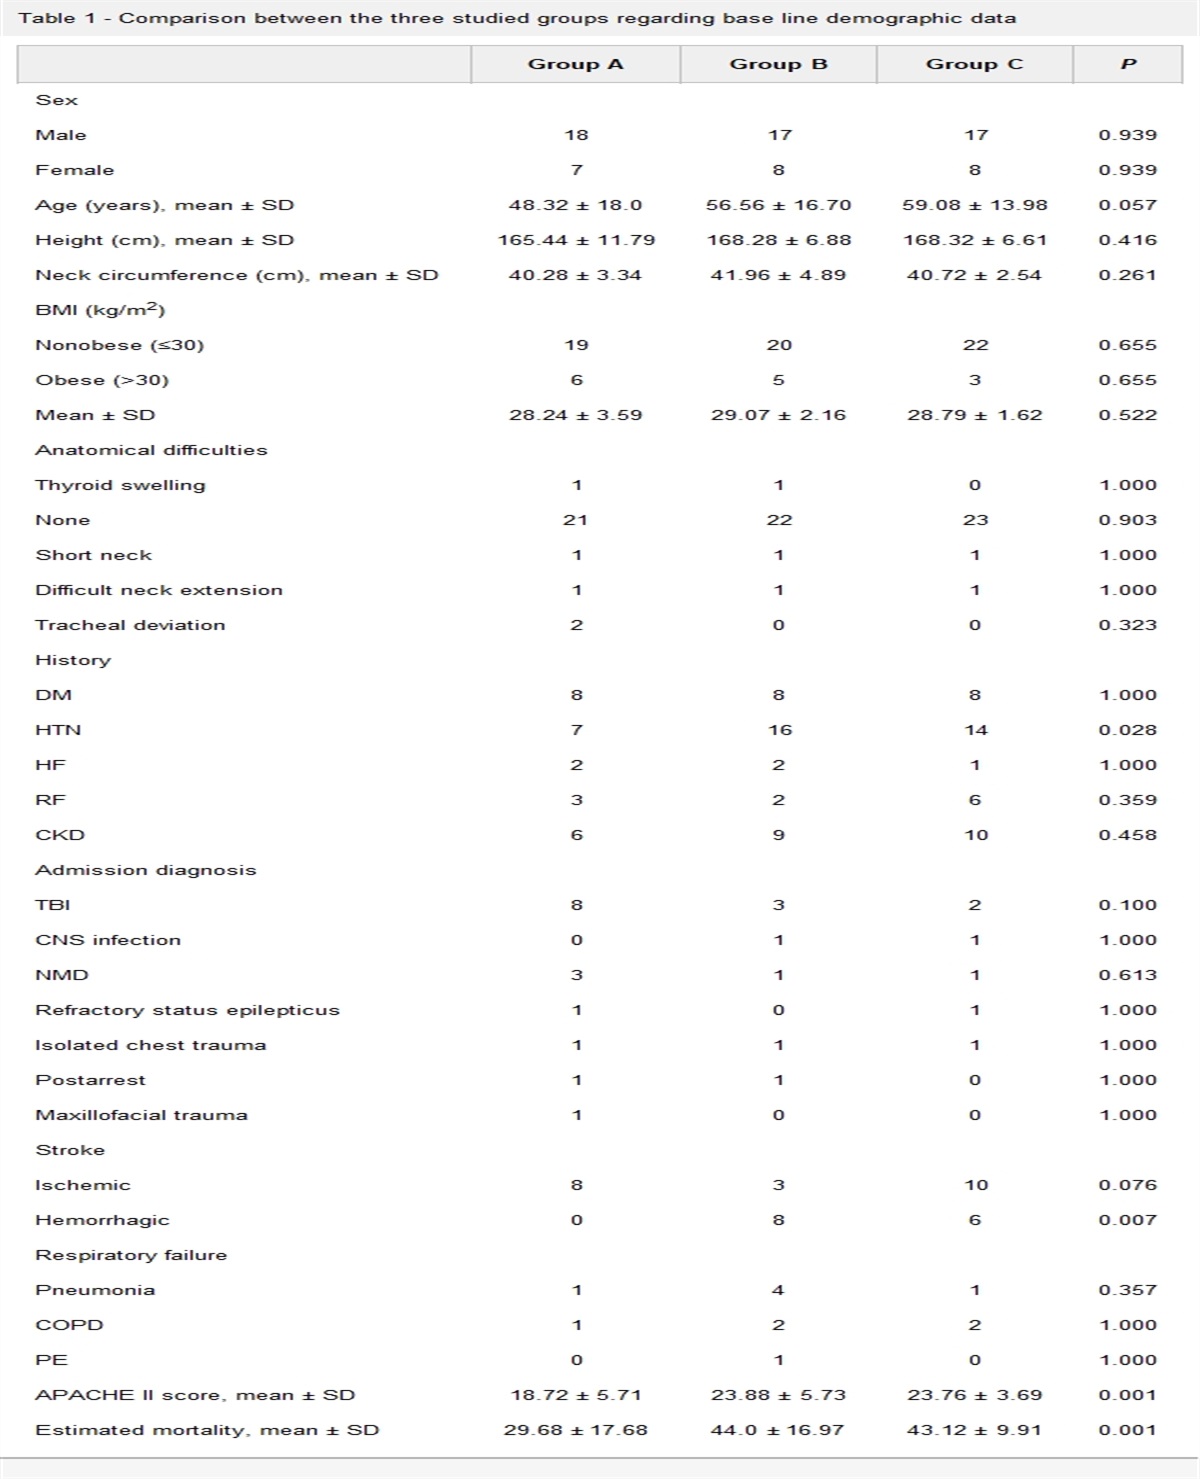
Table 1 - Comparison between the three studied groups regarding base line demographic data Group A Group B Group C P Sex Male 18 17 17 0.939 Female 7 8 8 0.939 Age (years), mean ± SD 48.32 ± 18.0 56.56 ± 16.70 59.08 ± 13.98 0.057 Height (cm), mean ± SD 165.44 ± 11.79 168.28 ± 6.88 168.32 ± 6.61 0.416 Neck circumference (cm), mean ± SD 40.28 ± 3.34 41.96 ± 4.89 40.72 ± 2.54 0.261 BMI (kg/m2) Nonobese (≤30) 19 20 22 0.655 Obese (>30) 6 5 3 0.655 Mean ± SD 28.24 ± 3.59 29.07 ± 2.16 28.79 ± 1.62 0.522 Anatomical difficulties Thyroid swelling 1 1 0 1.000 None 21 22 23 0.903 Short neck 1 1 1 1.000 Difficult neck extension 1 1 1 1.000 Tracheal deviation 2 0 0 0.323 History DM 8 8 8 1.000 HTN 7 16 14 0.028 HF 2 2 1 1.000 RF 3 2 6 0.359 CKD 6 9 10 0.458 Admission diagnosis TBI 8 3 2 0.100 CNS infection 0 1 1 1.000 NMD 3 1 1 0.613 Refractory status epilepticus 1 0 1 1.000 Isolated chest trauma 1 1 1 1.000 Postarrest 1 1 0 1.000 Maxillofacial trauma 1 0 0 1.000 Stroke Ischemic 8 3 10 0.076 Hemorrhagic 0 8 6 0.007 Respiratory failure Pneumonia 1 4 1 0.357 COPD 1 2 2 1.000 PE 0 1 0 1.000 APACHE II score, mean ± SD 18.72 ± 5.71 23.88 ± 5.73 23.76 ± 3.69 0.001 Estimated mortality, mean ± SD 29.68 ± 17.68 44.0 ± 16.97 43.12 ± 9.91 0.001Incidence of hypertension as a comorbidity and hemorrhagic stroke was significantly higher in group B compared with groups A and C (P = 0.028, 0.007).
Although group A had significantly lower APACHE II score compared with groups B and C. This may be due to sequential enrollment of patients in each group (18.72 ± 5.71, vs 23.88 ± 5.73, 23.76 ± 3.69, respectively, P = 0.001), yet this did not have any impact on the evaluation of periprocedural complications as all enrolled patients were indicated for scheduled tracheostomy procedure.
All 3 groups were similar regarding indications for endotracheal intubation, indication for tracheostomy, and duration of mechanical ventilation before tracheostomy (P > 0.05) (Table 2).
Table 2 - Comparison between the three studied groups regarding the indication of ETT and tracheostomy as well as mechanical ventilation days before tracheostomy Group A Group B Group C P Indication of ETT Respiratory failure 4 4 1 0.377 Airway protection 21 21 24 0.377 Indication of tracheostomy Weaning failure 4 4 1 0.377 Airway protection 21 21 24 0.377 Mechanical ventilation before tracheostomy, mean ± SD 7.92 ± 2.29 7.68 ± 2.15 8.52 ± 2.97 0.723Our study showed that all 3 groups were similar regarding mean heart rate and mean arterial blood pressure before, during, after 10 minutes, and after 20 minutes of initiating tracheostomy procedure, P > 0.05 (Tables 3 and 4).
Table 3 - Comparison between the three studied groups regarding mean heart rate in the perioperative periods Mean HR Group A Group B Group C P Before, mean ± SD 97.88 ± 4.46 96.68 ± 4.14 97.12 ± 5.53 0.666 During, mean ± SD 101.96 ± 5.0 103.0 ± 6.22 102.0 ± 6.24 0.777 After 10 minutes, mean ± SD 100.56 ± 5.01 103.0 ± 6.87 100.68 ± 5.89 0.272 After 20 minutes, mean ± SD 99.52 ± 5.12 99.16 ± 5.85 99.24 ± 5.64 0.971 After 30 minutes, mean ± SD 98.16 ± 4.27 98.08 ± 5.42 97.72 ± 4.81 0.943We found all 3 groups to be similar in measured oxygen saturation and PaO2 prior, during, and after initiation of the tracheostomy procedure (Tables 5 and 6).
Table 5 - Comparison between the three studied groups regarding measured oxygen saturation in the perioperative period Oxygen Saturation Group A Group B Group C P Before, mean ± SD 99.40 ± 0.71 99.04 ± 0.89 99.32 ± 0.85 0.314 During, mean ± SD 98.44 ± 0.87 97.80 ± 0.82 98.08 ± 1.0 0.035 After 10 minutes, Mean ± SD 98.36 ± 0.57 98.04 ± 0.84 98.24 ± 0.72 0.393 After 20 minutes, mean ± SD 98.69 ± 0.63 98.20 ± 0.91 98.28 ± 0.89 0.089 After 30 minutes, mean ± SD 99.24 ± 0.66 98.56 ± 1.12 99.16 ± 0.80 0.049As regards to measured end-tidal CO2, our study showed that bronchoscopy-guided group (group B) was associated with a significantly higher ETCO2 during and 10 minutes after initiating tracheostomy procedure compared with groups A and C (44.2 ± 5.57, vs 39.72 ± 4.93, vs 40.32 ± 3.79, P < 0.001, 41.12 ± 4.5, vs 38.88 ± 3.91, vs 41.2 ± 3.24, P = 0.001, respectively) (Table 7).
Table 7 - Comparison between the three studied groups regarding end-tidal CO2 in the perioperative periods End-tidal CO2 Group A Group B Group C P Before, mean ± SD 37.72 ± 5.07 37.60 ± 4.83 36.68 ± 3.73 0.857 During, mean ± SD 39.72 ± 4.93 44.20 ± 5.57 40.32 ± 3.79 <0.001 Sig. bet. groups P1 < 0.001, P2 = 0.120 P3 = 0.016 After 10 minutes, mean ± SD 38.88 ± 3.91 41.12 ± 4.50 41.20 ± 3.24 0.001 Sig. bet. groups P1 = 0.013 P2 < 0.001 P3 = 0.303 After 20 minutes, mean ± SD 38.76 ± 3.51 39.36 ± 3.40 38.24 ± 2.47 0.334 After 30 minutes, mean ± SD 38.44 ± 3.50 38.36 ± 3.64 36.0 ± 2.14 <0.001 Sig. bet. groups P1 = 0.845 P2 < 0.001 P3 < 0.001In addition, the measured PCO2 was significantly higher in bronchoscopy-guided group B compared with groups A and C during tracheostomy procedure (47.44 ± 5.1 mmHg, vs 43.2 ± 4.74 mmHg, vs 43.84 ± 3.44 mmHg, P = 0.001) (Table 8).
Table 8 - Comparison between the three studied groups regarding measured PaCO2 in the perioperative period PaCO2 Group A Group B Group C P Before, mean ± SD 41.20 ± 4.90 40.88 ± 4.45 40.20 ± 3.28 0.712 During, mean ± SD 43.20 ± 4.74 47.44 ± 5.10 43.84 ± 3.44 0.001 Sig. bet. groups P1<0.001 P2=0.264 P3=0.0.14 After, mean ± SD 41.04 ± 3.58 42.28 ± 3.53 41.20 ± 2.78 0.271Our study showed that ultrasound-guided PDT was associated with significantly higher successful tracheal puncture in the first attempt compared with the other two groups (24 successful punctures in the first attempt, 96% in group A, vs 21, 84% in group B, vs 14, 56% in group C, P = 0.006) (Table 9).
Table 9 - Comparison between the three studied groups regarding operative data Number of punctures Group A Group B Group C P 1 24 21 14 0.006 2 1 4 6 0.006 3 0 0 4 0.006 ≥3 0 0 1 0.006 Duration of procedure Insertion time, mean ± SD 3.86± 0.61 4.68±1.08 6.75±1.47 <0.001 Sig. bet. groups P1 = 0.031 P2 < 0.001 P3 < 0.001 Total time, mean ± SD 5.77 ± 0.89 8.28 ± 1.04 7.76 ± 1.49 <0.001 Sig. bet. groups P1 < 0.001 P2 < 0.001 P3 = 0.105Comparing the time required to access the trachea between the groups, our study showed that group A (ultrasound-guided PDT) was statistically significantly faster than both groups B and C (3.84 ± 0.61, vs 4.68 ± 1.08, vs 6.75 ± 1.47 minutes, respectively, P < 0.001).
Comparing total procedure time, group A was associated with a significantly shorter total procedure time compared with groups B and C (5.77 ± 0.89, vs 8.28 ± 1.04 vs 7.76 ± 1.49 minutes, respectively, P < 0.001), whereas group B had a longer total time compared with group C (Table 9).
3.3. Postprocedural 28-day outcome evaluation of 3 groups 3.3.1. Time required for mechanical ventilation weaningUltrasound-guided group A was associated with a significantly shorter duration of mechanical ventilation weaning post-tracheostomy compared with groups B and C (55 ± 30.11 vs 62.62 ± 38.59, vs 66.96 ± 23.53 hours, P = 0.006) (Table 10); this finding may also be attributed to the lower APACHE II score of group A compared with the other groups, yet the effect of APACHE II score on procedural complications and technique was out of the scope of our study.
Table 10 - Comparison between the three studied groups according to tracheostomy time to liberation from MV (hours) and decannulation (days) Group A Group B Group C P (n = 24) (n= 25) (n= 25) Time between tracheostomy and liberation from MV (hours), mean ± SD 55.54 ± 30.11 62.62 ± 38.59 66.96 ±
留言 (0)