
記住我
Coronary artery disease (CAD) is the leading cause of morbidity and mortality in most industrialized countries throughout the world. Obesity or excess amount of body fat is one of the risk factors for coronary heart disease.1 Patients with body mass index ≥30 kg/m2 are known to be obese. Pericardial fat includes both epicardial (located within the pericardium) and paracardial fat (located superficial to the pericardium).2 Recently, interest has been focused on the imaging of epicardial adipose tissue (EAT) and pericardial adipose tissue (PAT) as a proxy measure of visceral adiposity.3 Pericardial fat may play a central role in the pathogenesis of cardiovascular disease, mediated by its inflammatory properties.4–6 EAT can easily be measured using transthoracic 2D echocardiography. However, it is not the optimal modality for quantification of EAT because differentiating between epicardial and pericardial fat may be difficult.1,7
Recent studies demonstrated that 64-slice multidetector computed tomography (MDCT) is suitable for volumetric quantization of pericardial fat,8,9 which may add a prognostic value to cardiac coronary CT examination with a potential improvement of its cost-effectiveness.10 MDCT can also demonstrate the coronary calcium score and obstructive versus nonobstructive coronary plaques.11 MRI allows an accurate but more expensive and cumbersome measurement of EAT.7,9 Yet, MRI has limitations in spatial resolution in the through-plane dimension, as well as its limitation in assessment of coronaries compared with multidetector CT.12
1.1. Aim of the StudyThe objective of this study was detection of the predictive and/or diagnostic value of pericardial fat values of pericardial fat volume (PFV) for identification of patients with CAD using coronary CT angiography and its relation with coronary artery calcium score and other comorbidities of CAD.
2. Materials and MethodsThis was a cross-sectional study conducted in Radiology Department, Faculty of Medicine, Cairo University, between December 2020 and June 2021, and it included 58 patients with a clinical suspicion of CAD. The age range of the patients was from 38 to 70 years with a mean age of 52.7 ± 9.3 years.
2.1. Inclusion CriteriaPatients with suspected CAD complaining of dyspnea on exertion, fatigue on mild effort, and typical chest pain were included.
2.2. Exclusion CriteriaPatients allergic to contrast, patients with renal impairment, pregnant women, patients previously diagnosed with CAD, and patients with uncontrolled irregular heartbeat were excluded.
All patients were subjected to the following:
Full history: Relevant medical history was asked for before the procedure: symptoms (such as chest pain and dyspnea); risk factors (history of cigarette smoking, systemic hypertension, dyslipidemia, obesity [BMI ≥30], family history of CAD, and diabetes mellitus); history of allergies (e.g., iodinated contrast material and medications); and history of asthma, renal disease, or multiple myeloma and revision of previous laboratory and cardiac investigations: kidney functions, lipid profile, echocardiography, stress test, and electrocardiogram. Preparation of the patient ⁃Ensure fasting for 4–6 hours before the examination, reassurance of the patients, and check the heart rate of the patient. A stable, beta blocker or diltiazem or verapamil may be used if tachycardia is present. Sometimes mild oral sedation, such as diazepam (5 mg), may be used in anxious patients, and antihistamines may be used. ⁃ECG must be recorded simultaneously throughout the duration of the scanning. Scanning (protocol and parameters): Once an adequate heart rate is achieved, the acquisition starts using Toshiba Aquilion 64-slice CT scanner (Toshiba Company, Otawara, Japan). Postprocessing was performed on Vitrea workstation (Toshiba, Otawara, Japan) or GE workstation (GE, Santa Barbara, CA) connecting by PACS system. Scanogram is a planar x-ray mode, which is used to select the region of interest. Calcium score: A noncontrast ECG prospective triggering scan with 3-mm slice thickness and 3-mm interval was performed to determine the calcium score. CT coronary angiography: ⁃Contrast material injection: A bolus of nonionic contrast (Ultravist 370 Schering, Berlin, Germany or Scanlux 370 sanochemia Pharmazeutika AG, Vienna, Austria) was injected in a dose (V) adapted to individual body weight (W) through 18-gauge cannula with a flow rate of 5–6 ml/sec using a programmed dual head power injector pump, followed by 50 ml of saline. ⁃The acquisition protocol was performed using semiautomated determination of the starting time using the Bolus tracing technique, and a series of axial images at the descending aorta (at the level of the carina) is acquired with an interval of 1 second between subsequent images. Analysis: For evaluation, received axial images are, therefore, routinely transferred to dedicated workstations (Toshiba Vitrea workstation and GE). These workstations permit interactive scrolling through the data set, interactive rendering of oblique multiplanar reconstructions and maximum intensity projections, and three-dimensional (3D) volume rendering. Analysis started with quantification of the coronary artery calcium (CAC) using noncontrast scan. Coronary artery calcium was quantified by the method originally described by Agatston but adapted for low tube current multislice CT. On the basis of the Agatston score, each patient was then placed into 1 of 5 CAC categories that stratifies the risk of subsequent cardiac event occurring (Greenland et al., 2018), as presented in Table 1. Measurement of pericardial fat volume: As the distribution of EAT is asymmetric and mostly localized in the perivascular atrioventricular and interventricular grooves, global or focal EAT measurements will be more appropriate to assess the clinical significance of EAT, and how many and which focal EAT measurements should be obtained is still controversial. Hence, we measured the total intrathoracic fat volume (PFV). Coronary artery assessment: The coronary arteries were systematically analyzed according to the following protocol: ⁃(a) Examination of the anatomic distribution of coronary arteries; (b) detection and localization of coronary artery lesions; (c) evaluation of composition and morphology of the lesion, calcium component of the lesion can be focal, diffuse, eccentric, or concentric; and (d) qualitative and quantitative assessment of obstruction of the vessel caused by the lesion. 2.3. Statistical AnalysisRecorded data were analyzed using the statistical package for social sciences, version 20.0 (SPSS Inc., Chicago, IL). Quantitative data were expressed as mean ± SD. Qualitative data were expressed as frequency and percentage.
The following tests were performed:
⁃Mann–Whitney U test was used for two-group comparisons in nonparametric data. ⁃Chi-square test of significance was used to compare proportions between qualitative parameters. ⁃Receiver operating characteristic (ROC) curve analysis was used to find out the overall predictivity of parameter and the best cutoff value with detection of sensitivity and specificity at this cutoff value. ⁃Multivariate logistic regression analysis: Odds ratios (OR) with 95% confidence intervals were computed to assess the overall association between each possible risk factor and the occurrence of VAD. ⁃Spearman rank correlation coefficient (rs) was used to assess the degree of association between two sets of variables if one or both of them was skewed. ⁃The confidence interval was set to 95%, and the margin of error accepted was set to 5%. ⁃Probability (P-value): P ≤ 0.05 was considered significant, P ≤ 0.001 was considered as highly significant, and P > 0.05 was considered insignificant. 2.4. Ethical ApprovalPatients were approached to ask if they are willing to engage in the research. All relevant information was explained (risks/benefits, voluntary participation, and procedures). Patients and their relatives were given adequate time to reflect on the information, to ask any questions, and to give free and voluntary consent to participate and to publish data. Rights and confidentiality of the patients were strictly conserved. This study was approved by the ethical committee of the Faculty of Medicine, Cairo University. Consent to participate and to publish data was obtained from each patient.
3. ResultsThis study was performed on 58 patients with a clinical suspicion of CAD, aged 38–70 years, with a mean age of 52.7 ± 9.3 years. Patients were classified into two groups: group 1 comprising 22 patients with normal coronary arteries and group 2 comprising 36 patients with CAD. There was highly statistically significant difference between both non-CAD and CAD groups and patients' age, younger than 60 years and older than 60 years (P = 0.001). There was no statistically significant difference between both groups and patients' sex (P = 0.06). There is a significantly higher prevalence of the classical risk factors in non-CAD versus CAD groups (P < 0.05): hypertension 45.5% versus 72.2%, diabetes 13.6% versus 55.6%, and dyslipidemia 27.3 % versus 58.3%.
The estimated PFVs of the studied patients ranged from 66.7 to 321 cm3. The calcium score of the studied patients ranged from 0 to 456.
The measured PFV of the studied groups is presented in Table 2. PFV in the non-CAD group was highly significantly lower than that in the CAD group. The estimated calcium score of the studied groups is presented in Table 3. The calcium score in the non-CAD group was highly significantly lower than that in the CAD group.
There was a highly statistically significant correlation between PFV and patients' age (P < 0.001) with no significant relation with patients' sex. There is highly significant correlation between the estimated PFV and the calcium score (Tables 4 and 5).
Table 1 - The relation of calcium score and the risk for cardiac events 0 No risk of CAD 1–10 Low risk of CAD 11–100 Mild risk of CAD 101–400 Moderate risk of CAD >400 High risk of CADIQR, interquartile range (percentile 25th-75th).
There was highly statistically significant correlation between pericardial fat volume and hypertension, diabetes, and dyslipidemia (P = 0.006, 0.01, and 0.01, respectively)
B, regression coefficient; OR, odds ratio; 95% CI, 95% confidence interval.
Variables are tested to be entered into a multivariate logistic regression analysis for risk factors of CAD and are presented in Table 6. Increased PFV is identified as an independent risk factor of CAD. Besides, the other risk factors include calcium score, hypertension, dyslipidemia, and diabetes with the odds ratios of 1.065, 1.391, 3.456, and 6.356, respectively. The odds ratio of PFV (1.075) is similar to odds ratios of other factors (calcium score, hypertension, and hyperlipidemia).
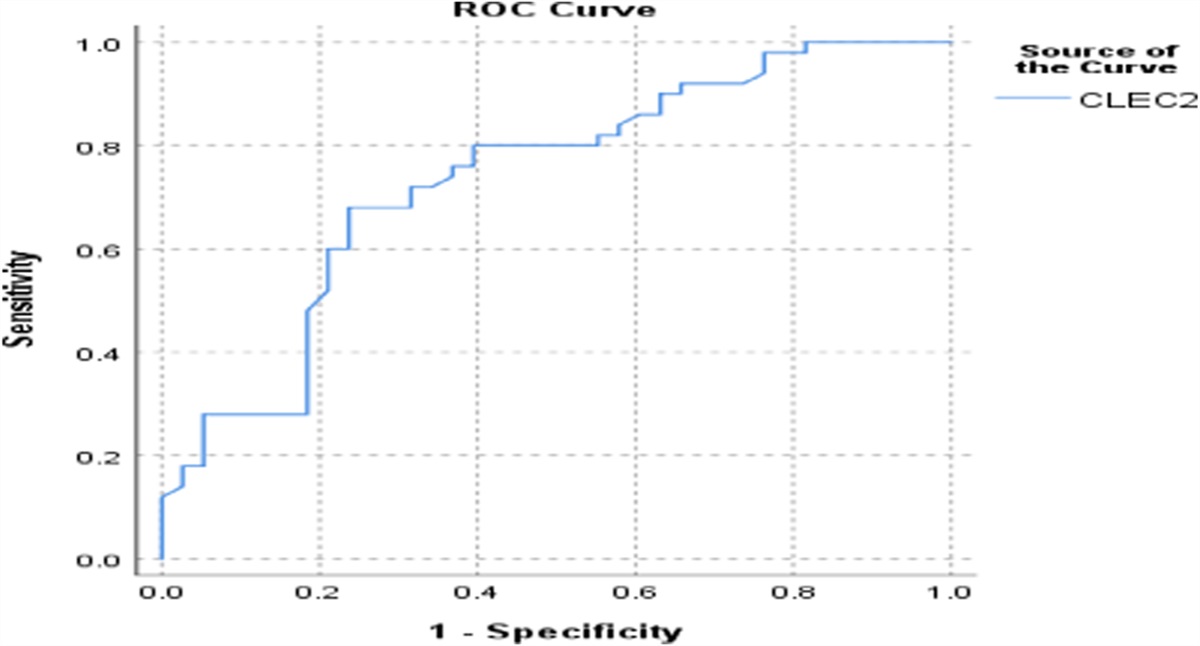
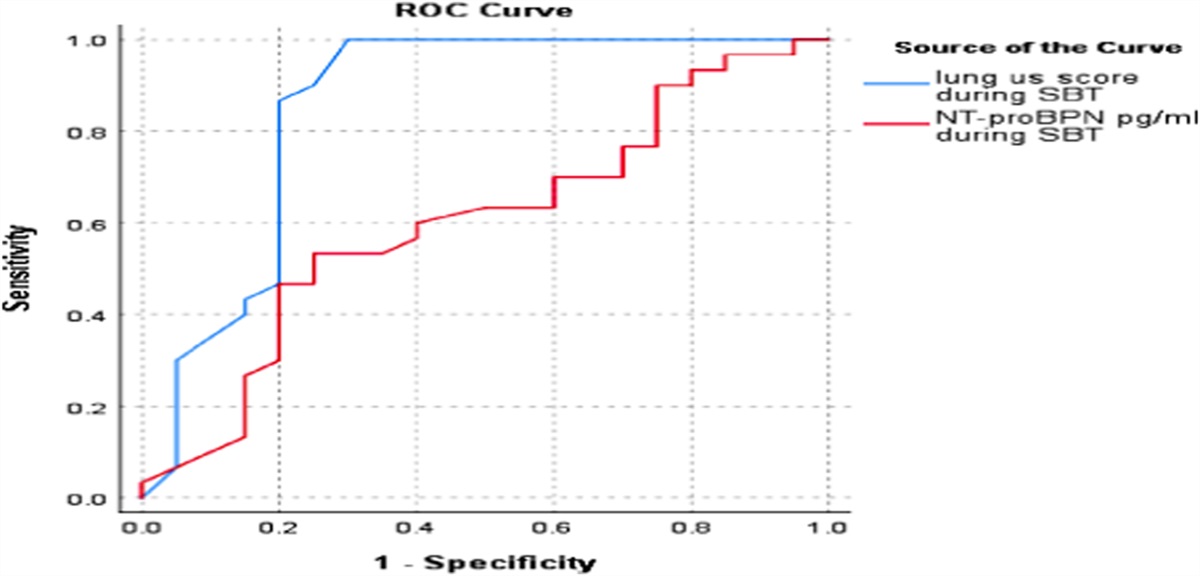
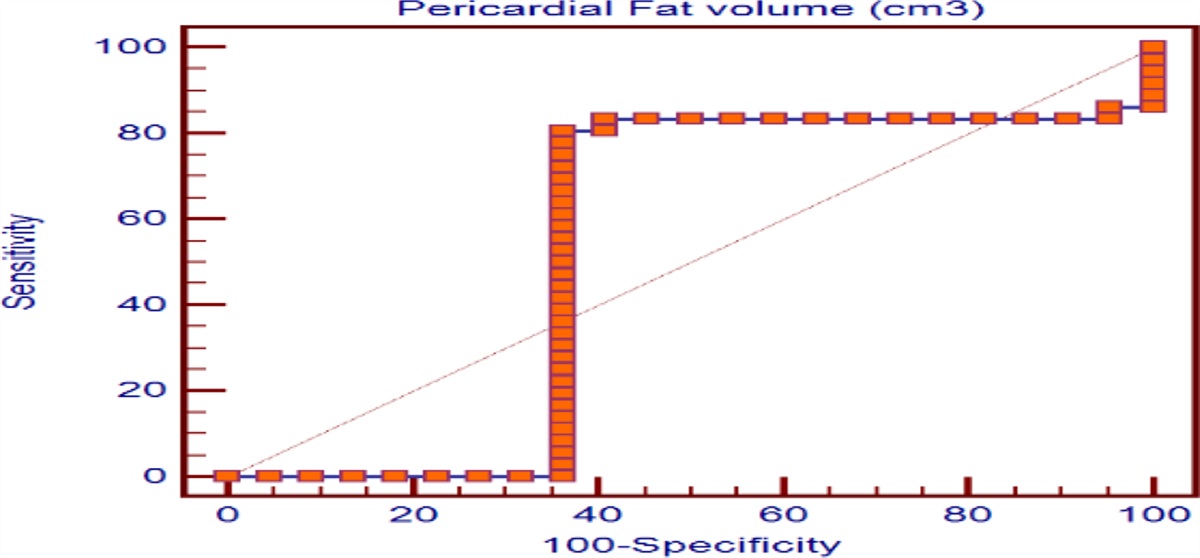
3.2. ROC CurveReceiver operating characteristic curve analysis (Figure 1) revealed an area under the curve of 0.68 with the optimal cutoff for PFV of about 120 cm3, achieving 80.6% sensitivity and 63.4% specificity. Receiver operating characteristic curve analysis (Figure 2) revealed that an area under the curve of 0.79 with the optimal cutoff for calcium score of about 18 achieved 72.2% sensitivity and 81.8% specificity.
 Figure 1.:
 Receiver operating characteristic (ROC) curve for coronary artery disease using the pericardial fat.
 Figure 2.:
 Receiver operating characteristic (ROC) curve for coronary artery disease using the calcium score.
3.3. ExampleThere was a 62-year-old male patient who was obese, hypertensive, and hyperlipidemic. He was not diabetic. He presented with chest pain radiating to the left shoulder and exertional dyspnea with positive stress ECG and BMI of 32.6. He was referred to preform multislice CT coronary angiography. The PFV was 165.3 cm3 (Figure 3F1 and F2).
 Figure 3.:
 A, LADL. B, Cx. C1, RCA. C2, RCA gives PDA. D, Volume rendering of the heart (VR). E, Calcium score. F1, Axial PFV measure. F2, Coronal PFV.
The calcium score was 22, corresponding with mild coronary artery disease risk (Figure 3E).
MDCT coronary angiography findings: LMT: Normal, patent vessel is seen bifurcating into LAD and LCx and shows no significant stenosis. LAD: It is an atherosclerotic vessel that shows calcified nonobstructive plaques with midsegment mild luminal stenosis. It gives three patent diagonal branches with no significant stenosis (Figure 3A). LCx: It is a normal nondominant vessel. It gives two obtuse marginal branches with no significant stenosis (Figure 3B). RCA: It is an atherosclerotic dominant vessel, which shows midsegment moderate luminal stenosis. It supplies the PDA and PL branches (Figure 3C1 and 3C2). 4. DiscussionTo decrease the morbidity and mortality of CAD, it is important to identify the risk factors associated with the prevalence and progression of CAD. Controlling and correcting these risk factors can decrease the incidence of cardiovascular death in 50% of patients.11
Obesity or excess amount of body fat is one of the risk factors for coronary heart disease.1 Recently, there is increased recognition of metabolically obese, normal weight persons with normal BMI and waist circumference but increased visceral adiposity.13 Recently, interest has been focused on the imaging of PAT and EAT as a proxy measure of visceral adiposity.3
Several studies searched for the relation between PFV and coronary artery disease with high heterogeneity of the results and conclusions between studies. This may be due to analysis of different prespecified subgroups according to ethnicity, the effect of other specific risk factors for CAD (diabetes and obesity), the use of different diagnostic tools for CAD assessment (either direct or indirect), and different methods for assessment of pericardial fat depots by CT, MRI, or echocardiography.9,14–16
The aim of this study was detection of the predictive and/or diagnostic value of PFV for patients with CAD using coronary CT angiography, as well as detection of the association of pericardial fat measurements with coronary artery calcium score and other comorbidities of CAD.
4.1 Relationship of Demographics Characteristics and Comorbidities With the Presence of CADThis study showed statistically significant correlation between age (60 years or older) and the presence of CAD (P = 0.001), whereas there is no statistically significant correlation between CAD groups and patients' sex (P = 0.032). Our results also revealed significantly higher prevalence of the classical risk factors in non-CAD versus CAD groups (P < 0.05): hypertension 45.5% versus 72.2%, diabetes 13.6% versus 55.6%, and dyslipidemia 27.3 % versus 58.3%. These results agree with the study of Sharma et al in 2018 which was a prospective case-control study performed on 1607 patients (980 CAD patients and 627 non-CAD patients), in which they showed that there was no statistically significant correlation between CAD groups and patients' sex (P = 0.067). In addition, they showed significantly higher prevalence of the classical risk factors (P < 0. u[b8ylgub05]): hypertension 16.6 versus 45.9% and diabetes 4.8 versus 24.9% between both groups.14
In our study, obesity showed no statistically significant differences between both groups (P = 0.122) and with PFV measures (P = 0.537). However, Sharma et al found a low significant prevalence for obesity with 46.2 versus 50.5% between the CAD and non-CAD groups (P = 0.05). These findings highlight the importance of visceral adiposity rather than total adiposity, which includes subcutaneous adiposity, supporting the hypothesis that pericardial fat plays a crucial role in the development of coronary atherosclerosis and CAD, rather than systemic obesity.
4.2. Association of PFV With Coronary Artery DiseasesIn this study, we found a positive relation of increased PFV and presence of CAD with a highly statistically significant correlation between them (P < 0.001). These results are concordant with many other studies. Chen et al. in 2015 showed that PFV was significantly greater in patients with CAD when compared with those without CAD. In addition, Taguchi et al. in 2001 found that accumulation of PAT was a stronger coronary risk factor than other body areas of fat accumulation in nonobese people. These results support the hypothesis that increased PFV may promote secretion of adipocytokines from surrounding adipose tissues, with increased fatty infiltration of the myocardium, endothelial dysfunction, and oxidative stress of adipocytokines. All those pathophysiological mechanisms of PAT have harmful effects on the structure and function of the heart and coronary arteries.17–19
In our results, we considered PFV ≥120 cm3 as the cutoff value for development of CAD, with a significant area under the ROC curve of 0.65, achieving 80.6 % sensitivity and 63.4 % specificity, and this could help in prediction, diagnosis, and prognosis of CAD. There is controversy among investigators about the cutoff value of PFV for development of CAD. Si et al. in 2020 revealed that PFV ≥174.5 cm was the cutoff value for diagnosis of CAD, with a significant area under the ROC curve of 0.66, whereas Saad et al. in 2015 showed that the cutoff value of PFV was 80 cm3, with a significant area under the ROC curve of 0.62, which had the predictive value for significant CAD. This discrepancy between the cutoff values may be related to the analysis of small sample volumes, different ethnicity of the patients, or the use of different diagnostic tools for measurement of pericardial fat depots. This discrepancy raises the need for a larger-scale multicenter study to standardize the tools and methods of estimation of PFV to determine the exact cutoff value correlated with CAD.16,20
4.3. Association of PFV With Calcium Score and Other CAD Risk FactorsIn this study, we found that PFV is significantly correlated with some risk factors of CAD, such as aging, hypertension, diabetes, dyslipidemia, and calcium score, and so it may be considered an independent risk factor of CAD. Our study showed that PFV has highly statistically significant correlation with calcium score (P < 0.001). In addition, our study revealed a significant relation between PFV and hypertension, diabetes, and dyslipidemia (P = 0.006, 0.01, and 0.01, respectively). These results agree with the study of Si et al. in 2020 who investigated 682 patients, divided into high PAT volume group (PATV ≥174.5 cm3, n = 506) and low PATV group (PATV <174.5 cm3, n = 176) according to the optimal CT diagnostic cutoff point for PATV (PFV >174.5 cm). Their study showed that PATV was significantly related to the classic risk factors of CAD: age, BMI, hypertension, diabetes mellitus, calcium score, serum triglyceride levels, and LDL-C levels that were positively correlated with PATV, whereas HDL-C levels were negatively correlated with PATV. Several studies also mentioned that PATV was positively correlated with coronary calcium.21,22
Contrarily, our study disagrees with the point of relation between PFV and BMI in the study of Si et al. This study also showed significant association between PFV and BMI.
Generally, PFV has good prognostic value for developing coronary artery diseases, and increased PFV is considered an independent risk factor of CAD and correlated with other risk factors of CAD, such as age, hypertension, hyperlipidemia, diabetes, and calcium score. PAT volume can also be used as a screening test for patients suspicious for CAD.
References [1]. Yong HS, Kim EJ, Seo HS, Kang EY, Kim YK, Woo OH, Han H. Pericardial fat is more abundant in patients with coronary atherosclerosis and even in the non-obese patients: evaluation with cardiac CT angiography. Int J Cardiovasc Imaging. 2010;26(1):53-62. [2]. Sacks HS, Fain JN. Human epicardial adipose tissue: A review. AmHeart J, 2007;153(6):907-917. [3]. Fitzgibbons TP, Czech MP. Epicardial and perivascular adipose tissues and their influence on cardiovascular disease: basic mechanisms and clinical associations. J Am Heart Assoc. 2014;3(2):e000582. [4]. Aslanabadi N, Salehi R, Javadrashid A, Tarzamni MK, Khodadad B, Enamzadeh E, Montazerghaem H. Epicardial and pericardial fat volume correlate with the severity of coronary artery stenosis. J Cardiovasc Thorac Res. 2014;6(4):235-239. [5]. Cicero AFG, Fogacci F. Pericardial fat as a new independent biomarker of vascular aging. Int J Cardiol. 2018; 260: 211–212. [6]. Schlett CL, Ferencik M, Kriegel MF, Bamberg F, Ghoshhajra BB, Joshi SB, Nagurney JT, Fox CS, Truong QA, Hoffmann U. Association of pericardial fat and coronary high-risk lesions as determined by cardiac CT. Atherosclerosis. 2012;222(1):129–134. [7]. Şengül C, Özveren O. Epicardial adipose tissue: a review of physiology, pathophysiology, and clinical applications. Anatolian J Cardiol, 2013; 13: 261-265. [8]. Davidovich D, Gastaldelli A, Sicari R. Imaging cardiac fat. Eur Heart J Cardiovasc Imaging, 2013;14:625-630. [9]. Okura K, Maeno K, Okura S, Takemori H, Toya D, Tanaka N, Miyayama S. Pericardial fat volume is an independent risk factor for the severity of coronary artery disease in patients with preserved ejection fraction. J Cardiol. 2015;65(1):37-41. [10]. Coppini G, Favilla R, Marraccini P, Moroni D, Pieri G. Quantification of epicardial fat by cardiac CT imaging. Open Med Inform J, 2010;4:126-135. [11]. Canpolat U, Aytemir K, Yorgun H, Hazirolan T, Bariş Kaya E, Ateş AH, Sunman H, Dural M, Yalcin MU, Tokgözoglu L, Kabakci G. Association of type 2 diabetes mellitus with coronary atherosclerotic plaque burden and morphology measured by multidetector computed tomography coronary angiography. Acta cardiologica. 2012;67(1):71-77. [12]. Tzung-Dau W, Wen-Jeng L, Ming-Fong C. Epicardial adipose tissue measured by multidetector computed tomography: practical tips and clinical implications. Acta Cardiol Sin, 2010;26: 55- 68. [13]. Litwin SE. Normal weight obesity: is bigger really badder? Circ Cardiovasc Imaging. 2012;5:286–288. [14]. Chen O, Sharma A, Ahmad I, Bourji N, Nestoiter K, Hua P, Hua B, Ivanov A, Yossef J, Klem I, Briggs WM. Correlation between pericardial, mediastinal, and intrathoracic fat volumes with the presence and severity of coronary artery disease, metabolic syndrome, and cardiac risk factors. Eur Heart J Cardiovasc Imaging. 2015;16(1):37-46. [15]. Nafakhi H, Al-Mosawi A, Al-Nafakh H, Tawfeeq N. Association of pericardial fat volume with coronary atherosclerotic disease assessed by CT angiography. Br J Radiol. 2014;87:1038-1045. [16]. Si Y, Cui Z, Liu J, Ding Z, Han C, Wang R, Liu T, Sun L. Pericardial adipose tissue is an independent risk factor of coronary artery disease and is associated with risk factors of coronary artery disease. J Int Med Res. 2020; 48(6):0300060520926737. [17]. Iacobellis G. Local and systemic effects of the multifaceted epicardial adipose tissue depot. Nat. Rev. Endocrinol, 2015;11:363–371. [18]. Payne GA, Kohr MC, Tune JD. Epicardial perivascular adipose tissue as a therapeutic target in obesity-related coronary artery disease. Br J Pharmacol. 2012;165:659–669. [19]. Taguchi R, Takasu J, Itani Y, Yamamoto R, Yokoyama K, Watanabe S, Masuda Y. Pericardial fat accumulation in men as a risk factor for coronary artery disease. Atherosclerosis, 2001; 157:203-209. [20]. Saad Z, El-Rawy M, Donkol RH, Boghattas S. Quantification of epicardial fat: Which method can predict significant coronary artery disease. World J Cardiol. 2015; 7(5):287. [21]. Choi TY, Ahmadi N, Sourayanezhad S, et al. Relation of vascular stiffness with epicardial and pericardial adipose tissues, and coronary atherosclerosis. Atherosclerosis 2013;229:118–123. [22]. Muuronen AT, Taina M, Onatsu J, et al. vWF correlates with visceral and pericardial adipose tissue in patients with a recent stroke of suspected cardiogenic etiology. PLoS ONE. 2017;12:e0178508.
留言 (0)