
記住我
In sepsis, circulatory failure is widespread and is accompanied with an increased risk of death. Prompt diagnosis is essential for optimal outcomes. It is important to evaluate response to fluid in critical sepsis patients.1 That is because fluid loading may produce or exacerbate peripheral and pulmonary edema if cardiac function is unable to adjust for the increase in preload with impairment microvascular perfusion and oxygen transport.2 Fluid responsiveness can be defined as increased stroke volume (SV) or cardiac output (CO) by 15% after a 500 mL fluid infusion.3
The measurement of static hemodynamic parameters is of little significance in predicting fluid challenge responsiveness.4 Dynamic parameters are more significant than static ones in predicting the response to fluid. The heart and lungs collaboration represents the key for dynamic measurements because the respiration cycle induces cardiac changes in both pressure and volume load. This makes them of clinical significance. These dynamic parameters are respiratory-induced changes in aortic blood velocity, SV, and CO changes when passive raising leg.5
Moreover, echocardiography is an essential tool for dynamic qualitative assessment of fluid load responsiveness in sepsis patients with shock.6
Some researchers have proposed that vena cava flow, rather than diameter, may be a more accurate measure of preload. Because the vena cava is angular in the subcostal images which prevents reliable flow images, measurements of hepatic venous flow using Doppler were used as a proxy to estimate preload.7
The aim of this study was to define the potential hepatic blood flow response to intravenous fluids in clinical sepsis if this can guide intravenous fluid resuscitation.
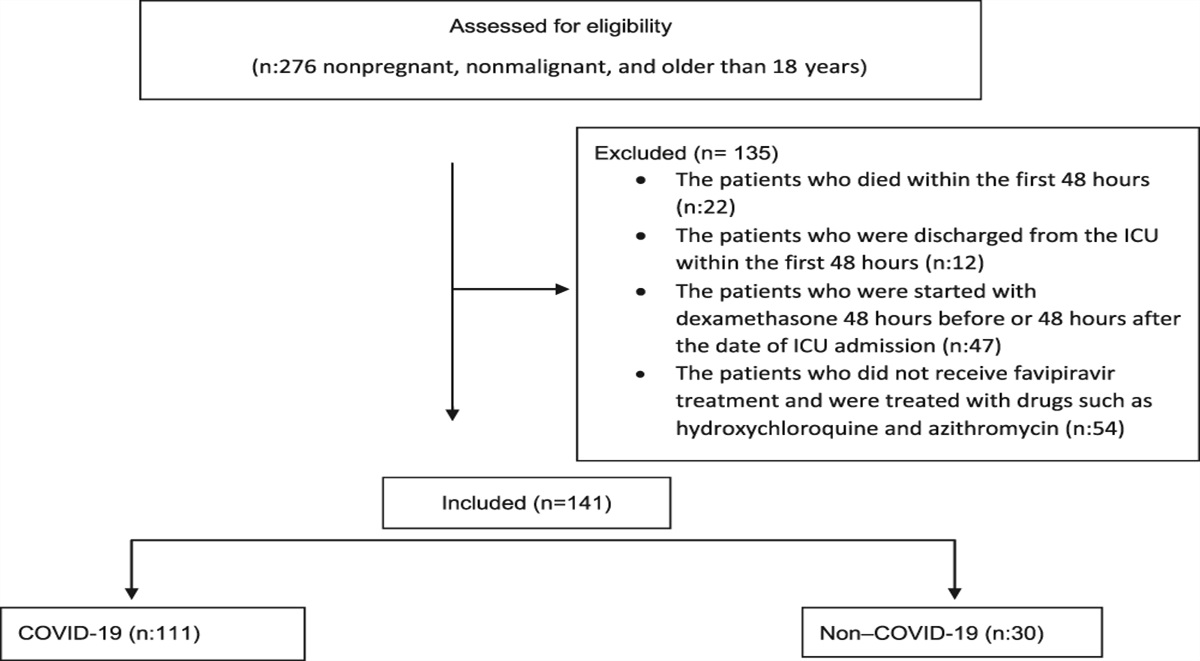
2. Patients and MethodsThis study is a cross-sectional observational study. The patients who were admitted to the critical care unit in Cairo University Hospital from December 2019 to June 2021 and diagnosed as septic shock or they developed septic shock at any time in the ICU were included. This study was approved by the Cairo University Ethical Committee, and an informed consent for enrollment in this study was taken from the patients.
2.1. Patients 2.1.1. Inclusion criteria - Age older than 18 years. - Both sexes: male and female. - Patients with sepsis requiring vasopressors to maintain a MAP of 65 mmHg. - Sepsis definitions according to The Third International Consensus Definitions for Sepsis and Septic Shock (Sepsis-3). - Life-threatening organ dysfunction (an acute change of more than or equal to 2 points in total SOFA score), the baseline SOFA score can be considered zero if no organ dysfunction is preexisting, hypotension when persistent and requiring vasopressors to keep mean arterial pressure more than or equal to 65 mm Hg, and a serum lactate level more than 2 mmol/L (18 mg/dL) in the presence of adequate fluid resuscitation. 2.1.2. Exclusion criteria - Patient's refusal. - Age younger than 18 years. - Preexisting liver disease. - Positive pressure ventilation (invasive or noninvasive). - Acute myocardial infarction. - Persistent arrhythmia. - Chronic renal disease. - Valvular heart disease with reflux. - Heart failure. - High abdominal pressure. 2.1.3. Patients' distribution among groupsThis study included 30 patients who were diagnosed with septic shock. Patients were then categorized to 2 groups (responders and nonresponders).
2.2. MethodsAll patients had a central venous catheter inserted (Amecath CTLC0720‐KGSN triple lumen CVC7 Fr) into either the subclavian vein or internal jugular vein following local guidelines for aseptic insertion.
All patients received initial resuscitation with 30 mL/kg within one hour of diagnosis; all patients received broad spectrum antibiotics according to the local protocol.
All patients were put on vasopressors to keep a MAP of more than 65 mm Hg.
2.2.1. Clinical AssessmentAfter enrollment:
1. History: asking about any chronic medical conditions or operative history. 2. Complete physical examination. 3. SOFA score for assessment of organ failure (Table 1). 4. APACHE score to assess disease severity (Table 2). Table 1 - Sequential organ failure assessment variables and correlated scores (Vincent et al., 1996) Variables SOFA score 0 1 2 3 4 Respiratory PaO2/FIO2 >400 PaO2/FIO2 <400 PaO2/FIO2 <300 PaO2/FIO2 <200 PaO2/FIO2 <100 SPO2/FiO2 >302 SPO2/FiO2 <302 SPO2/FiO2 <221 SPO2/FiO2 <142 SPO2/FiO2 <67 Cardiovascular (mcg/kg/min) MAP ≥70 mm Hg MAP ≥70 mm Hg Dopamine ≤ 5 or ANY dobutamine Dopamine >5GCS, Glascow Coma Scale; FiO2, fraction of inspired oxygen; MAP, mean arterial pressure; SOFA, sequential organ failure assessment (score); SPO2, oxygen saturation.
Chronic health points: 5 points for nonoperative or emergency postoperative patients and 2 points for elective postoperative patients
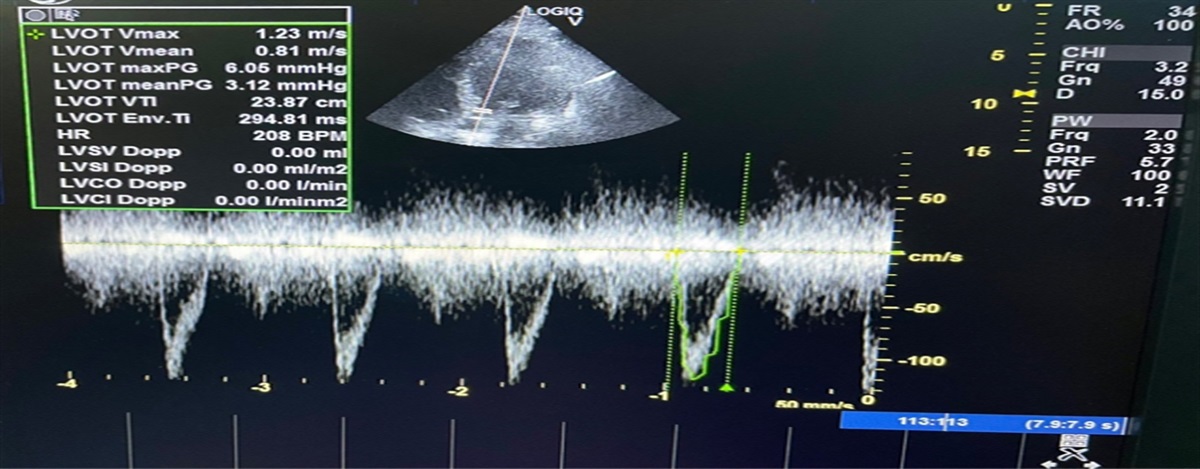
 Figure 1.:
 LVOT VTI-Apical 5 chambers.
 Figure 2.:
 LVOT diameter PLAX.
Stroke volume = LVOT cross-sectional area (cm2) × LVOT VTI (cm).
2.2.6. Abdominal US and Doppler US of the liverAll patients are to be examined at rest, lying flat, and in supine position. The US probe is put at the right subcostal area. The patient is asked to take a deep breath and to hold it. The patient is asked to put his right arm over his head and lie in a semilateral position for a better visualization of the liver.
Color Doppler is performed at porta hepatis.
Total hepatic blood flow is calculated as the sum of portal vein blood volume flow (BVF) (Fig.3) and hepatic artery BVF (Fig.4) in each subject.
 Figure 3.:
 Hepatic artery volume flow.
 Figure 4.:
 Portal vein volume flow.
Doppler spectrum time average mean velocity (Vmean = velocity time integral/time of spectral trace in s) and vessel diameter as follows:
Blood volume flow = Vmean × 60s × A2.
Where Vmean is in cm/s and A2 is vessel area in cm2.
The sample volume for spectral Doppler will be centered in the vessels. The insonation angle between the path of the Doppler pulses and the flow direction in the vessel was kept at 60° or less, and the angle correction cursor will be parallel to the direction of flow.
2.3. Study a. Left ventricular stroke volume was then measured for all patients using the previously stated technique. b. Total hepatic blood flow was also measured for all patients simultaneously using the previously stated technique. c. All patients then received 500 mL of normal saline over 15 minutes (Rapid Volume Expansion Test) d. Left ventricular stroke volume and total hepatic blood flow were measured again for all patients after receiving 500 mL NS. e. Patients were then categorized into 2 groups (volume responders and volume nonresponders) on an increase in left ventricular stroke volume of more than 15%. If there is increase in the SV after fluid administration of more than 15 %, then the patient is categorized as “ fluid responder”; otherwise, he is categorized as “fluid nonresponder.” 2.3.1. Outcome assessmentPrimary and secondary outcomes were assessed for all patients and include
i. primary outcome: stroke volume changes, hepatic blood flow changes, and weaning of vasopressors. ii. secondary outcome: duration of ICU stay and mortality. 2.3.2. Statistical methodsData were collected and analyzed using statistical package for the Social Sciences (SPSS) version 26 (IBM Corp., Armonk, NY).
Data were presented as mean and standard deviation for quantitative variables and as frequencies (number of cases) and relative frequencies (percentages) for categorical variables.
To compare between groups, the unpaired Student t test was used, and to compare the means of the same group, we used paired sample student t test. For comparing categorical data, the chi square test was used. Exact test was used instead when the expected frequency is less than 5.
Correlations between quantitative variables were performed using Spearman correlation coefficient. P values less than 0.05 were considered as statistically significant.
3. ResultsOf 30 patients included in this study, 17 patients were responsive to intravenous fluids administration (responders group), while 13 were nonresponsive (nonresponders group). There was no statistically significant difference between both groups regarding demographic data or laboratory findings. Table 3 presents the clinical data of both study groups.
Table 3 - Comparison between studied groups regarding clinical data Responders Nonresponders P SOFA score mean ± SD 7.47 ± 0.94 7.77 ± 1.17 0.444 APACHE II score mean± SD 14.2 ± 1.56 15.57 ± 1.83 0.325 Length of ICU stay (days) mean± SD 12.47 ± 3.6 20.54 ± 2.57 <0.001 Weaning of vasopressor count (%) Yes 12 (70.5) 4 (30.8) <0.001 No 5 (29.5) 9 (69.2) Mortality count (%) Dead 8 (47.1) 9 (69.2) 0.225 Alive 9 (52.9) 4 (30.8)P values less than 0.05 were considered as statistically significant.
ICU, intensive care unit; SOFA, sequential organ failure assessment.
After the administration of intravenous fluids, stroke volume, cardiac output, and MAP were significantly higher among patients in the responders group when compared with the nonresponders group (P = 0.001 for all). However, the heart rate and central venous pressure were significantly lower among patients in the responders group when compared with the nonresponders group (P = 0.001 and <0.001, respectively). Otherwise, there was no statistically significant difference between both groups regarding other ultrasonographic findings (Table 4).
Table 4 - Comparison between both groups regarding ultrasonographic and clinical findings Responders Nonresponders P Mean ± SD Mean ± SD EF (%) 65.47 ± 6.87 68.92 ± 3.35 0.108 Stroke volume before (mL/m2) 78.71±3.82 83.62 ± 3.80 0.361 Stroke volume after (mL/m2) 98.65 ± 3.84 85.77 ± 3.98 <0.001 Heart rate before (BPM) 117.35 ± 5.07 116.23 ± 4.64 0.539 Heart rate after (BPM) 108.65 ± 4.14 115.00 ± 5.15 0.001 Cardiac output before (L/min) 9.233 ± 539.04 9.723 ± 659.73 0.636 Cardiac output after (L/min) 10.716 ± 556.47 9.863 ± 635.75 0.001 Cardiac Index before (L/min/m2) 4.1 ± 0.5 4.6 ± 0.5 0.519 Cardiac Index after (L/min/m2) 4.8 ± 0.6 4.7 ± 0.6 0.001 Portal vein Vol.Flow before (mL/min) 1516.71 ± 87.81 1482.15 ± 111.99 0.351 Portal vein Vol.Flow after (mL/min) 1577.76 ± 101.38 1501.31±116.82 0.066 Hepatic artery Vol.Flow before 458.76 ± 59.49 471.77 ± 48.93 0.528 Hepatic artery Vol.Flow after 490.24 ± 59.07 482.69 ± 45.50 0.706 Total hepatic Vol.Flow before 1975.47 ± 119.56 1953.92 ± 115.73 0.624 Total hepatic Vol.Flow after 2068.00 ± 124.87 1984.00 ± 124.83 0.079 MAP before (mmHg) 71.24 ± 2.08 71.77 ± 1.30 0.424 MAP after (mmHg) 83.41 ± 2.15 72.85 ± 1.28 <0.001 CVP before (cmH2o) 9.82 ± 1.47 10.92 ± 1.80 0.076 CVP after (cmH2o) 11.94 ± 1.48 16.92 ± 2.33 <0.001P values less than 0.05 were considered as statistically significant.
CVP, central venous pressure; EF, ejection fraction; MAP, mean arterial pressure.
The % changes in each stroke volume, cardiac output, MAP, hepatic artery volume flow, total hepatic volume flow, and portal vein volume flow were significantly higher among patients in the responders group when compared with the nonresponders group (P < 0.001 for all). However, the % changes in CVP were significantly lower among patients in the responders group when compared with the nonresponders group (P < 0.001) (Table 5).
Table 5 - Comparison between both groups regarding ultrasonographic and clinical findings Responders Nonresponders P Mean ± SD Mean ± SD EF (%) 65.47 ± 6.87 68.92 ± 3.35 0.108 Stroke volume before (mL/m2) 78.71 ± 3.82 83.62 ± 3.80 0.361 Stroke volume after (mL/m2) 98.65 ± 3.84 85.77 ± 3.98 <0.001 Heart rate before (BPM) 117.35 ± 5.07 116.23 ± 4.64 0.539 Heart rate after (BPM) 108.65 ± 4.14 115.00 ± 5.15 0.001 Cardiac output before (L/min) 9.233 ± 539.04 9.723 ± 659.73 0.636 Cardiac output after (L/min) 10.716 ± 556.47 9.863 ± 635.75 0.001 Cardiac Index before (L/min/m2) 4.2 ± 0.5 4.6 ± 0.5 0.519 Cardiac Index after (L/min/m2) 4.9 ± 0.6 4.7 ± 0.6 0.001 Portal vein Vol.Flow before (mL/min) 1516.71 ± 87.81 1482.15 ± 111.99 0.351 Portal vein Vol.Flow after (mL/min) 1577.76 ± 101.38 1501.31 ± 116.82 0.066 Hepatic artery Vol.Flow before 458.76 ± 59.49 471.77 ± 48.93 0.528 Hepatic artery Vol.Flow after 490.24 ± 59.07 482.69 ± 45.50 0.706 Total hepatic Vol.Flow before 1975.47 ± 119.56 1953.92 ± 115.73 0.624 Total hepatic Vol.Flow after 2068.00 ± 124.87 1984.00 ± 124.83 0.079 MAP before (mmHg) 71.24 ± 2.08 71.77 ± 1.30 0.424 MAP after (mmHg) 83.41 ± 2.15 72.85 ± 1.28 <0.001 CVP before (cmH2o) 9.82 ± 1.47 10.92 ± 1.80 0.076 CVP after (cmH2o) 11.94 ± 1.48 16.92 ± 2.33 <0.001P values less than 0.05: statistically significant.
CVP, central venous pressure; MAP, mean arterial pressure.
Among patients in the responders group, there was a statistically significant increase in postadministration readings of each of stroke volume, cardiac output, portal vein volume flow, hepatic artery volume flow, and total hepatic volume flow (P < 0.001 for all). However, there was a statistically significant decrease in postadministration readings of the heart rate when compared with the preadministration readings (P < 0.001) (Table 5).
3.4. Comparison between ultrasonographic findings before and after intravenous fluids administration in the nonresponders groupAmong patients in the nonresponders group, there was a statistically significant but clinically nonsignificant increase in postadministration readings of each of stroke volume, cardiac output, cardiac index, and MAP (P = 0.001, 0.004, 0.032, and 0.001, respectively). However, there was a statistically significant increase in portal vein volume flow, hepatic artery volume flow, and total hepatic volume flow (P = 0.024, 0.001, and 0.001). There was a statistically significant increase in CVP readings when compared with the preadministration readings (P ≤ 0.001) (Table 5).
3.5. CorrelationsIn both responders and nonresponders groups, there was no statistically significant correlation between delta stroke volume % change and any of hepatic artery volume flow % change, portal vein volume flow change %, or total hepatic volume flow % change (Table 6).
Table 6 - Correlation between delta stroke volume % change and each of hepatic artery volume flow % change, portal vein volume flow % change, and total hepatic volume flow % change in responders and nonresponders Stroke volume % change Responders Nonresponders Hepatic artery volume flow % change Correlation Coefficient −0.037 −0.355 P value 0.889 0.233 N 17 13 Total hepatic volume flow % change Correlation Coefficient
留言 (0)