
記住我
Up to 25% of critically ill patients experience difficulties in weaning from invasive mechanical ventilation (IMV), burdening the intensive care unit (ICU) with long lengths of stay, prolonged mechanical ventilation, and increased morbidity and mortality, whereas premature extubation exposes the patient to cardiovascular stress because of spontaneous breathing, often requiring the reinstitution of ventilatory support.1
Determining the optimal time to extubate a patient continues to be a challenge.2,3 Weaning failure is commonly described as a failed spontaneous breathing trial (SBT) or the reinstitution of mechanical ventilation within 2–7 days after extubation.4,5 The international guidelines recommend the implementation of spontaneous breathing trials,6 but SBT alone is ineffective in predicting weaning failure and reintubation.7,8 Lung ultrasound studies were performed to add help in weaning success with implementation of multiple scores for prediction of postextubation distress during SBT.9
2. AIM OF WORKThe aim of this study was to evaluate the validity of lung ultrasound score (LUS) in prediction of weaning outcomes and postextubation distress after spontaneous breathing trial.
3. PATIENTS AND METHODSThis was a prospective observational study conducted on 50 patients admitted to critical care department, Cairo University's hospitals, who were intubated and mechanically ventilated.
This study was performed from December 2020 to July 2021. Informed written consent was obtained from first-degree relatives. Approval from the local ethics committee was obtained (MS-490-2020) and registered on ClinicalTrials.gov (NCT05289960).
3.1. Inclusion criteria 1. Patients older than 18 years. 2. Patients intubated and mechanically ventilated for more than 48 hours in the intensive care unit and planned for extubation. 3.2. Exclusion criteria 1. Patients 18 years or younger. 2. Patients with left or right ventricular failure. 3. Pulmonary hypertension. 4. Aortic valve disease. 5. Hyperthyroidism (there is a significant elevation in plasma BNP in patients with hyperthyroidism; the increase is largely due to hyperthyroidism-induced left ventricular dysfunction).All patients were subjected to the following:
• History taking, physical examination, and laboratory results including arterial blood gases. • Acute physiology and chronic health evaluation (APACHE) II score was calculated for all patients on admission.10 • Sequential organ failure assessment score (SOFA score) was calculated for all patients through the ICU stay.11 • The serum level of NT-pro BNP was measured to all patients at the end of spontaneous breathing trial using the electrochemiluminescence detection method (Roche Diagnostics, Germany).12The clinical weaning protocol included daily screening for weaning readiness according to the following criteria:
a) Recovery from the precipitating illness. b) Respiratory criteria (Pao2:Fio2 ratio >150 mmHg with Fio2 ≤0.4, positive end-expiratory pressure <8 cm H2O, and arterial pH >7.35). c) Clinical criteria (absence of electrocardiographic signs of myocardial ischemia, no vasoactive drugs or only low doses of vasopressors, heart rate <100/min, hemoglobin >8 g/dL, temperature <38°C, no need for sedatives, presence of respiratory stimulus, and appropriate spontaneous cough).Patients fulfilling these criteria underwent a spontaneous breathing trial either using T tube or 8 cm H2O of pressure support for 30–120 minutes.
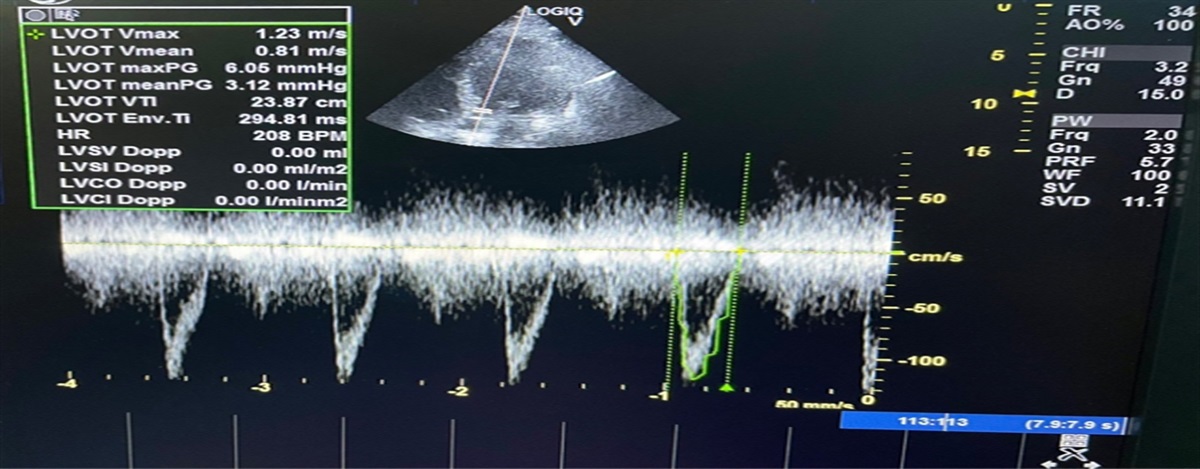
Lung ultrasound score was done at the end of SBT using curved array ultrasound probe 2–5MHz (Siemens X300, Korea) by a highly skilled lung ultrasound operator.
• Technique13: i. All intercostal spaces of the anterior, lateral, and posterior regions of both lungs (6 regions per side) are evaluated. ii. For each region, the worst ultrasound pattern is considered to be representative of the entire region. iii. Normal aeration is represented by the presence of lung sliding and horizontal A lines or less than 3 vertical B lines. iv. A score of 0 is assigned to a lung region if all intercostal spaces show normal aeration. v. A moderate loss of aeration is characterized by multiple regularly or irregularly spaced B lines that originate from pleural line or from small juxtapleural consolidations. vi. A score of 1 is assigned to a lung region if all intercostal spaces show a moderate loss of aeration. vii. A score of 2 is assigned to the examined region if a severe loss of aeration is characterized by the presence of coalescent B lines in several intercostal spaces, occupying the whole intercostal space. viii. A score of 3 is assigned to the examined region if a complete loss of lung aeration, as observed in lung consolidation, is characterized by tissue echogenicity with static or dynamic air bronchograms. ix. The scores of the 12 examined regions are summed to calculate the LUS score, which ranges between 0 and 36. 4. Postextubation failure was considered in cases requiring reintubation or noninvasive ventilation within 48 hours after extubation. 5. Patients were followed up for ICU stay, hospital stay, and mortality. 6. Patients were classified into 2 groups: failed and successful extubation groups. 3.3. Indications of reintubation included in this study 1. Hypoxemia in the form of PO2 <50 on RA or <200 on FiO2 100%. 2. Respiratory rate >40 or <6. 3. Impaired conscious level, hemodynamic instability, and excessive secretions. 3.4. Primary outcomes • To evaluate the validity of lung ultrasound score in prediction of weaning outcomes and postextubation distress after spontaneous breathing trial.Extubation success is defined as no need for respiratory support neither NIV nor intubation for one week during ICU stay.
Extubation failure is defined as the need for reinstitution of ventilator support within 24–48 hours of planned endotracheal tube removal.14
3.5. Secondary outcomes 1. ICU stay 2. ICU mortality 3.6. Statistical analysisData were coded and entered using the statistical package for the Social Sciences (SPSS) version 26 (IBM Corp, Armonk, NY). Data were summarized using mean, standard deviation, median, minimum, and maximum in quantitative data and using frequency (count) and relative frequency (percentage) for categorical data. Quantitative variables were compared using the nonparametric Kruskal-Wallis and Mann-Whitney tests.
For comparing categorical data, the chi square (χ2) test was performed. Correlations between quantitative variables were analyzed using the Spearman correlation coefficient.
Receiver operating characteristic (ROC) curve was constructed with area under the curve (AUC) analysis performed to detect best cutoff value of US score and serum NT-proBNP for detection of successful weaning. P-values less than 0.05 were considered as statistically significant.
4. RESULTS 4.1. Comparison between failed and successful extubation groups (Table 3, Figure 1)APACHE II score was significantly higher in the failed extubation group than the successful extubation group with a mean value 27.20 ± 5.11 and 18.33 ± 3.64, respectively (P-value <0.001). SOFA score on admission and after 2 days was significantly higher in the failed extubation group than the successful extubation group (P-value <0.001).
The duration of controlled mechanical ventilation in the successful extubated group was less than that in the failed extubation group of patients with the mean value of 4.73 ± 1.11 days and 8.75 ± 1.25 days, respectively (P-value <0.001).
Rapid shallow breathing index in the successful extubated group was lower than that in the failed extubation group with the mean value of 46.17 ± 6.16 and 77.05 ± 5.6 cycle/min/L, respectively (P-value <0.001). Lung ultrasound score in the successful extubated group was significantly lower than that in the failed extubation group with the mean value of 8.87 ± 4.24 and 17.15 ± 6.59, respectively (P-value <0.001). The failed extubation group of patients had longer duration of ICU stay and higher mortality when compared with the successfully extubated group (P value <0.001).
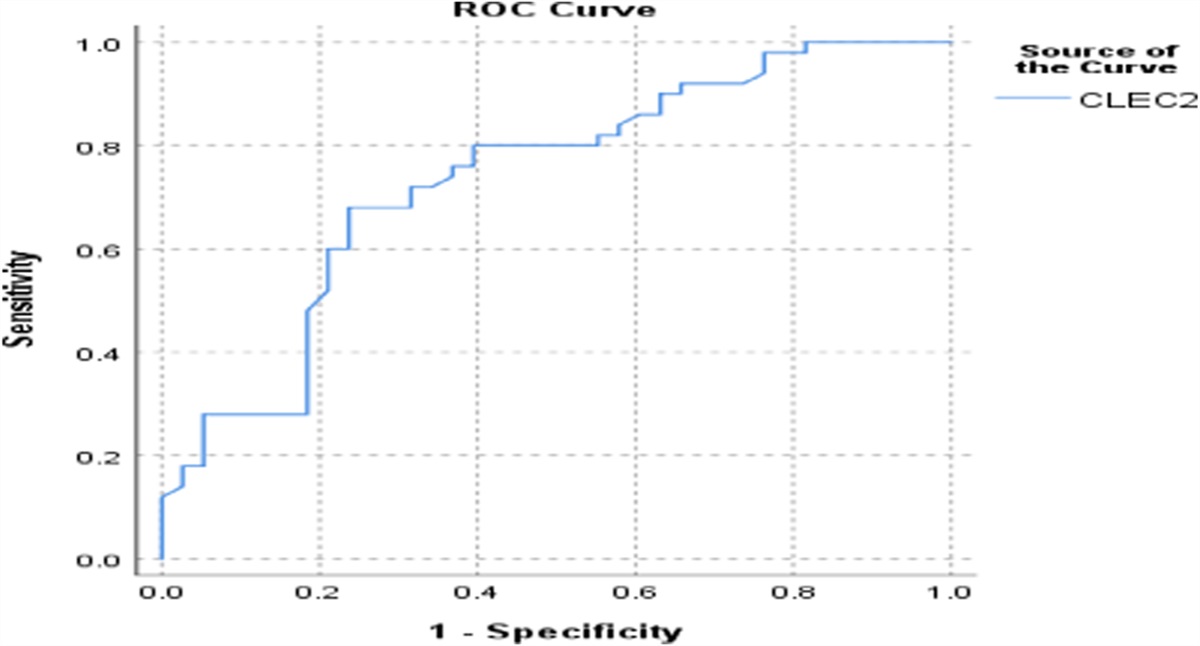
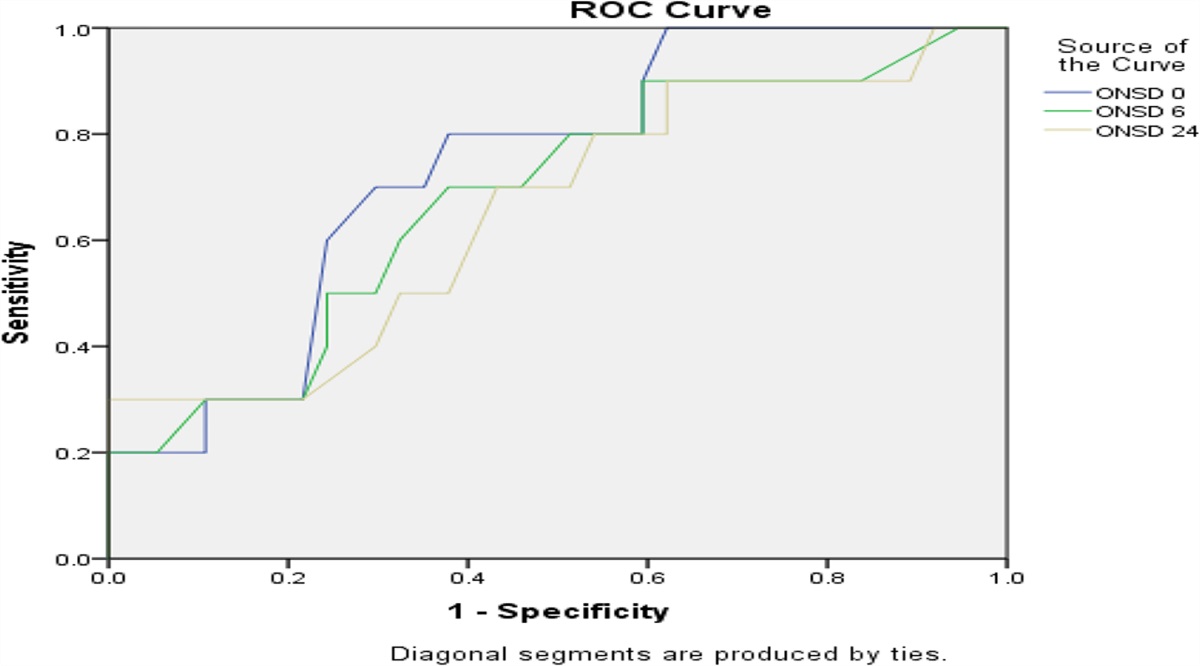
4.2. ROC curve (Table 4, Figure 1)ROC curve was used to determine the cutoff value of lung ultrasound score for prediction of successful extubation, which was 15.5 point (the area under the curve: 0.851; 95% confidence interval: 0.721–0.981) with the sensitivity and specificity of 90% and 75 %, respectively, as shown in Tables 1–4 and Figures 1–3.
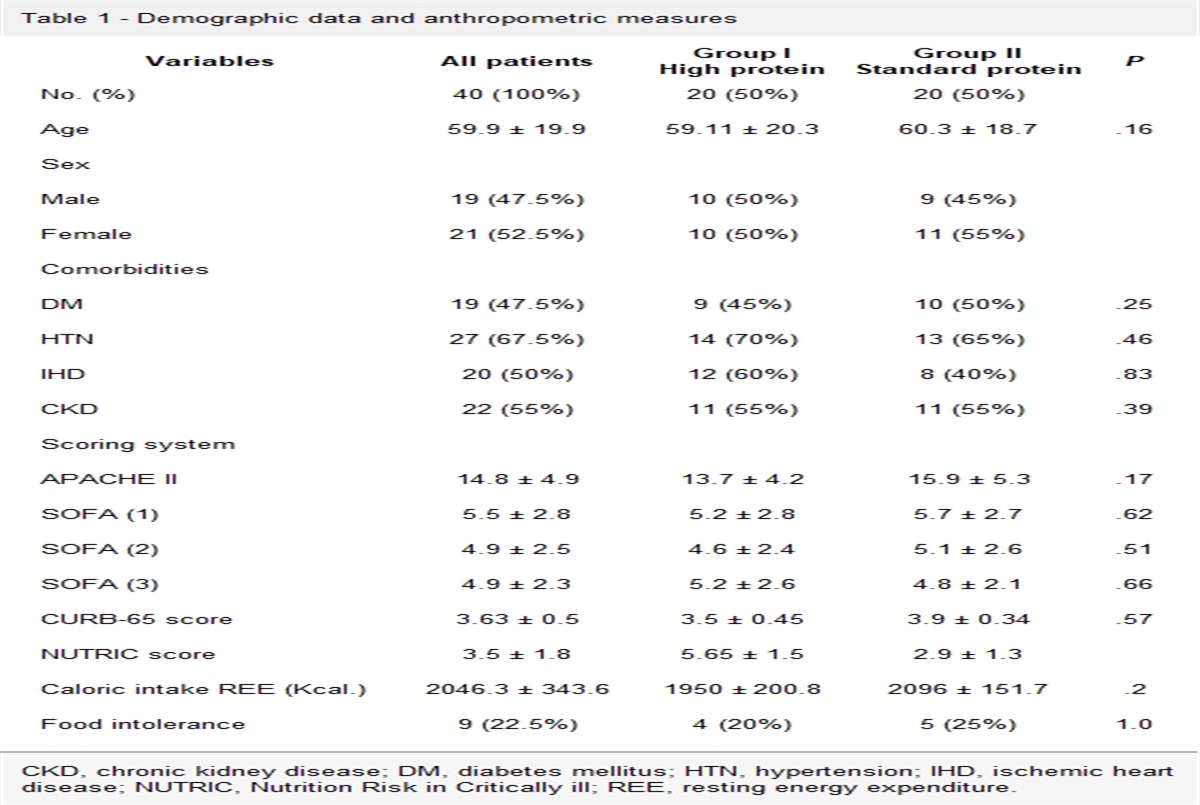
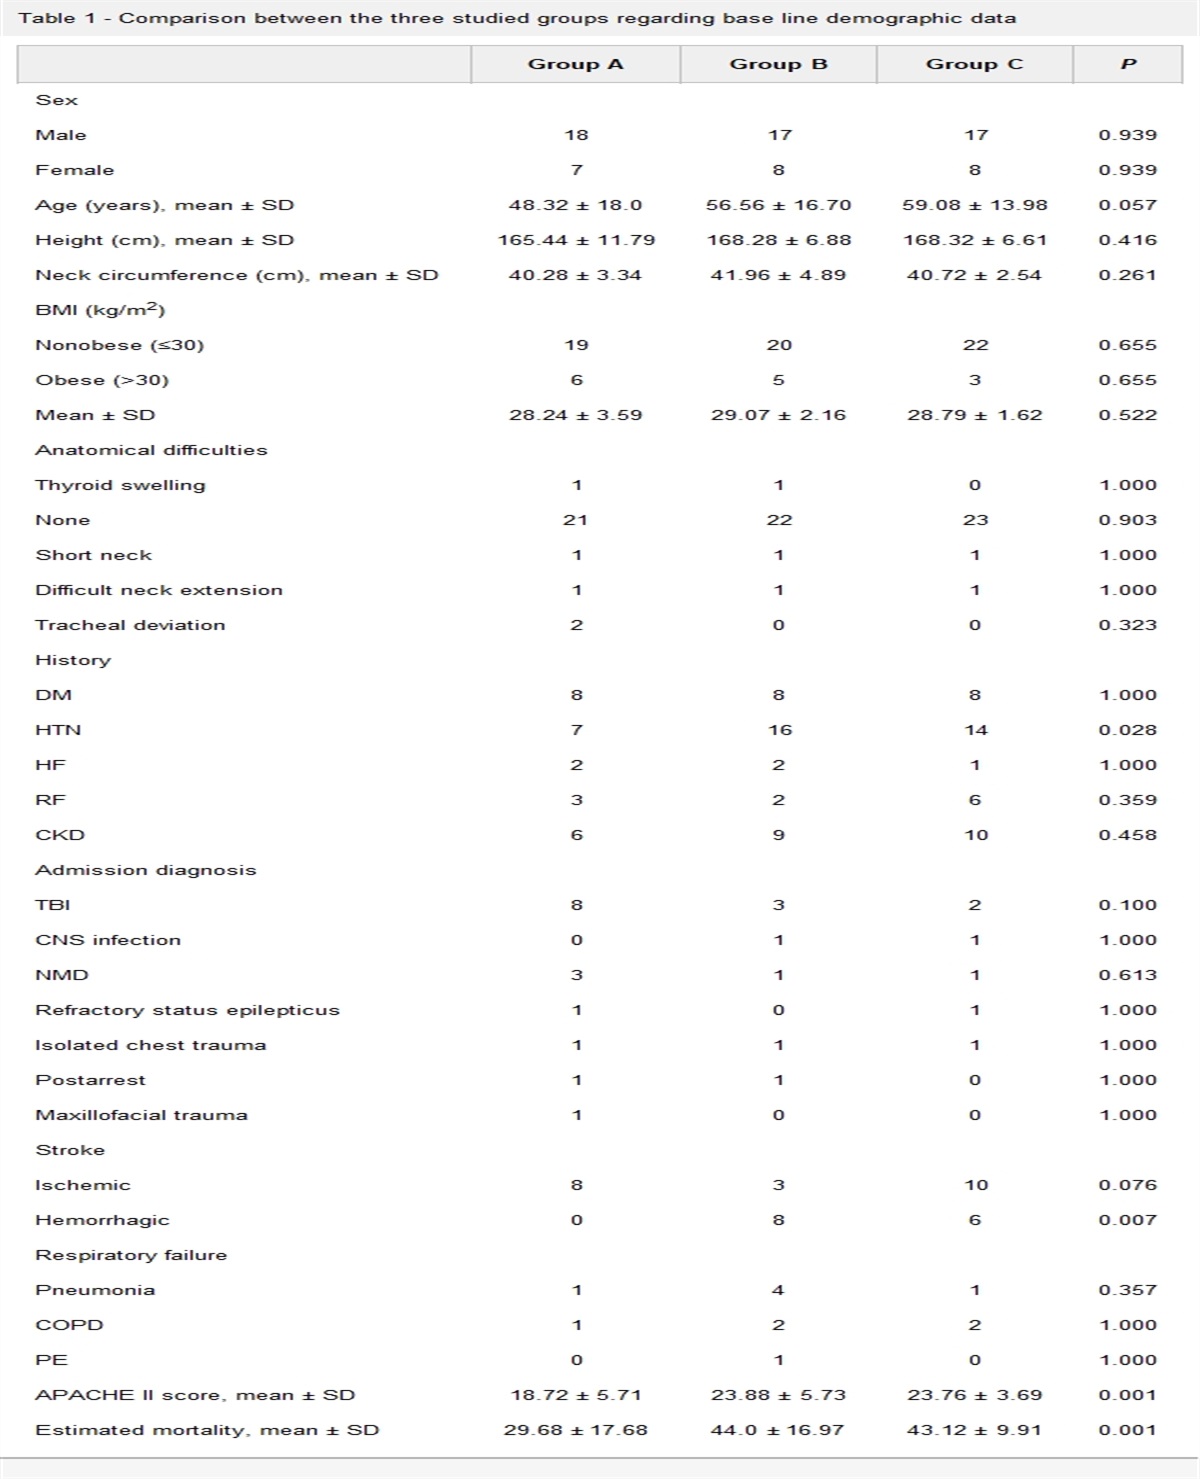
Table 1 - Demographic and clinical data of the whole population Number of patients Percentage Age (yrs) 61.2 ± 12.9 Sex Male 32 64 Comorbidities Diabetes 31 62.0 Hypertension 28 56.0 Smoking 23 46.0 Ischemic heart disease 20 40.0 Renal impairment 22 44.0 Scoring system APACHE II score 21.88 ± 6.1 SOFA score on admission 9.00 ± 3.2 SOFA score after 2 days 8.26 ± 3.2 SOFA score after 4 days 7.64 ± 4.1 Cause of MV COPD 7 14.0 Shock 14 28.0 Pneumonia 13 26.0 Coma 16 32.0 Duration of MV (days) 6.34 ± 2.3 Fluid balance Positive fluid balance 21 42.0 Negative fluid balance 29 58.0 RSBI (cycle/min/L) 58.52 ± 16.4 Lung US score during SBT 12.18 ± 6.65 NT-proBPN during SBT (pg/ml) 658.06 ± 466.3 (125–1680)APACHE, acute physiology and chronic health evaluation; COPD, chronic obstructive pulmonary disease; MV, mechanical ventilation; RSBI, rapid shallow breathing index; SBT, spontaneous breathing trial; SOFA score, sequential organ failure assessment score.
ICU, intensive care unit.
ICU, intensive care unit; IHD, ischemic heart disease; LUS, lung ultrasound score; MV, mechanical ventilation; RSBI, rapid shallow breathing index; SOFA score, sequential organ failure assessment score.
LUS, lung ultrasound score; ROC, receiver operating characteristic.
 Figure 1.:
 ROC curve for lung ultrasound score.
 Figure 2.:
 LUS and length of ICU stay. ICU, intensive care unit.
 Figure 3.:
 LUS and ICU mortality. ICU, intensive care unit.
Those patients with LUS <15.5 showed less length ICU stay (9.88 ± 2.8 vs 13.6 ± 3.3, P = 0.001), less postextubation distress (15.6% vs 83.3%, P < 0.001), and improved SOFA score after 4 days (6.22 ± 3.5 vs 10.2 ± 3.8, P < 0.001), with no difference in mortality (12.2% vs 33.3%, P = 0.138).
4.3. Correlation between lung ultrasound score and ICU stay and mortality (Figures 2 and 3)Lung ultrasound score had a significant positive correlation with ICU stay with the correlation coefficient of 0.475 and P-value of 0.001. Higher lung ultrasound score was associated with increased ICU mortality and prolonged duration of ICU stay.
5. DISCUSSIONWeaning failure is defined as the failure to pass a spontaneous breathing trial or the need for reintubation within 48 hours after extubation.15 Patients who require reintubation have a poor prognosis, with hospital mortality rates exceeding 30%. The need for reintubation is an important independent predictor of mortality even after controlling other comorbid conditions.14
Lung ultrasound determination of aeration changes during a spontaneous breathing trial may accurately predict postextubation distress.9 In this study, we aimed to evaluate the validity of ultrasonographic assessment of the lung aeration (LUS) for prediction of postextubation distress (weaning failure).
5.1. Clinical assessment using APACHE II score and SOFA scoreIn our analysis, APACHE II score was significantly higher in the failed extubation group than the successful extubation group (P-value <0.001).
These results go in hand with those of Lai et al16 and Wu et al17 (P-values 0.023 and <0.001, respectively). In our study, SOFA score on admission and after 2 days was significantly higher in the failed extubation group than the successful extubation group with mean values 11.85 ± 2.64, 11.20 ± 2.04 and 7.10 ± 1.81, 6.30 ± 2.02, respectively, with P-value <0.001.
In agreement with our study, Guru et al(14) in a study for predicting successful extubation in patients with posterior fossa stroke found that SOFA score was higher in the failed extubation group than the successful extubation group with P-value <0.001.
On the other hand, Soumer et al9 showed that no relation between assessment score and post extubation distress. They used different assessment score, SAP II score and APACHE II score, with different sample sizes and different types of patients.
5.2. Duration of mechanical ventilation before extubation and weaning outcomeIn this study, duration of controlled mechanical ventilation in the successful extubation group was less than that in the failed extubation group with the mean value of 4.73 ± 1.11 and 8.75 ± 1.25, respectively (P-value <0.001).
In addition, Ghosh et al18 and Lai et al16 found that the failed extubation group had longer duration of controlled ventilation than the successful extubation group with the P-value of 0.001 and 0.005, respectively.
5.3. Lung ultrasound score and postextubation distressIn our study, lung ultrasound score was a predictor of weaning outcome (postextubation distress) with the sensitivity of 90% and specificity of 75% with a cutoff value of 15.5 (AUC: 0.851; 95% CI: 0.721–0.981). In agreement with our study, Soumer et al9 in a study for prediction of weaning outcome by lung ultrasound score and loss of lung aeration found that lung ultrasound score was sensitive and specific for prediction of weaning outcome and showed that LUS >17 predicts postextubation distress and <12 predicts extubation success.
In addition, Ahmed Osman et al19 in the study for use of lung ultrasound and diaphragmatic ultrasound as predictive indices of weaning outcome found that LUS less than 12 associated with high probability of extubation success and more than 17 associated with high probability of extubation failure and from 12 to 17 associated with intermediate probability for extubation failure. The cutoff value of 12 showed 100% sensitivity and 96% specificity (AUC: 0.942).
In addition, Caihong et al20 in a study for prediction of weaning outcome by using lung ultrasound score in patients intubated with intra-abdominal infection found that lung ultrasound score can predict postextubation distress with a cutoff value of 13.5, the sensitivity was 80.0%, and the specificity was 65.2%. ROC curve analysis showed that the AUC of LUS score before extubation for predicting the failure was 0.81 (95% CI: 0.69–0.92, P = 0.001).
5.4. Relation between post extubation distress and outcomeIn our study, postextubation distress associated with higher mortality than extubation success, 40% and 6.7%, respectively, with P-value <0.001, and also postextubation distress associated with prolonged time of ICU stay than extubation success 14.9 ± 2.07 and 8.77± 1.41, respectively.
In agreement with our study, Lai16 found that postextubation distress associated with higher mortality rate and prolonged duration of ICU stay with P-value <0.005.
In addition, Soumer et al9 found that postextubation distress associated with higher mortality than extubation success, 17.2% and 3.5%, respectively, with P-value <0.04. In addition, postextubation distress associated with prolonged ICU stay than extubation success, P-value <0.0.001.
6. STUDY LIMITATIONS •Small sample size •Single-center study 7. CONCLUSION •Patients with lower lung ultrasound scores showed lower rates of postextubation distress. •Postextubation distress is associated with prolonged ICU stay and higher mortality rate. REFERENCES [1]. Béduneau G, Pham T, Schortgen F, et al. Epidemiology of weaning outcome according to a new definition. The WIND study. Am J Respir Crit Care Med 2017;195(6):772-783. [2]. Caroleo S, Agnello F, Abdallah K, et al. Weaning from mechanical ventilation: an open issue. Minerva Anestesiol 2007;73(7/8):417. [3]. Bruni A, Garofalo E, Pelaia C, et al. Patient-ventilator asynchrony in adult critically ill patients. Minerva Anestesiol 2019;85(6):676-688. [4]. Thille AW, Cortés-Puch I, Esteban A. Weaning from the ventilator and extubation in ICU. Curr Opin Crit Care 2013;19(1):57-64. [5]. Peñuelas O, Frutos-Vivar F, Fernández C, et al. Characteristics and outcomes of ventilated patients according to time to liberation from mechanical ventilation. Am J Respir Crit Care Med 2011;184(4):430-437. [6]. Girard TD, Alhazzani W, Kress JP, et al. An official American Thoracic Society/American College of Chest Physicians clinical practice guideline: liberation from mechanical ventilation in critically ill adults. Rehabilitation protocols, ventilator liberation protocols, and cuff leak tests. Am J Respir Crit Care Med 2017;195(1):120-133. [7]. Frutos-Vivar F, Ferguson ND, Esteban A, et al. Risk factors for extubation failure in patients following a successful spontaneous breathing trial. Chest 2006;130(6):1664-1671. [8]. Thille AW, Richard JCM, Brochard L. The decision to extubate in the intensive care unit. Am J Respir Crit Care Med 2013;187(12):1294-1302. [9]. Soummer A, Perbet S, Brisson H, et al. Ultrasound assessment of lung aeration loss during a successful weaning trial predicts postextubation distress. Crit Care Med 2012;40(7):2064-2072. [10]. Knaus WA, Draper EA, Wagner DP, Zimmerman JE. APACHE II: a severity of disease classification system. Crit Care Med 1985;13(10):818-829. [11]. Ferreira FL, Bota DP, Bross A, Mélot C, Vincent JL Serial evaluation of the SOFA score to predict outcome in critically ill patients. Jama 2001;286(14):1754-1758. [12]. Saenger AK, Rodriguez-Fraga O, Ler R, et al. Specificity of B-type natriuretic peptide assays: cross-reactivity with different BNP, NT-proBNP, and proBNP peptides. Clin Chem 2017;63(1):351–358. [13]. Rouby JJ, Arbelot C, Gao Y, et al. Training for lung ultrasound score measurement in critically ill patients. Am J Respir Crit Care Med 2018;198(3):398-401. [14]. Guru PK, Singh TD, Pedavally S, Rabinstein AA, Hocker S. Predictors of extubation success in patients with posterior fossa strokes. Neurocrit Care 2016;25(1):117-127. [15]. Glover S, Glossop A. Managing extubation and the post extubation period in the intensive care unit. EMJ Respiratory 2017;5:85-91. [16]. Lai CC, Chen CM, Chiang SR, et al. Establishing predictors for successfully planned endotracheal extubation. Medicine (Baltimore) 2016;95:e4852. [17]. Wu YK, Kao KC, Hsu KH, Hsieh MJ, Tsai YH Predictors of successful weaning from prolonged mechanical ventilation in Taiwan. Respir Med 2009;103(8):1189-1195. [18]. Ghosh S, Chawla A, Mishra K, Jhalani R, Salhotra R, Singh A Cumulative fluid balance and outcome of extubation: a prospective observational study from a general intensive care unit. Indian J Criti Care Med 2018;22(11):767-772. [19]. Osman AM, Hashim RM. Diaphragmatic and lung ultrasound application as new predictive indices for the weaning process in ICU patients. Egyptian J Radiol Nucl Med 2017;48(1):61-66. [20]. Gu C, Xie Y, Zheng T, Ren H, Wang G, Ren J. Predictive value of lung ultrasound score on weaning outcome in patients with intro-abdominal infection undergoing mechanical ventilation. Zhonghua Wei Zhong Bing Ji Jiu Yi Xue 2020;32(1):94-98.
留言 (0)