Study design
Patients were included in this prospective, observational study conducted from March 2023 to January 2024 at the Department of Critical Care Medicine of Union Hospital, Tongji Medical College, Huazhong University of Science and Technology, Wuhan, China. The study was approved by the Institutional Research and Ethics Committee of Union Hospital (No. 2022-0851). Written informed consents were obtained from the patients’ legal representatives. The study was registered before enrollment at Clinicaltrials.gov (NCT05778292).
Patients
The inclusion criteria were patients on VV ECMO for severe respiratory failure, endotracheal mechanical ventilation, and age ≥ 18 and ≤ 70 years. The exclusion criteria included contraindications to EIT (e.g., chest surgical wounds dressing or presence of pacemaker); refractory shock; severe cardiac dysfunction; moderate or massive pleural effusion; pulmonary embolism; severe chronic cardiopulmonary disease; body mass index > 35 kg/m2; and blood sodium concentration < 130 or > 145 mmol/l.
Study protocol
Patients who met the weaning criteria according to the Extracorporeal Life Support Organization Guidelines for VV ECMO were enrolled if they fulfilled the inclusion and exclusion criteria [10]. The weaning criteria included oxygenation capacity, ventilatory reserve, PaO2 buffer, and response to an off-sweep gas challenge [10]. Pre-membrane blood gas analyses were performed after turning off the ECMO sweep gas for 2–3 h.
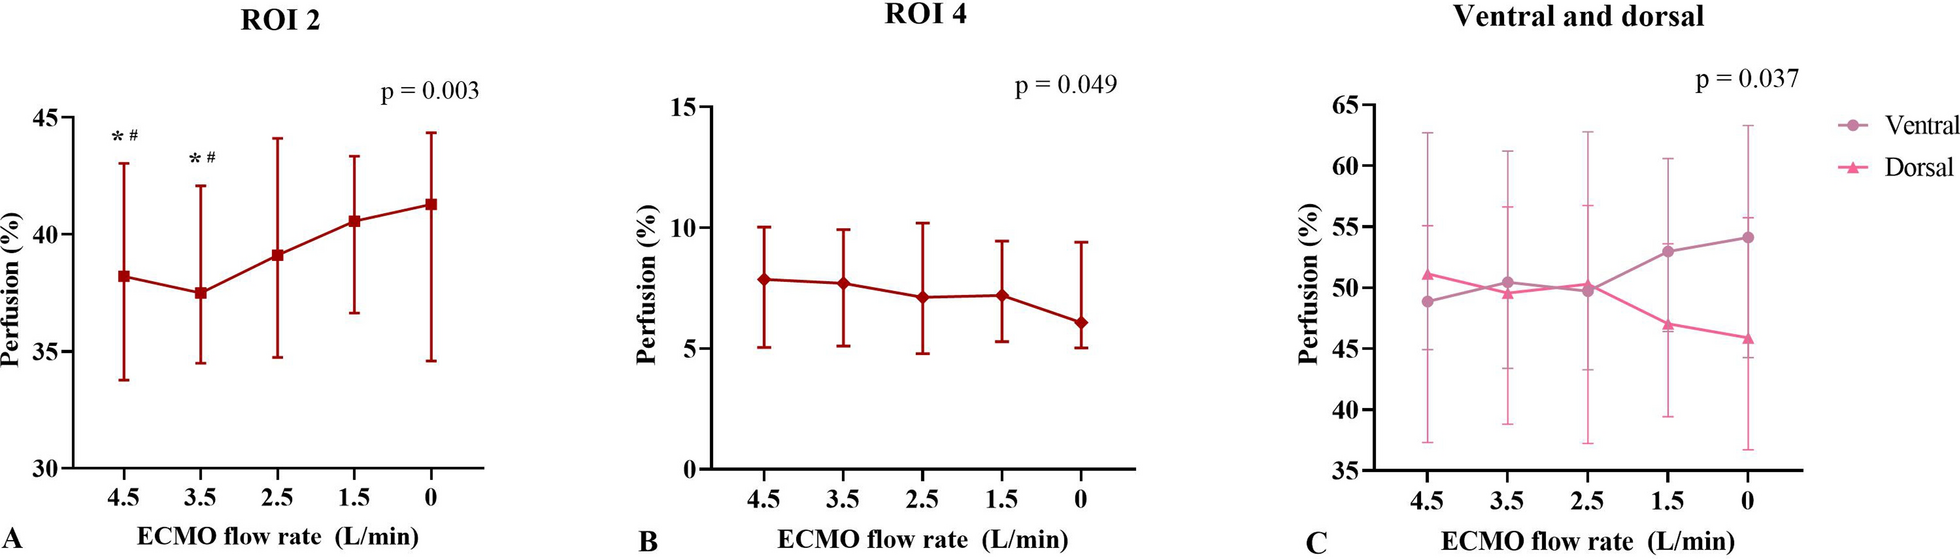
Patients were deeply sedated and paralyzed, undergoing controlled mechanical ventilation during the trial period. Before reducing ECMO blood flow, the ECMO gas flow rate was set to 2 L/min and the fraction of oxygen delivered by ECMO to 1.0. The ECMO blood flow rate was then gradually decreased from 4.5 L/min to 3.5 L/min, 2.5 L/min, 1.5 L/min, and finally to 0 L/min (by briefly clamping the ECMO blood flow circuit for saline injection), with approximately 30-min intervals between each step (Additional file 1: Fig. S1). Adjust the fraction of inspired oxygen delivered by the ventilator, without modifying other ventilator parameters, to maintain a pulse oxygen saturation of at least 97% at each ECMO blood flow rate. Data, including EIT measurements, pre- and post-membrane blood gas analyses, vital signs, and blood sodium concentrations, were collected at each ECMO blood flow step.
EIT functional images and data (detailed procedures refer to Additional file 1) were generated using the PulmoVista 500 (Dräger Medical, Lübeck, Germany). After collecting baseline data for 2 min with EIT, an end-expiratory breath hold was performed. Two seconds post-occlusion, a 10 ml bolus of 5% NaCl solution was rapidly injected within 2 s through the central venous catheter. Ventilated and perfused regions were defined as pixels exceeding 10% of the maximum on the functional ventilation and perfusion maps, respectively. For quantitative analysis, the lungs were sub-segmented into ventral and dorsal regions, defined from ventral to dorsal as region-of-interest (ROI) 1, ROI 2, ROI 3, and ROI 4.
The recirculation fraction within the ECMO circuit was estimated using the SvO2 method [8] (Additional file 1).
Study outcomes
The primary outcome was regional perfusion distribution at each ECMO blood flow rate. The secondary outcomes included ventilation/perfusion (V/Q) matching, dead space, shunt, and recirculation fraction at each ECMO blood flow rate.
Statistical analysis
A formal sample size calculation was not performed and, similar to prior physiological research, 15 patients were enrolled [2, 3, 11, 12]. Categorical data were summarized as frequencies and proportions. Continuous data were presented as medians (25–75th) or means ± standard deviations according to the normality of data checked by the Shapiro–Wilk test. To compare the data obtained at each ECMO blood flow rate, either repeated measures ANOVA or the Friedman test was used, with subsequent post-hoc Bonferroni’s or Dunn’s multiple comparisons applied as appropriate. Nonparametric Spearman correlation analysis was employed to assess the correlation between various ECMO flow rates and recirculation fractions. A two-tailed p value of less than 0.05 was considered statistically significant. Statistical analyses were computed with GraphPad Prism 9.0 (GraphPad Software, San Diego, CA, USA).

留言 (0)