
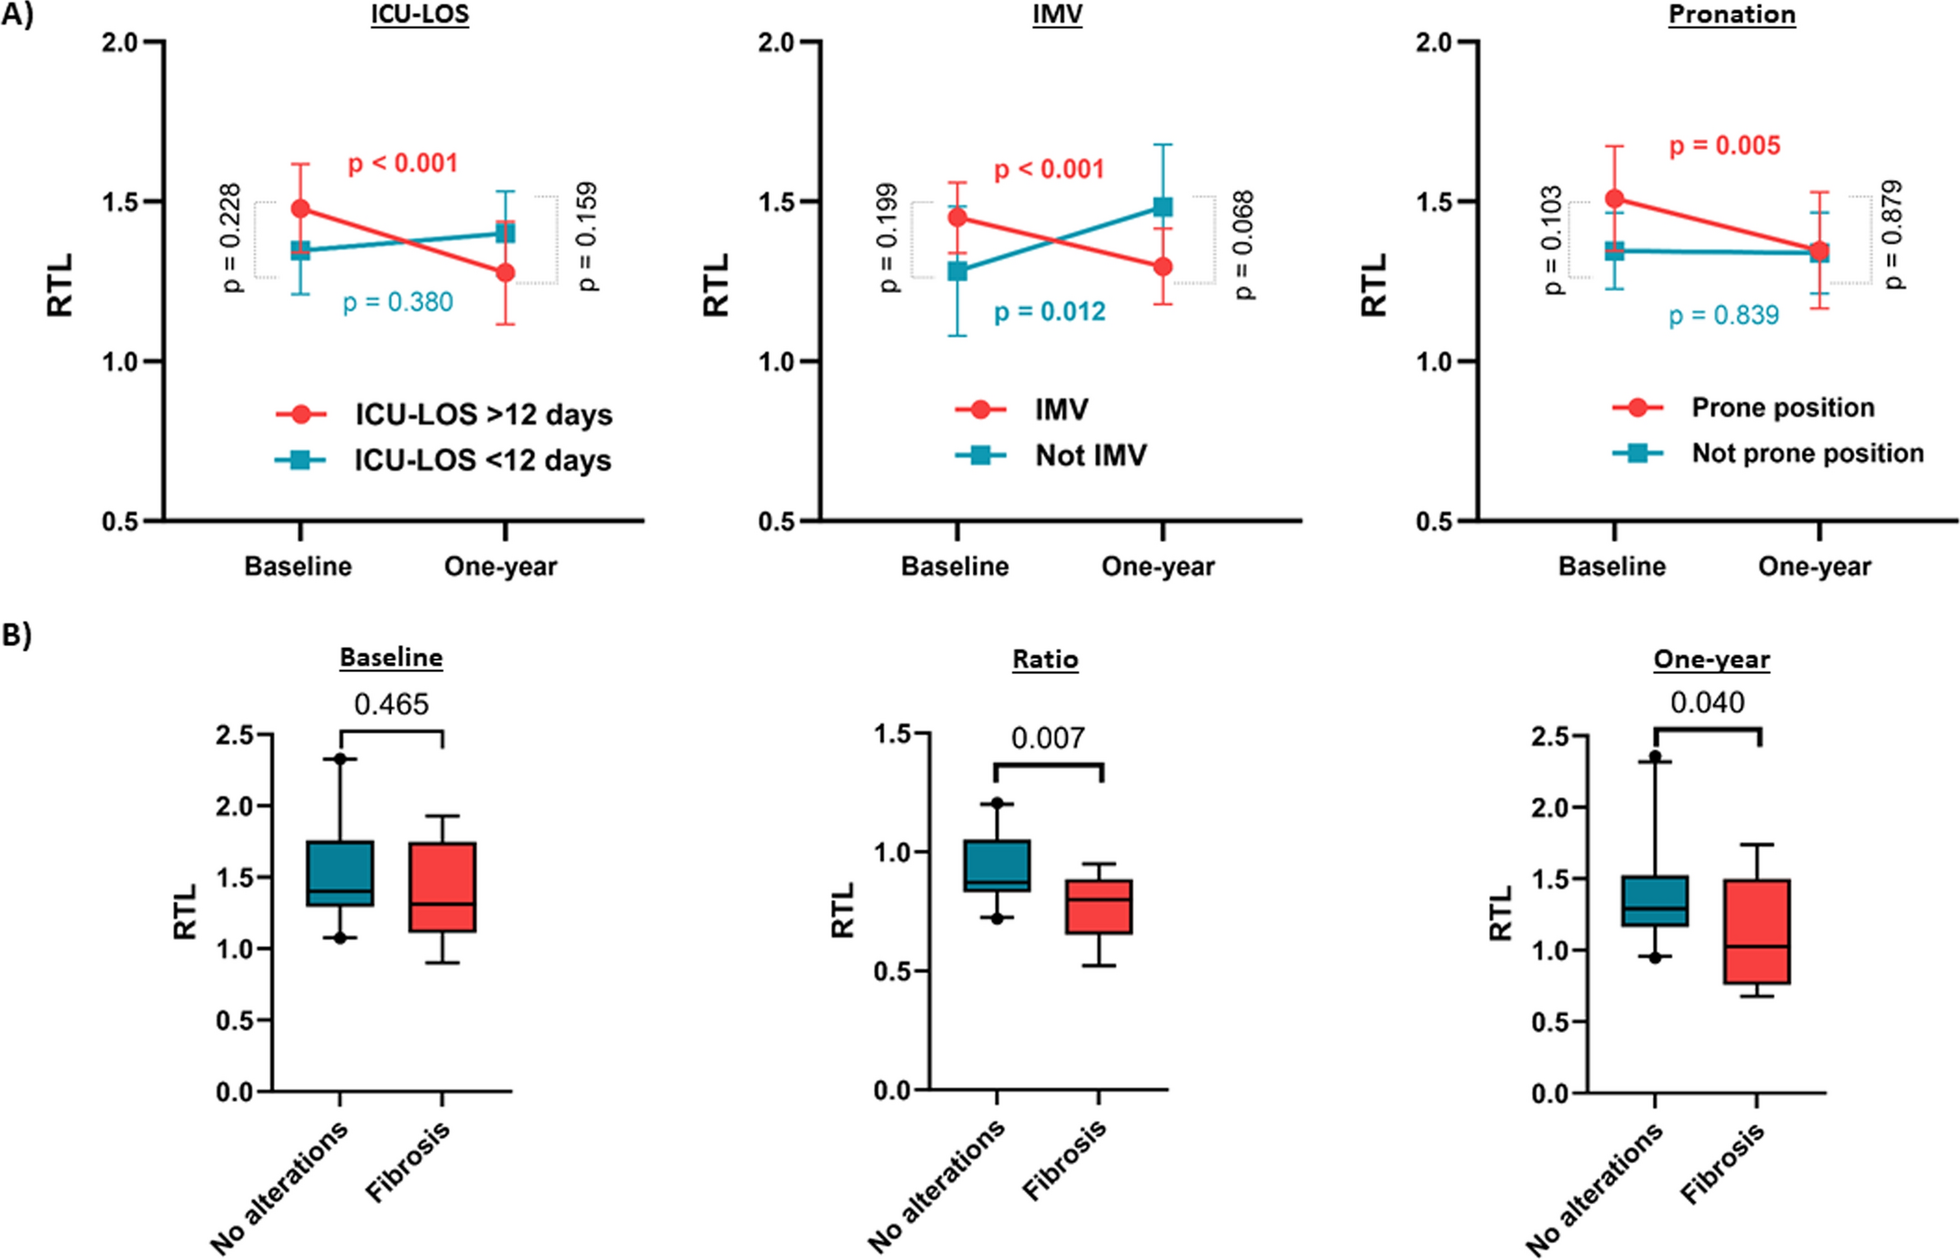
記住我
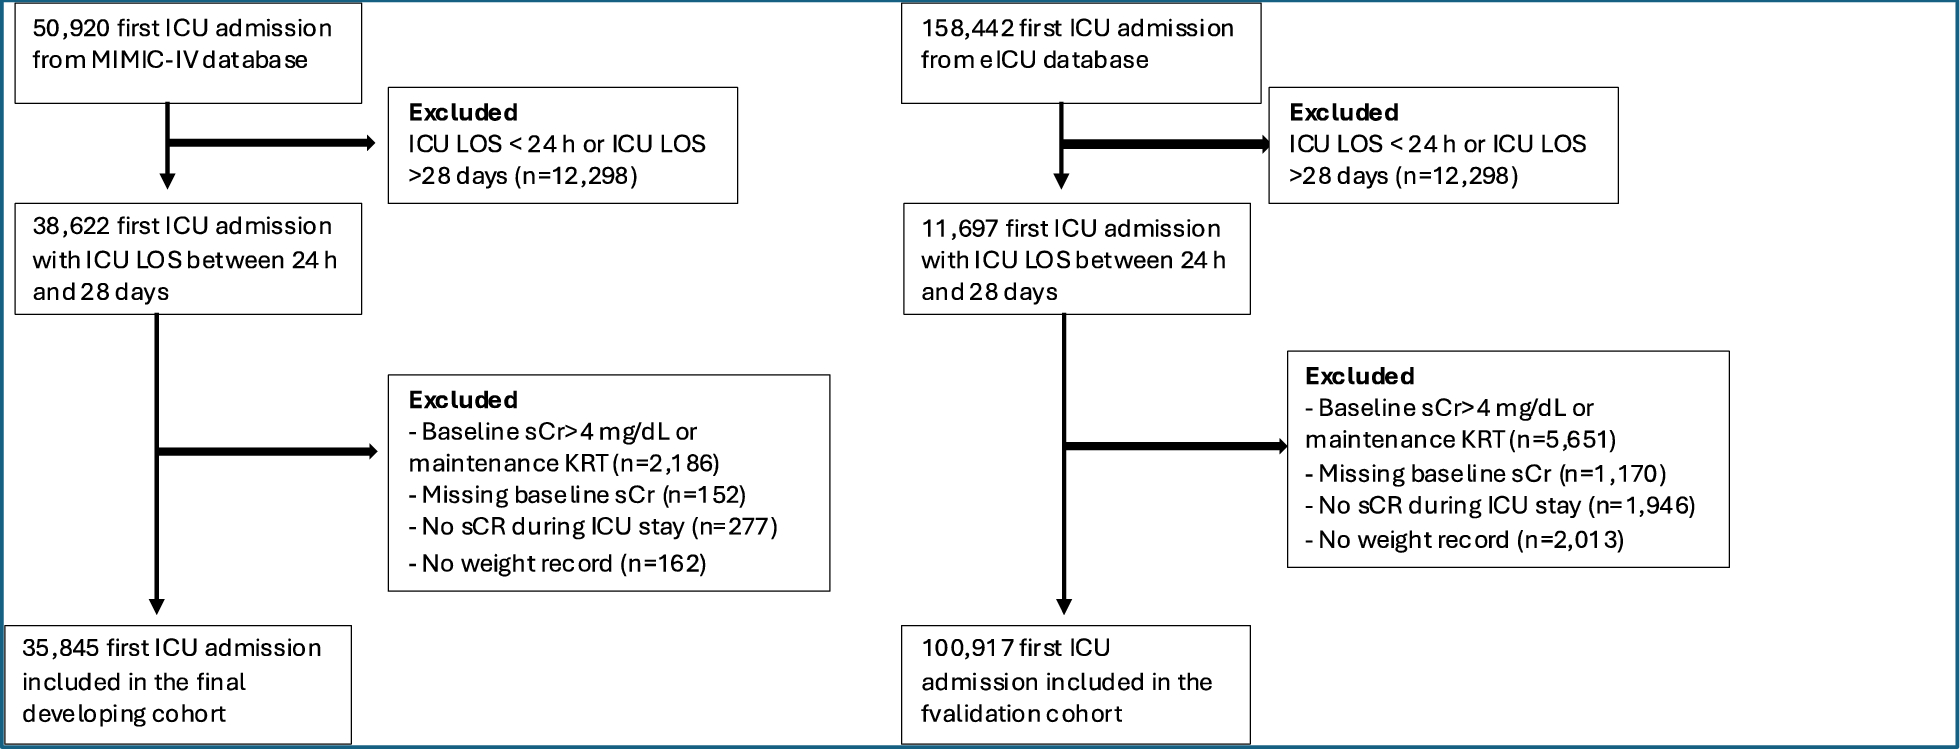
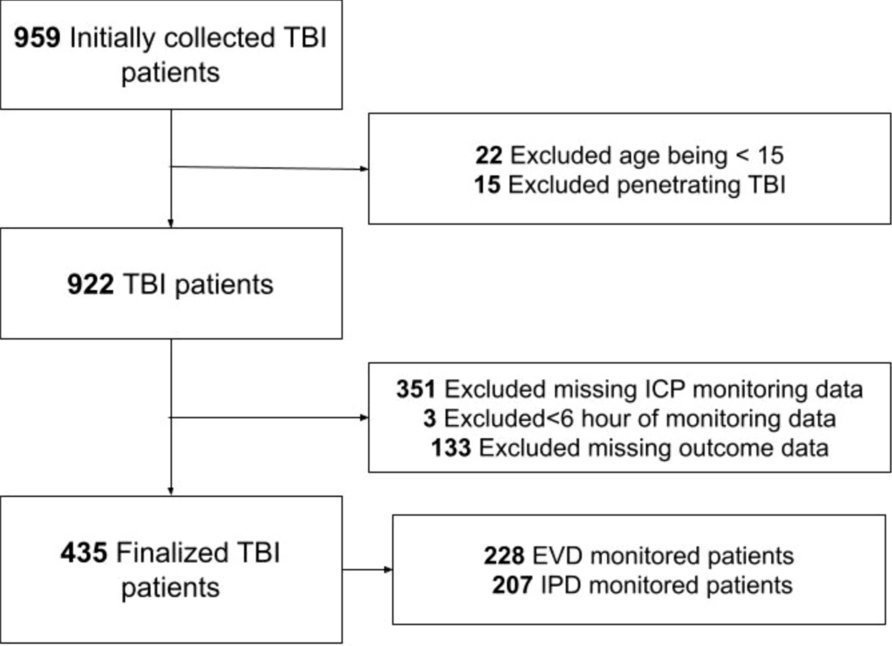
According to the MIMIC-IV, 50,920 adult patients were admitted to the ICU, and 38,622 had an ICU LOS between 24 h and 28 days. A total of 2,186 patients were excluded because their baseline sCr was greater than or equal to 4 mg/dL or because they were undergoing maintenance KRT; 152 patients had missing baseline sCr; 277 patients had no sCr measurements during their ICU stay; and 162 patients had no weight records. Overall, 35,845 patients remained in the derivation cohort. A flowchart of the inclusion and exclusion criteria for patients from the derivation and validation cohorts is shown in Fig. 1.
Fig. 1
Participant flow charts for the MIMIC- IV and eICU cohorts. Abbreviations: ICU: intensive care unit; LOS: length of stay; KRT: kidney replacement therapyve; sCr: serum creatinine; eICU:eICU Collaborative Research Database; MIMIC-IV: Medical Information Mart for Intensive Care IV
The demographic and clinical characteristics of the patients in the derivation cohort according to in-hospital mortality are presented in Table 1. A total of 20,195 patients (56.2%) were male, and the mean age at ICU admission was 65.0 ± 16.9 years. The median nonrenal SOFA score during the ICU stay was 4 [IQR, 2–6], and the median LOS in the ICU was 2.2 [1.5–4.1] days. The hospital mortality rate was 9.3%. Most patients (n = 29,109; 81.2%) used an indwelling urinary catheter, and 2.7% (n = 942) used another device for urine collection during their ICU stay. Moreover, 91.9% of all UO measurement recordings were from a urinary device. The demographic and clinical characteristics of the patients in the validation cohort (eICU database) are shown in Additional file 1: Table S1.
Table 1 Patient demographics and characteristics at the first 28 days of ICU stay or up to kidney replacement therapy initiation from the developing cohort–MIMIC-IV databaseUrine output as a predictor of hospital mortalityWe evaluated the ability of the lowest urine output (UO) to predict hospital mortality using time frames of 3, 6, 12, and 24 h. All time frames demonstrated good discriminatory capacity except for the 24-h time frame. The area under the receiver operating characteristic curve (AUC-ROC) values were 0.75 [0.74–0.76], 0.75 [0.74–0.76], 0.73 [0.72–0.74], and 0.69 [0.68–0.70] for the 3-h, 6-h, 12-h, and 24-h time frames, respectively.
Defining categorical UO classification according to the time frame to compose a unified proposed UO-AKI classificationAfter constructing AUC-ROC curves for each UO time frame, we selected three cutoff points from each time frame using the Youden index. The AUC‒ROC curves comparing UO as a continuous variable or as a categorical variable for each time frame were very similar, with minimal loss of discriminatory capacity (see Additional file 2: Table S2).
We compared the Youden index of each time frame according to the UO cutoff stage. As shown in Table 2, the 6-h time window had the best combined sensitivity and specificity across all stages. Notably, the Youden indices for Stages 2 and 3 were similar for the 3-h and 6-h time frames. For simplicity (as stage 1 for the 6-h time frame had a better Youden index than other time frames) and because a 6-h time window is the most practical in the daily practice of most ICUs, we chose the 6-h time frame values to compose our proposed UO-AKI classification: Stage 1: 0.2–0.3 mL/kg/h; Stage 2: 0.1–0.2 mL/kg/h; and Stage 3: < 0.1 mL/kg/h over 6 h. According to this classification, the incidence of UO-AKI was 49.0%, and the great majority of these patients (89.8%) had UO measured by any device. The distribution of patients according to the proposed UO-AKI stage is shown in Additional file 3: Table S3–average method.
Table 2 Sensitivity, specificity, and Youden index of selected cutoff points according to stage severity for each time frameAverage or persistent UO reductionBefore comparing our proposed UO-AKI classification with the current KDIGO classification, we evaluated whether a classification based on persistently reduced hourly UO over consecutive 6 h is superior to the average method using the same UO thresholds. As expected, the persistent method resulted in a lower diagnosis rate of UO-AKI at each stage than did the average method (see Additional file 3: Table S3). However, the average method demonstrated better discriminatory capacity than the persistent method (AUC-ROC 0.74, 95% CI 0.73–0.75 vs. 0.70, 95% CI 0.69–0.71; see Additional file 8: Fig. S1). From this point onward, the proposed UO-AKI classification utilizes the average method within a 6-h time frame.
The proposed UO-AKI classification is independently associated with increased hospital mortality in a stepwise patternAccording to the univariate analysis, the proposed UO-AKI classification was associated with in-hospital mortality, showing a stepwise increase in the odds ratio with advancing UO-AKI stage (see Additional file 4: Table S4). After adjusting for age, sex, baseline serum creatinine (sCr) level, Charlson Comorbidity Index, ICU admission type, worst nonrenal SOFA score, and the need for KRT, the associations remained significant, with a stepwise increase in the odds ratio (Fig. 2).
Fig. 2
Adjusted odds ratio for hospital mortality per acute kidney injury (AKI) severity stage according to proposed and Kidney Disease: Improving Global Outcomes (KDIGO) urinary output (UO) or UO/serum creatinine (sCr) criteria. The association between AKI severity and in-hospital mortality was explored with a multivariate logistic regression model. The variables included in the model were age, sex, baseline serum creatinine (sCr) level, Charlson Comorbidity Index, type of ICU admission, worst nonrenal SOFA score, and the need for KRT
Proposed UO-AKI classification vs. KDIGO UO-AKI classificationCompared to the KDIGO UO-AKI criteria, the proposed UO-AKI criteria demonstrated a greater discriminatory capacity for predicting hospital mortality (Fig. 3a). Additionally, we evaluated the different UO-AKI staging criteria using the NRI. The proposed UO-AKI criteria showed a total NRI of 26.4% (95% CI: 24.5–28.9) compared to the KDIGO UO-AKI criteria (see Table 3). Furthermore, 4.1% (95% CI: 3.7–4.6) of patients were positive for IDI, indicating that the proposed UO-AKI classification was superior.
Fig. 3
Area under the curve-receiver operating characteristic (AUC-ROC) curve for the a Proposed and KDIGO UO-AKI criteria and b Proposed and KDIGO UO/sCr-AKI criteria. The AUC-ROC curve was used to predict hospital mortality in the developing (MIMIC-IV database) cohort
Table 3 Acute kidney injury incidence using the proposed and KDIGO criteria based on urine output (UO) only (table a) and UO/serum creatinine (sCr)—AKI criteria (table b) and net reclassification according to hospital mortality. Gray indicates patients who were correctly reclassified and blue those who were incorrectly reclassifiedsCr criteria combined with the proposed UO-AKI classificationWe utilized the proposed UO stages to establish a UO/sCr-AKI classification, employing the same sCr increment cutoffs recommended by KDIGO. Table 4 compares these proposed criteria with the complete KDIGO criteria. While we observed a stepwise increase in the odds ratio with advancing UO/sCr-AKI classification, KDIGO UO/sCR-AKI stage 1 did not show an independent association with hospital mortality (Fig. 2). Compared with the KDIGO UO/sCr-AKI criteria, the proposed UO/sCr-AKI criteria demonstrated superior discriminatory capacity for predicting hospital mortality (Fig. 3b). Additionally, the proposed classification showed a positive NRI of 25.4% (95% CI: 23.3–27.6) and an IDI of 4.0% (95% CI: 3.6–4.5). Additional file 5: Table S5 displays patients according to UO or sCr criteria according to the proposed AKI criteria. The agreement between both UO and sCr was 50.2%.
Table 4 Proposed and Kidney Disease Improving Global Outcomes (KDIGO) classification for acute kidney injury (AKI)Kidney-centered outcomesWe compared the proposed UO or UO/sCr-AKI criteria against the corresponding KDIGO criteria with respect to kidney-centered outcomes. The UO-AKI criteria were used to assess performance in predicting progression to stage 2/3 sCr-AKI (excluding the need for KRT) and stage 3 sCr-AKI, including KRT. Additionally, the proposed UO/sCr-AKI criteria and the KDIGO criteria were compared regarding the need for isolated KRT. Table 5 presents the AUC-ROC, NRI, and IDI for each outcome. In all comparisons, the proposed criteria outperformed the KDIGO criteria.
Table 5 Area under the receiver operating characteristic curve (AUC-ROC), net reclassification improvement (NRI) and integrated discrimination improvement (IDI) for both criteria for kidney-centered outcomesAdditional analysisWe performed a sensitivity analysis based on the use of loop diuretics during the study period and baseline renal function (eGFR < 60 ml/min/1.73 m2 or > 60 ml/min/1.73 m2). The AUC-ROC, NRI, and IDI values are shown in Additional file 6: Table S6. According to all sensitivity analyses, the proposed UO/sCr-AKI classification was superior to the KDIGO classification.
Additionally, we performed a Cox regression analysis, adjusting for age, sex, baseline serum creatinine (sCr) level, Charlson Comorbidity Index, ICU admission type, worst nonrenal SOFA score, and the need for KRT, to evaluate the association of both criteria with 90-day mortality. There was separation among the four groups according to the proposed UO/sCr-AKI criteria; however, according to the KDIGO UO/sCr-AKI criteria, patients with no AKI and those with stage 1 AKI were not significantly different (P = 0.60) (see Additional file 9: Fig. S2a and S2b).
External validationThe eICU database (n = 72,141) was utilized to externally validate the proposed UO/sCr-AKI classifications. According to the univariate analysis, after adjusting for age, sex, baseline eGFR, comorbidities, ICU severity score (APACHE-IV), and type of ICU admission, there was a significant stepwise increase in the OR for hospital mortality according to the proposed UO-AKI classification (see Additional file 7: Table S7). The proposed criteria showed a progressive increase in OR across all AKI stages, a pattern not observed with the KDIGO criteria. Additionally, the proposed classification system demonstrated a superior AUC-ROC curve (0.70, 95% CI 0.69–0.70 vs. 0.62, 95% CI 0.61–0.63; Fig. 4). The NRI was 17.2% (95% CI 15.5–18.8), and the IDI was 3.1% (95% CI 2.7–3.5).
Fig. 4
Area under the curve-receiver operating characteristic (AUC-ROC) curve for the proposed and KDIGO UO/sCr-AKI criteria. The AUC-ROC curve was used to predict in-hospital mortality in the validation (eICU database) cohort
留言 (0)