Ethical consideration and data acquisition
The study was performed under the Declaration of Helsinki and in agreement with the Italian good clinical practice recommendations (D.M. Sanità del 15/07/97 e s.m.i.) and with the applied healthcare hospital protocols. No change of current clinical practice or clinical protocols in use were taken in place in the enrolled study population. Considering the retrospective nature of the proposed study, we did not anticipate risks nor benefits that might be added to the patients. Moreover, in the presence of technical difficulties related to the emergency health context to obtain an informed consent from patients in that period of pandemic, informed consent was waived. For this reason and for the great public interest of the project, the research was conducted in the context of the authorizations guaranteed by Article 89 of the GDPR EU Regulation 2016/679, which guarantees the treatment for purposes of public interest, scientific or historical research or for statistical purposes of health data. Personal data were handled in compliance with the European Regulation on the Protection of Personal Data (GDPR), the Legislative Decree 196/2003 and subsequent amendments and additions, and any other Italian law applicable to the protection of personal data (henceforth referred to as the “applicable data protection law”). Data were collected in a pseudo-anonymous way through paper case report forms, digitalized on a University of Milano-Bicocca Institutional Google drive account and analyzed by the scientific coordinator of the project (E.R.). Favorable judgment for the execution of the study was obtained before data acquisition from the local institutional review board of the coordinating center Fondazione IRCCS San Gerardo dei Tintori, Monza, Italy (Approval date: 24/04/2020; number 3375) and from the local institutional review board of each enrolled center (Policlinico San Marco, Gruppo Ospedaliero San Donato, Zingonia, Bergamo, Italy; Ospedale Infermi, Rimini, Italy; Ospedale Papa Giovanni XXIII, Bergamo, Italy; Ospedale Alessandro Manzoni, Lecco, Italy; Arcispedale Sant’Anna, Ferrara, Italy; Ospedale Santa Maria delle Stelle, Melzo, Italy; Istituto Sicureza Sociale, Repubblica di San Marino).
Baseline characteristics (age, sex, body mass index, comorbidities) and clinical illness severity (Sequential Organ Failure Assessment (SOFA) and pH) were collected, together with laboratory biomarkers, blood gas analysis, respiratory assistance, and hemodynamic data at hospital admission. Lung CT scans acquired for clinical purposes within the first week since hospital admission were obtained. Data on drug treatments and complications during hospital admissions, outcomes including length of stay (in ICU and in hospital), use of non-invasive respiratory support, mechanical ventilation-free days, limitation of life sustaining measures, ICU mortality, and hospital mortality were recorded.
Inclusion and exclusion criteria
Inclusion criteria:
1.
patients ≥ 18 years;
2.
positive confirmation of SARS-CoV-2 infection with nucleic acid amplification test or serology of SARS-CoV2 by nasopharyngeal swab, broncho-aspirate sample or bronchoalveolar lavage;
3.
lung CT scan performed within 7 days since hospital admission.
Exclusion criteria:
1.
Patients undergoing mechanical ventilation during CT acquisition;
2.
Patients with incomplete data to develop the LCA model using clinical, biological and CT data.
For the current analysis we included patients who were admitted to the Emergency Department with a clinical diagnosis of COVID-19 respiratory failure.
Chest CT quantification
The lung CT scan images were collected and anonymized and then sent by the University of Milano-Bicocca Institutional Google drive account to the University of Pennsylvania, Department of Anesthesiology and Critical Care and the Department of Radiology (M.C., Y.X., S.G., J.H.) in a de-identified format for advanced quantitative analysis taking advantage of artificial intelligence using deep learning algorithms [14]. CT images were segmented using an established convolutional neural network (CNN) previously validated [12]. The masks included vasculature and airways inside the lungs, but excluded major airways (e.g., trachea) and vessels outside the lung lobes in the hilum area. Therefore, the role of CNN allowed to provide automated segmentations of each lung into 15 regions-of-interest (ROI) for the subsequent analysis as follows:
whole lung;
five individual lobes (left upper lobe (LUL), left lower lobe (LLL), right upper lobe (RUL), right middle lobe (RML), and right lower lobe (RLL));
the analysis by the 3 axes of space (i.e. X, Y and Z) that were three equally sized (by pixel counts) including horizontal ventral-to-dorsal regions (Ventral; Dorso-Ventral; Dorsal), vertical apical-to-basal regions (Apical; Basal–Apical; Basal), and three concentric submantellar-to-hilar regions (Submantellar; Central; Hilar) [15]. After segmentation, whole-lung and lobar lung masks were inspected by a trained investigator (Y.X.), and manually adjusted using ITK-snap software [16]. For each ROI, six parameters were analyzed [17, 18]:
average CT density in Hounsfield Units (HU);
lung gas volume by density analysis;
lung weight by density analysis;
percentage of consolidated tissue (CT density > − 200 HU);
percentage of ground glass opacity (GGO) (− 200 HU > CT density > − 750 HU); and
percentage of total injury.
In sum, a total of ninety lung features were calculated for each patient, consisting of six parameters for each of fifteen regions. We calculated the gravitational (ventro-dorsal), the apical–basal, and the submantellar–hilar lung density gradients by linear fitting density, percentage of GGO, and percentage of consolidation in three corresponding regions. The slope of this linear fit was compared between latent classes.
Latent class analysis
Latent class analysis (LCA) is a well-established statistical technique that employs mixture modeling to identify the most appropriate model for a data set, based on the premise that the data encompasses several unobserved groups or classes. Unlike traditional regression analyses, which aim to delineate the relationship between pre-defined independent variables and a specified outcome, LCA identifies potential subgroups within the data based on combinations of baseline variables, without necessarily linking them to an outcome.
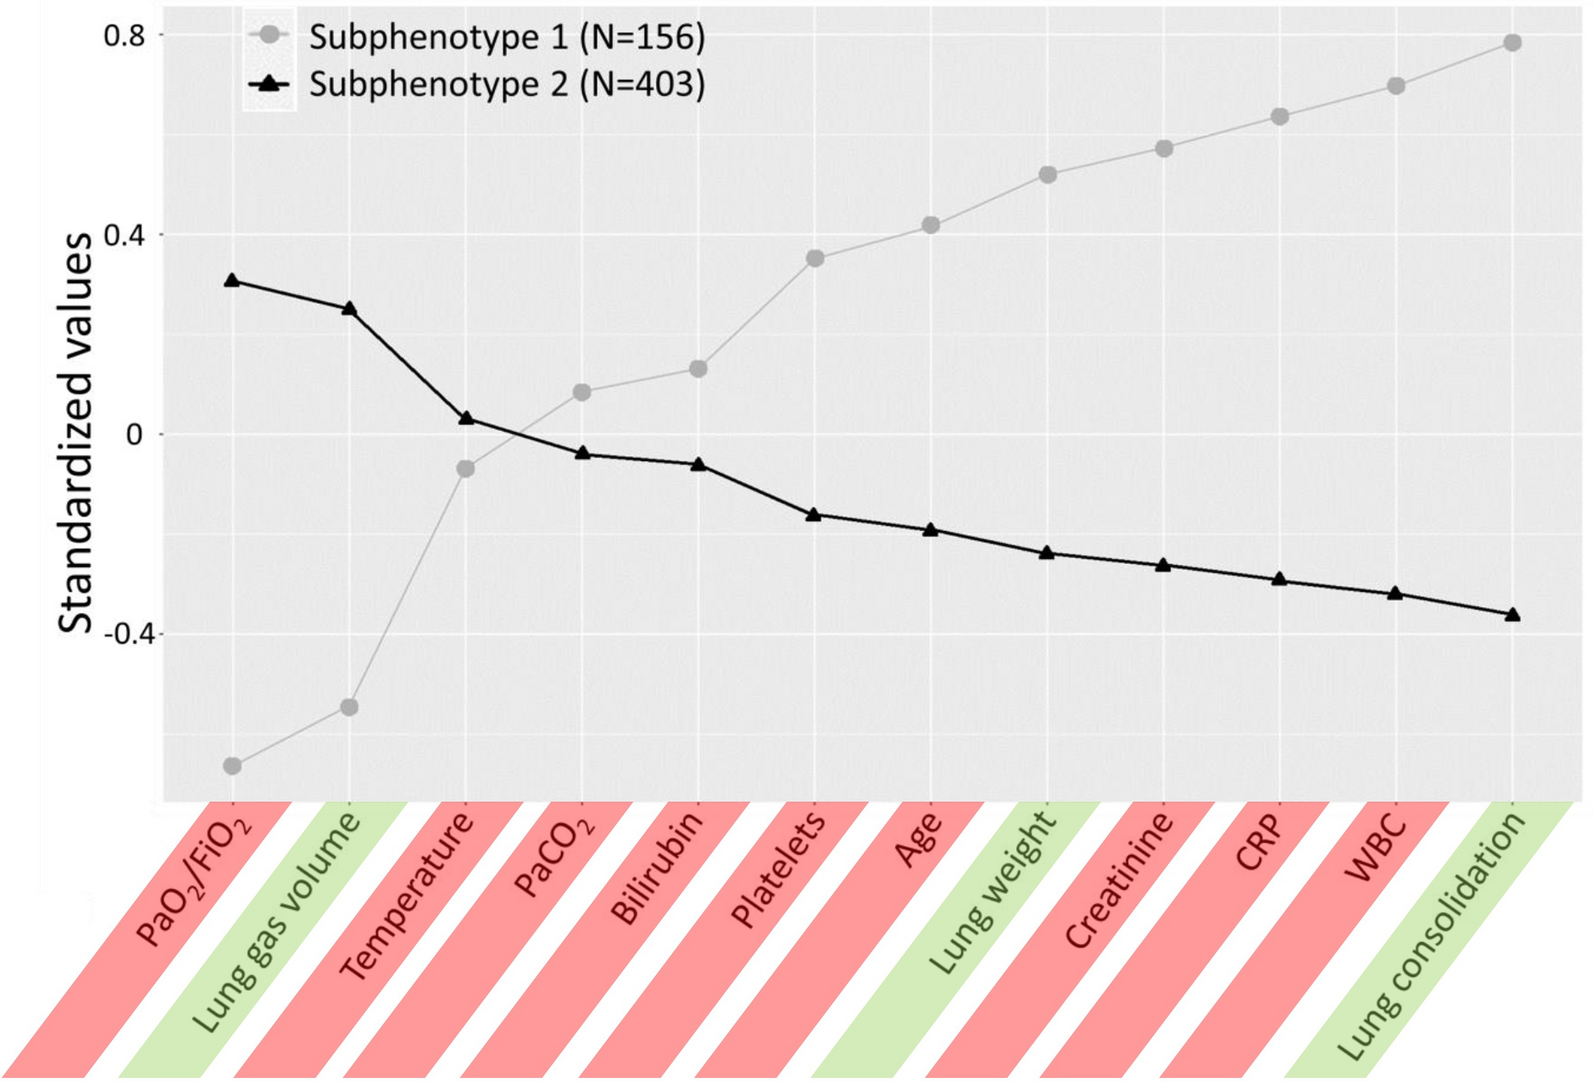
We implemented LCA following the methodological guidelines to LCA as described by Sinha et al. [19], by amalgamating mixed clinical, laboratory, and CT data. Decision on the variables included (n = 15) in the LCA model was based on clinical illness severity at hospital admission and on previously published work [8, 20]. High correlation was explored, and the correlation matrix was plotted in online supplemental Fig. 1. The absolute value of correlations between five pairs was greater than 0.7 [(HCO3−, PaCO2), (Lung gas volume, GGO), (Lung gas volume, Mean lung HU), (GGO, Mean lung HU), (Consolidation, Mean lung HU)], indicating strong correlations. Therefore, mean lung HU, GGO (proportion of ground glass opacities) and HCO3− were removed to avoid high correlation. From 559 samples, the final 12 variables (i.e. PaO2/FiO2, Lung gas volume, Temperature, PaCO2, Total Bilirubin, Platelets, Age, Lung mass, Creatinine, hs-CRP, WBC, Consolidation fraction) were included in the LCA model with different numbers of classes and specifications of covariance matrix structures. Depending on the model configuration, the identified classes can show different class-specific covariances [21]. We explored three settings of covariance-variance structure as shown in supplemental Fig. 2. Under the assumption of freed variance and covariances, we compared the BIC, averaged uncertainty and entropy across entire samples among 2, 3, 4, 5 and 6 classes (supplemental Table 1). The optimal model that yielded the smallest BIC and uncertainty was the one with two-classes. In addition, entropy was computed as a measure of effective separation. However, it is not a reliable sole criterion for choosing the best model because a model that overfits may also exhibit high entropy [19].
Statistical analysis
Continuous data are reported as mean ± standard deviation (SD) or median and interquartile range (IQR). Categorical variables are expressed as proportions (frequency). Differences between the 2 clusters were assessed by unpaired Student’s T-test or U Mann–Whitney test as appropriate. Differences between categorical data were assessed by using Pearson’s chi-square test or Fisher’s exact test. Correlation between quantitative lung computed tomography data and gas exchange was assessed by linear regression analysis and Pearson correlation coefficient was reported. Differences in 90-day survival across subphenotypes was explored by Kaplan–Meier approach. Univariable and multivariable Cox proportional regression models were performed to explore the independent association of subphenotypes with 90-day mortality by including clinically meaningful covariates. Mortality risk was reported by hazard ratio with 95% confidence interval. Clinically meaningful covariates were decided a priori to adjust the multivariable models as follows: sex, the presence of any comorbidities, the decision of limitation of life sustaining measures. Adjusted models were ranked by their Akaike information criterion (AIC) and their Bayesian information criterion (BIC). AIC and BIC address both goodness-of-fit and simplicity of a model. Since we compared models with the same number of independent variables for the same set of patients, the lowest AIC and BIC represented the best fit model. Statistical significance was considered with a p < 0.05 (two-tailed). Further, we investigated LCA modeling by only including clinical and laboratory data (i.e. PaO2/FiO2, Temperature, PaCO2, Total Bilirubin, Platelets, Age, Creatinine, hs-CRP, WBC) or only including CT derived features (i.e. Lung gas volume, Lung mass, Consolidation fraction) to assess whether the most complete LCA model including overall mixed clinical, laboratory, and CT data showed a better association with 90-day mortality and the highest goodness of model fitting. Statistical analysis was performed by SPSS software v28 (IBM Corp., Armonk, NY, USA), R-project (Version 4.3.2) and Stata/MP 17.0 (Copyright 1985-2021 StataCorp LLC (College Station, TX, 77845, USA).
Sample size
We aimed to collect data from 500 patients at least, as this is considered an adequate sample size to conduct LCA [19].
Comprehensive information on methods is reported in the Supplemental material.
This study followed The Strengthening the Reporting of Observational studies in Epidemiology (STROBE) reporting guideline checklist.

留言 (0)