
記住我

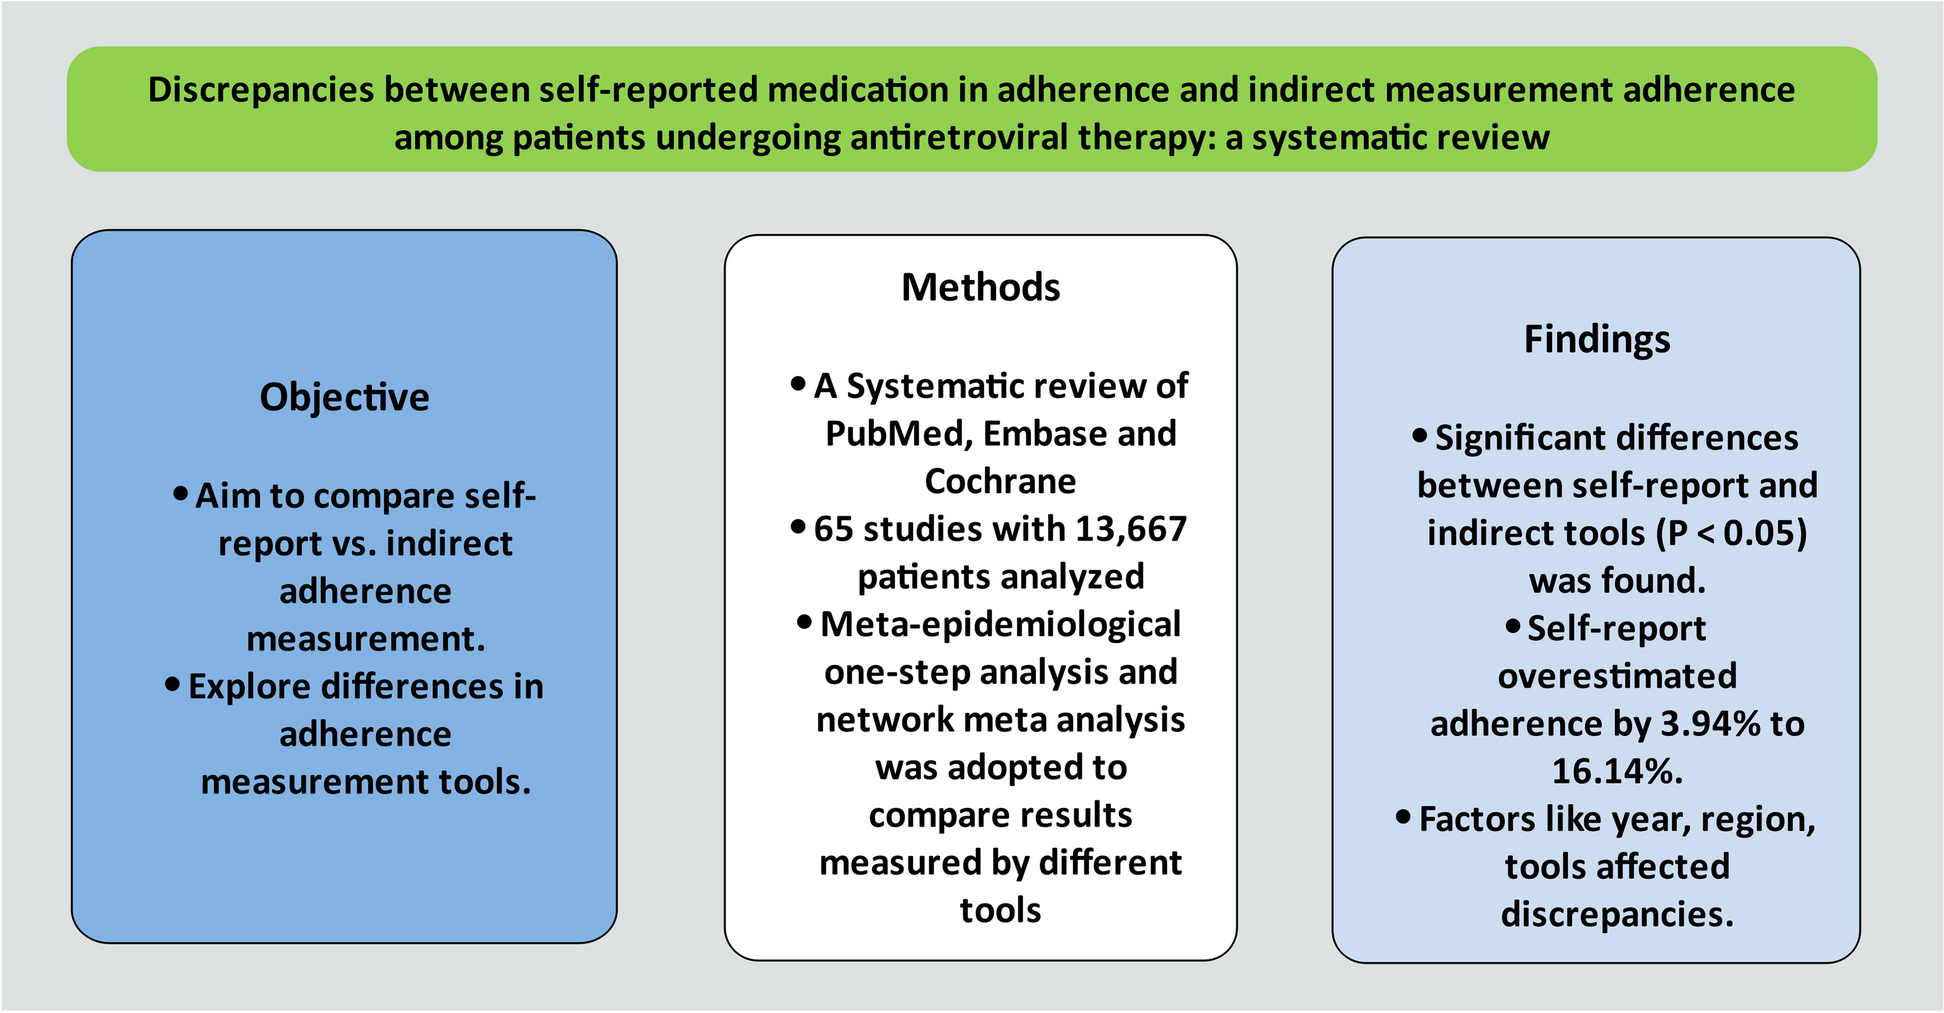


Out of the 608 articles retrieved, 65 studies with a total number of 13,667 patients were included in the meta-analysis (Fig. 1). These studies spanned publication years from 2006 to 2022 and originated from various geographical regions including North America, Africa, South America, and Asia. In terms of study design, 56 studies were cohort studies, 5 were cross-sectional studies, and 4 were randomized controlled trials (RCTs). Data from cohort studies and RCTs were limited to baseline or blank control groups.
Fig. 1
Flow diagram for study screening and selection process. AHRQ Agency for Healthcare Research and Quality Evaluation Form. AHRQ agency for healthcare research and quality
Given that only non-intervention results were considered, the AHRQ report assessment was utilized for quality evaluation. Following the AHRQ literature quality assessment, 65 articles classified as adherent were included for meta-analysis, with 59 of these articles reporting comparisons of measurement results from multiple medication adherence measurement tools.
After organizing one-to-one comparisons between self-report and indirect measurement tools, a total of 112 comparisons were made, with 30 comparisons on individual adherence rates and 82 comparisons on group adherence rates. One study [6] reported both individual and group adherence.
The SR tools used in the included studies encompassed scales, self-designed questionnaires, qualitative single-item measures, and daily reporting (Table 1A). The scales involved in the analysis were as follows: Morisky, visual analog scale (VAS), AIDS Clinical Trials Group (ACTG), Morisky medication adherence scale-8 Items (MMAS-8), Medication adherence training instrument (MATI), Patient Medication Adherence Questionnaire (PMAQ). In the included studies, the questionnaires uniformly inquire with questions "How many times have you missed your medication in a past period?" and similar queries, allowing for mutual comparison. The indirect measurement tools comprise pill count (PC), pharmacy refill (PR), electronic monitoring device (EMD), biological marker (Bio), and appointment record (APM) (Table 1B). Both Bio and EMD are considered relatively accurate measurement method [7], yet fewer studies involved Bio. Consequently, EMD will be selected as the reference group for subsequent analysis.
Table 1 Tools for measuring ART adherence included in the studiesIn our analysis, individual adherence is depicted as the adherence rate, defined as the percentage of patients' medication possession rate (doses of prescribed medicine taken/prescribed doses). In the measurement results of the electronic monitoring device (EMD), both dose adherence and timing adherence were reported. However, for comparability with results measured by other tools, only the dose adherence results are included. For group adherence, the percentage of adhered patients determined based on SR tools and indirect measurement results is reported. Among the total of 40 articles reporting adherence rate thresholds for determining adherence in patients, 74.1% of them were set at 95% (40 out of 54). In articles published after 2016, except for two [8, 9], the threshold remained consistently set at 95%. Since both SR and indirect measurement tools utilize consistent criteria for determining adherence, literature with different adherence rate thresholds can be compared.
Differences between self-report and indirect measurement tools in measuring individual adherenceThere are 17 peer reviewed articles [6, 10,11,12,13,14,15,16,17,18,19,20,21,22,23,24,25] reported SR adherence and adherence results measured by indirect tools simultaneously, resulting in a total of 30 comparisons. Egger test did not find the asymmetry on the funnel plot (P = 0.1437) (Supplementary Fig. 1).
Comparison analysis of individual adherence results by self-report and indirect measurementBased on the results of the Shapiro–Wilk normality test, the mean distributions of SR results and indirectly measured results do not conform to a normal distribution (P < 0.001). Therefore, a non-parametric test, the Mann–Whitney U test, was selected to compare the two sets of data. The analysis revealed a significant difference between SR adherence and adherence measured indirectly (U = 596.00, P = 0.007). This suggests that the adherence results obtained from the two measurement methods significantly differ statistically, with a notable numerical variance between SR adherence and adherence measured by other tools.
The Pearson correlation coefficient between SR adherence results and indirectly measured adherence results is 0.843 (P < 0.0001), indicating a positive linear relationship. This finding suggests that despite differences in adherence results from SR and indirect measurement, there exists a considerable level of coherence between them.
Meta-epidemiological one-step analysis of comparison of self-report and indirect measurement toolsA total of 30 individual adherence rate comparisons, focusing on the percentage of medication taken, were examined. The comparison findings between SR adherence and indirectly measured adherence are detailed in Table 2. Employing a meta-epidemiological one-step analysis, SR medication adherence results were compared with those obtained through indirect measurements, with the latter serving as the control and REML utilized as the regression method. Among the 30 comparison analyzed, SR medication adherence was observed to be 3.94% higher than adherence measured indirectly, with a standard error of 0.045 (95% CI: -4.48%–13.44%, P = 0.380), suggesting no statistically significant difference.
Table 2 Sub-group analysis of differences in the results of different measurement tools for evaluating individual adherence of HIV patientsSub-group analysisSubgroup analysis by region revealed that in all three regions included in the study, adherence rates determined by SR were higher compared to indirect measurements. However, the difference was not statistically significant (P > 0.05). Additionally, no significant difference was found in the degree of SR overestimation between developed regions and resource-limited areas.
The subgroup analysis regarding the reporting time indicated a decrease in the degree of SR overestimation in literature published in 2016 and thereafter. However, there was no significant difference observed between them (Table 2).
Network meta-analysis of different measurement toolsFor studies reporting individual adherence, the network meta-analysis (NMA) was conducted, incorporating data from 17 studies, which involved 37 pairwise comparisons across six distinct adherence measurement methods.
We compared the measurement results of EMD against those of 11 other adherence measurement tools across 37 comparisons, calculating the SMD through a random effects model (I2 = 100%). The analysis revealed that, with the exception of questionnaire with a recall period of 30 days (Q30), the majority of adherence measurement tools reported significantly higher adherence outcomes(all P < 0.001) compared to EMD, such as ACTG (SMD = 1.0532), PC (SMD = 1.0043), and (SMD = 1.4769), indicating a potential for these tools to overestimate adherence levels. Notably, Q30's outcomes were significantly lower than EMD, suggesting a potential for inaccuracy (Table 3).
Table 3 Differences in the results of different measurement tools for evaluating individual adherence of HIV patients through a network meta-analysis (EMD as reference)Examining the forest plot (Fig. 2), it becomes apparent that the results of Q30 and single-item qualitative measurement (Qi) are the closest to those of EMD.
Fig. 2
Forest plot of differences in the results of different measurement tools for evaluating individual adherence of HIV patients through a network meta-analysis. ACTG AIDS Clinical Trials Group Adherence Questionnaire, EMD electronic monitoring devices, PC pill counting, PR pharmacy refill, Q qustionare, VAS Visual Analog Scale. The numbers following the measurement tools represent the number of days in the recall period for the scale, "i" stands for single-item qualitative measurement
Sensitivity analysis found that the study with the largest effect size was the comparison of PC and Q30 in the study by Wall et al. [25], and the sample size of the study by Haberer et al. [18] was too small (n < 20). Even after excluding the study with the largest effect size, still statistical significance persisted for most tools compare to EMD (P < 0.05), except for PR, Q30 and Qi (Supplementary Table 1A). Furthermore, following the exclusion of the study with a small sample size, all tools continued to exhibit significant differences compared to EMD. This suggests that despite the removal of studies with either the largest effect size or small sample sizes, the significant effects of the tools relative to EMD remain robust. Although heterogeneity was reduced, it remained high, indicating the robustness of the network meta-analysis conclusions to a certain extent.
Moreover, this study received scores above 8 from AHRQ, indicating high quality, and was not exclude in the overall study therefore.
The Begg’s test of funnel plot asymmetry found no significant relationship between effect size and its precision, indicating no evidence of publication bias (t = 0.06, df = 35, P = 0.9494).
Differences between self-report and indirect measurement tools in measuring group adherenceForty-nine peer-reviewed articles [6, 8, 9, 26,27,28,29,30,31,32,33,34,35,36,37,38,39,40,41,42,43,44,45,46,47,48,49,50,51,52,53,54,55,56,57,58,59,60,61,62,63,64,65,66,67,68,69,70,71] provided data on adherent ratios measured simultaneously by SR and indirect tools, totaling 82 comparisons reported the adherent ratios measured by SR and indirect tools at the same time, with totally 82 comparisons. Egger test confirmed asymmetry in the funnel plot (P < 0.0001) (Supplementary Fig. 2). Even after excluding studies with the largest effect sizes, the results of sensitivity analyses remained significant (Supplementary Table 2).
Comparison analysis of group adherence results by self-report and indirect measurementBased on the results of the Shapiro–Wilk normality test, it was found that the mean distributions of SR results and indirectly measured results do not adhere to a normal distribution (P < 0.01). Consequently, a non-parametric test was selected. The Wilcoxon signed-rank test revealed that there is a statistically significant difference in adherence patient percentages obtained by the two measurement tools (W = 327.00, P < 0.0001). This indicates a significant disparity in the proportion of adherent patients as determined by the results of the two adherence measurement methods.
Moreover, the Pearson correlation coefficient between SR adherence outcomes and indirectly measured adherence outcomes was calculated to be 0.684 (P < 0.0001), suggesting indicating a moderate to strong positive correlation. This finding implies that despite variations in adherent proportions measured by the two methods, they exhibit a degree of consistency, both reflecting patients' medication-taking behavior.
Meta-epidemiological one-step analysis of comparison of self-report and indirect measurement toolsA meta-epidemiological one-step analysis, comparing proportions of adherent patients classified based on SR with results based on indirect measurement, utilized indirect measurement as the control and employed REML as the regression method. This analysis encompassed 82 comparisons. The proportion of patients classified as adherent through self-report was found to be 16.14% higher than that measured indirectly, with a standard error of 0.038 (95% CI: 4.81–18.84%, P = 0.001), indicating a statistically significant difference.
Sub-group analysisThe regional subgroup study revealed that across all four regions included in the study, adherence proportions measured by SR were consistently higher than those measured indirectly. This difference reached statistical significance in Africa (P < 0.001) and South America (P < 0.001), and approached significant in Asia (P = 0.086). Additionally, in the subgroup analysis based on reporting time, it was found that the adherence proportion determined by SR results reported before 2016 exceeded that measured by indirect methods by 18.18%. Conversely, after 2016, this difference decreased slightly to 13.04%. These findings are summarized in Table 4.
Table 4 Sub-group analysis of differences in the results of different measurement tools for evaluating group adherence of HIV patientsNetwork meta-analysis of the different measuring toolsIn our network meta-analysis, we scrutinized 10 distinct t tools for measuring adherence to ART, encompassing 116 pairwise comparisons (Fig. 3). The results of heterogeneity and consistency tests revealed an I2 < 50%, and tests for consistency within and between designs also indicated no significant inconsistency. Consequently, a common effect model was selected for further analysis. Previous research suggests that the EMD provide a more accurate measure of patient adherence compared to other methods [72, 73], therefore, EMD results are considered as a reference. Under the common effect model, certain adherence measurement tools, including ACTG, Q180, Q2-4, Q30, Q7, and Q90, demonstrated a proportionally higher number of adherent patients compared to EMD, with the differences statistically significant (all P < 0.05) (Table 5).
Fig. 3
Forest plot of differences in the results of different measurement tools for evaluating group adherence of HIV patients through a network meta-analysis. ACTG AIDS Clinical Trials Group Adherence Questionnaire, APM appointment record, Bio biological maker, EMD electronic monitoring devices, MMAS-8 Morisky Medication Adherence Scale-8 Items, PC pill counting, PR pharmacy refill, Q qustionare, VAS Visual Analog Scale. The numbers following the measurement tools represent the number of days in the recall period for the scale. "i" stands for single-item qualitative measurement, and "nr" stands for not reported recall period
Table 5 Differences in the results of different measurement tools for evaluating group adherence of HIV patients through a network meta-analysis (EMD as reference)Sensitivity analysis identified the largest effect size study by Vaz et al. [64] focusing on the comparison between PC and questionnaires with a recall period of 4 days. Additionally, and the sample size of the studies by Da costa et al. [53] and Wiens et al. [48] was too small (n < 20). After excluding the study with the largest effect size or small sample size, methods such as ACTG and questionnaires continued to demonstrate significantly higher adherence results compared to EMD, aligning with previous analysis findings (Supplementary Table 2). This indicates a degree of robustness in the results of the network meta-analysis to the exclusion of individual studies. These studies received an 11 score from AHRQ, indicating high quality, and therefore retained in the analysis.
The Begg’s test of funnel plot asymmetry found no significant relationship between effect size and its precision, indicating no evidence of publication bias (t = 1.21, df = 114, P = 0.2301).
留言 (0)