
記住我

DENV has posed a growing threat on the public health in Chinese mainland since 1990 (Additional file 3: Figure S1a). Before 2013, the epidemics of dengue fluctuated periodically with an obvious peak every 4‒7 years [6] (Additional file 3: Figure S1a). In 1995, 1999, 2002, and 2006, more than 1000 dengue cases were reported in China (Additional file 3: Figure S1a). When it came to the years between 2013 and 2019, however, dengue outbreaks have occurred continuously with more than 1000 reported cases annually in China (Additional file 3: Figure S1a). Notably, four dengue serotypes (DENV-1, 2, 3, and 4) were reported during these epidemics, and DENV-1 became predominant in recent years (Additional file 3: Figure S1b). DENV-1 cases were reported in about 70% (21/30) of the years during 1990‒2019, while the cases occurred even continuously during the two periods of 1997‒2003 and 2013‒2019 (Additional file 3: Figure S1b). It was the same with DENV-2 the second most-frequent serotype detected in China, occurring continuously during the period of 2013‒2019 in Guangdong (Additional file 3: Figure S1b). DENV-3 and DENV-4 have generated 6 local outbreaks as well (Additional file 3: Figure S1b). Noteworthily, there is a trend of co-circulation with multi-serotypes, rather than a simple epidemic trend of cross-serotypes. For example, DENV-1, 2, and 3 occurred in 2013 and 2019, and four serotypes co-circulated simultaneously in 2016 (Additional file 3: Figure S1b).
A total of 92,995 indigenous dengue cases had been reported in Chinese mainland from 1990 to 2019, and Guangdong became a major focal region for dengue epidemic region, accounting for 69.7% (75,350 cases) of the total and representing an increasing epidemic trend of dengue, especially since 1990 (Additional file 3: Figure S1a,c). The epidemic broke out locally across the whole Guangdong Province (Additional file 3: Figure S1d), and 89.7% (56,345 cases) of the cases were reported from Guangdong‒Hong Kong‒Macao Greater Bay Area including Guangzhou, Shenzhen, Foshan, Zhongshan, and Dongguan. Among them, in particular, Guangzhou reported 48,248 cases, accounting for 76.8% of the total (Additional file 3: Figure S1d). The other five provincial-level administrative divisions (PLADs) in China documenting more than 1000 cases reported were all located in the southeast coastal areas or along the southwest border of the country: Yunnan (9890 cases, 10.6%), Fujian (3555 cases, 3.8%), Jiangxi (1018 cases, 1.1%), and Guangxi (1001 cases, 1.1%) (Additional file 3: Figure S1c).
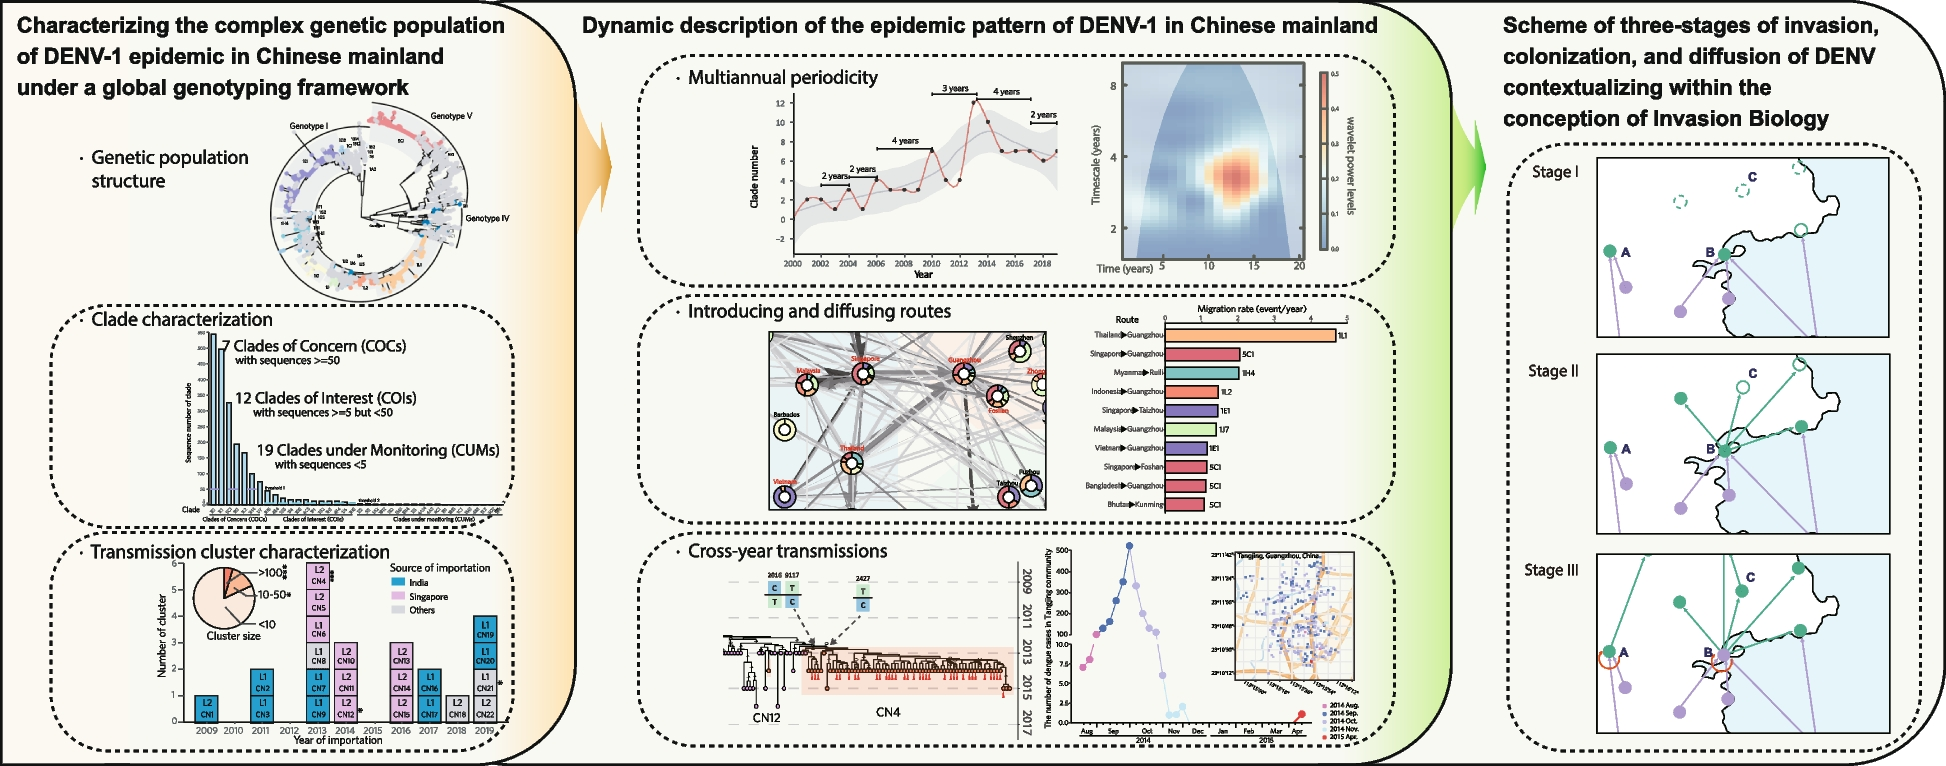
Complexity of population structure of DENV-1 epidemic revealing under the E-gene-based global genotyping frameworkAfter recognition from the phylogeny of E-gene-based genotyping framework [7], the viral populations in Chinese mainland, were found to contain 38 clades belonging to 22 subgenotypes of all 3 globally and broadly circulating genotypes I, IV and V of DENV-1 (Fig. 1a, Additional file 4: Figure S2, Additional file 5: Table S3). Notably, the subgenotypes and clades of DENV-1 recorded in China were discretely distributed with distinct focuses (Additional file 4: Figure S2a). The number of sequences in the designated clades was distributed with a power-law characteristic, with more than 80% of them concentrated in 7 clades: 1E1, 1L1, 5C1, 1K1, 1L2, 1H4, and 1J7, which were thus named as the Clades of Concern (COCs) in this study. Meanwhile, 12 clades containing sequences between 5 and 50 were classified as the Clades of Interest (COIs), and 19 clades containing sequences < 5 as the Clades under monitoring (CUMs) (Additional file 5: Table S3).
Fig. 1
The population structure of DENV-1 circulating in Chinese mainland was designated through the E-gene-based global genotyping framework of DENV-1 [5]. a Maximum likelihood phylogenetic analyses show that there are 38 clades labeled in color circulating in Chinese mainland, while the other clades are labeled in gray. b Histogram of DENV-1 clades circulating in Chinese mainland from 1990 to 2019. The inset is a partial enlargement view during 1990‒2012. c, d Distribution of reported DENV-1 strains in Chinese mainland and Guangdong Province, respectively. Pies are slices colored by the composition of DENV-1 clades
In addition, in order to exploring the cross-transmission mechanisms, we further identified 189 clusters of 38 clades circulating in China, including 126 clusters in the 7 COCs, concretely, 17 clusters in 1E1, 25 in 1H4, 17 in 1J7, 6 in 1k1, 15 in 1L1, 23 in 1L2, and 23 in 5C1 (Additional file 6: Table S4). Similar with the number of clade sequences, the number of cluster sequences also followed a power-law characteristics in its distribution (Additional file 4: Figure S2b and S2c, Additional file 6: Table S4).
The dynamics of DENV-1 population structure at the clade level in the dengue epidemics in Chinese mainland from 1990 to 2019 was showed in Fig. 1b. The main clades responsible for DENV-1 outbreaks were COIs 1B1 and 4A3 in 1991, COI 4F4 in 1995, COI 4E4 in 2002, COCs 1E1 and 1H4 in 2006, COCs 1K1 and 5C1 in 2014, and COCs 1E1 and 1L1 in 2019 (Fig. 1b, Additional file 5: Figure S3a). From 2013 to 2019, both the number of sequences and the diversity of clades of DENV-1 were significantly increased, with several clades showing persistent multi-year prevalence (Fig. 1b, Additional file 5: Figure S3a). Similar to the cases surveillance data analyzed above (Additional file 3: Figure S1), the high diversity of genotypes, subgenotypes, and clades of DENV-1 was found mainly distributed in the PLADs in the southeast coastal regions (Guangdong, Fujian, and Zhejiang) or near the southwest border of China (Yunnan and Guangxi) (Fig. 1c, Additional file 7: Figure S3b; Additional file 8: Figure S4a,b,c), which were recognized as the expanding epidemic regions in previous studies [2]. Meanwhile, the major cities in the Guangdong‒Hong Kong‒Macao Greater Bay Area including Guangzhou, Shenzhen, Foshan, Zhongshan, and Dongguan were also found with higher diversity of DENV-1 population (Fig. 1d; Fig. S3c, Fig. S4d,e,f). Regarding the clade, these provinces and cities were subject to a wide distribution of COCs. Interestingly, the clusters of COCs were focal, clearly as well as 12 cities in the area reported a presence of its 5C1-CN4 (94 sequences), 11 reported a presence of its 1K1-CN6 (125), 9 reported a presence of its 1L1-CN4 (121), and 5 reported a presence of its 1E1-CN16 (343) (Additional file 9: Figure S5, Additional file 6: Table S4).
Epidemic periodicity of DENV-1 in Chinese mainlandFurther exploring the epidemic periodicity of DENV-1, we found obvious consistent fluctuations in the elevations of cases, clades, clusters, and sequences numbers reported in Chinese mainland during 1990‒2019 (Fig. 2a-d), with the growth rates fluctuating alternately around zero (Fig. 2e-h). The number of clades and clusters in dynamics presented a cyclical pattern of 2 to 4 years, peaking in 2002, 2004, 2006, 2010, 2013, 2017, and 2019, with the most significant growth trend around 2013 (Fig. 2c,d,g,h). But the numbers of cases and sequences were without any peak in 2010, resulting in a long cyclical period between 2006‒2014 (Fig. 2a,b,e,f). The estimated of multiannual periodicities inferred from the number of clades, clusters, cases and sequences were 3.11, 3.45, 2.52 and 2.52 years, respectively (Fig. 2i-l). Compared with the number of cases and sequences (probably influencd by edge effects), the epidemic periodicity inferred from the number of DENV-1 genetic populations including clades and clusters was more robust (Fig. 2i-l). These results indicated that DENV-1 had an epidemic periodicity of about 3 years in China (Fig. 2k-l).
Fig. 2
DENV-1 epidemic periodicity in Chinese mainland represented by the dynamics of the number, growth rates, and estimated of multiannual periodicities of the cases, sequences, transmission clusters, and clades. a-d Yearly time series of the number of cases (a), sequences (b), transmission clusters (c), and clades (d). e–h Yearly time series of the growth rates of the number of cases (e), sequences (f), transmission clusters (g), and clades (h). g-i Estimates of multiannual periodicities of the number of cases (i), sequences (j), transmission clusters (k), and clades (l) using the models driven by simple seasonal sine curves. Edge effects in the wavelet transforms may influence results before and after the purple-gray shadow in i, j, k, and l
Phylogeographic inference of introducing and diffusing routes of COCs in Chinese mainlandTo explore the introducing and diffusing patterns of the seven COCs in Chinese mainland, the seven timed phylogenic trees have been established under the E-gene-based global genotyping framework of DENV-1 using the ancestral state reconstruction of non-reversible discrete spatial locations (Fig. 3a, Additional file 10: Figure S6). The transmission routes belonging to the introduction or diffusion were discerned based on the transmission parameters of the source-sink relationship between two epidemic locations, which were inferred using BSSVS (Fig. 3, Additional file 11: Table S5). The largest number of migration events occurred in the COC 5C1 (56), followed by COCs 1E1 with 34, 1J7 with 26, 1L1 with 25, IL2 with 21, 1H4 with 16, and 1K1 with 14 (Additional file 11: Table S5).
Fig. 3
Introducing and diffusing routes of the seven COCs including 1E1, 1H4, 1J7, 1K1, 1L1, 1L2, and 5C1 in Chinese mainland inferred by BSSVS. a Phylogeographic reconstruction of the introduction and diffusion events of the seven COCs in Chinese mainland. Myanmar, Vietnam, Thailand, Singapore, Malaysia, Indonesia, and India, as well as Guangzhou, Zhongshan, Foshan, and Chaozhou in China are highlighted in red bold font as these countries/cities occurred more than ten migration events. b Dynamics and trends of the epidemic trunks of the seven COCs including 1E1, 1H4, 1J7, 1K1, 1L1, 1L2, and 5C1, representing the proportion of PACT-inferred dominant epidemic countries/cities changed dynamically along with different years
Except for COC 1K1, all the other 6 COCs were introduced on their own routes into Chinese mainland with strong support and migration rates > 1, For instance, 1L1 was introduced from Thailand to Guangzhou with the highest migration rate of 4.68 events/years, 5C1 from Singapore to Guangzhou with the migration rate of 2.04, and 1H4 from Myanmar to Ruili, 2.02 (Fig. 3a, Additional file 12: Figure S7a, Additional file 11: Table S5). After observing the number of involved migration events, as expected, we found that the introduction of seven DENV-1 COCs in Chinese mainland were mainly imported from the attributed countries/areas of the Great Mekong Subregion-China (GMS-China), Southeast Asia (SEA), South Asia Subcontinent (SASC), and Oceania (OCE) [7] (Fig. 3, Additional file 12: Figure S7). Among them, Malaysia, Thailand, and Singapore were indicated to be the most active importing sources, each having more than 8 introduction routes of the COCs into Chinese mainland (Fig. 3, Additional file 11: Table S5, Additional file 12: Figure S7).
On the entry side, the border cities in southwest China and coastal cities in southeast China, were the major receipting hubs (Fig. 3, Additional file 12: Figure S7), and the introduction routes of involved entry cites even differed. Noticeably, Guangzhou was the most dominant receipting hub in China, with the most routes widely from GMS-China, SEA, and SASC countries such as Thailand, Singapore, Vietnam, Malaysia, Indonesia, and India. Meanwhile, the introduction sources to Ruili and Xishuangbanna in Yunnan Province, China were mainly from the countries of GMS-China region like Myanmar, to Taizhou in Zhejiang and Fuzhou in Fujian, China were mainly from the SEA countries like Malaysia, Singapore, and Indonesia (Fig. 3, Additional file 11: Table S5, Additional file 12: Figure S7).
For the diffusion of COCs in Chinese mainland, a pattern was evidently observed that they diffused from the cities in the Guangdong‒Hong Kong‒Macao Greater Bay Area to the cities in the east and west of Guangdong and other PLADs. Among them, the city of Guangzhou had the largest number of introduction routes and internal diffusion routes. It played a crucial role in the process of DENV-1 importation from abroad and diffusion within Guangdong Province and even beyond in China. Specifically, it facilitated diffusion to Foshan, Shenzhen, and Zhongshan in the Guangdong‒Hong Kong‒Macao Greater Bay Area, as well as Yunfu, Chaozhou, Zhaoqing in the eastern and western regions of Guangdong. Additionally, it extended its reach to cities in other PLADs including Hangzhou and Xishuangbanna (Fig. 3, Additional file 11: Table S5, Additional file 12: Figure S7).
Invasion and diffusion process of the COCs 5C1 and 1K1 responsible for the 2014 large outbreak in Guangdong ProvinceCOC 5C1 was mainly responsible for a larger DENV-1 outbreak in Guangdong Province, China in 2014 (Fig. 1b), and its strains were isolated for consecutive years from 2013 to 2015 in Guangzhou (Additional file 5: Figure S3a). To explore the invasion and diffusion pattern of 5C1 in the province, we further performed the analyses of phylogeny using E gene and genome, combined with identification of genome-wide SNPs and genome-based transmission chains, after contextualizing them within the epidemiological information, were further performed. We identified a total of 23 clusters were identified from the 292 epidemic strains of COC 5C1 recorded in Chinese mainland, of which the largest cluster 5C1-CN4 had 221 strains isolated in 2014 and spread to other 14 cities in Chinese mainland (Fig. 4a, Additional file 9: Figure S5). Surprisingly, except the origin strain 2005/JQ922548 isolated in India, all the other 5C1 strains exhibited the same distinguishing feature of a 21 nucleotide (nt) deletion in the highly-variable region (HVR) of the 3’-end untranslated region (3’-UTR) (21nt-dHVR-3’-UTR) (Additional file 13: Figure S8). From the phylogenetic tree, 5C1 was observed to originate from India and then obviously evolved into two different lineages (Fig. 4a). The trunk strains of the lineage 1 were traced from India, and in total, its 11 transmission clusters were identified spreading in Chinese mainland from 2010 to 2019 (Fig. 4a). Among them, nine of the clusters were evidently traced from India, but the introducing source of 5C1-CN21 was unknown (Fig. 4a, b). Meanwhile, the trunk strains of the lineage 2 were traced from Singapore, and in total its 12 transmission clusters were identified spreading in Chinese mainland from 2013 to 2019 (Fig. 4a). Among them, nine clusters were evidently traced from Singapore, with the cluster 5C1-CN4 ranked first in 5C1 introduction routes and its strains mostly isolated in the 2014 large outbreak in China (Fig. 4a, b).
Fig. 4
Invasion and diffusion of COC 5C1 of DENV-1 in Chinese mainland. a Maximum clade credibility phylogeny of COC 5C1 based on the genomes. According to the topological structure and bootstrap values of the E-gene-based tree, COC 5C1 was further divided into 23 transmission clusters as showed in Chinese mainland showing in Additional file 10: Figure S6g. The present genome-based phylogenetic tree has the same clustering recognition ability as the E-gene-based tree, but it has significantly better resolution for discriminating the exact transmission process of each cluster. The critical SNPs, representing the evolution of clusters during their transmission process, are indicated by arrows at the cluster differentiation nodes on the left of the phylogenetic tree. Taking SNP 2359 as an example, it is T in the genomes of the upper branch, while it is C in the genomes of the lower branch. b Temporal dynamics of the designated transmission clusters of 5C1 based on its importation source and year. The inserted pie chart shows the composition ratio of 5C1 clusters with different size. c Genome-wide SNPs analysis of the lineage of 5C1 traced from Singapore. Only the positions with specific SNPs found in the strains of cluster 5C1-CN4 isolated in Chinese mainland were shown, with the SNPs of non-synonymous (NS) in blue and synonymous (S) in red. d Reconstructed genome-based transmission chain of 5C1-CN4 circulating in Chinese mainland. e. Spatiotemporal distribution of the indigenous cases observed in Tangjing Street, Guangzhou, China from Nov. 27th, 2014 to Apr. 4th, 2015. The cases reported in different month are shown in different color. The first indigenous dengue case (2015/KT827378) reported in Guangdong Province, China on Apr. 4th, 2015, is shown in red
Surprisingly, we even observed that the continuous evolution of all 5C1 strains with 21nt-dHVR-3’-UTR had resulted in a series of specific SNPs, which characterized its transmission and adaptation process from India to Singapore and China (Additional file 13: Figure S8). The SNPs T2359C, A5799G, C6177T, C7494T, and C9807T represented the separation of Lineage 1 and Lineage 2 (Fig. 4a). The foundational strains were 2009/JN903581/India in Lineage 1 and 2009/JF960211/Singapore in Lineage 2, while the strain isolated in Guangzhou, China in 2019 persistently conserved these SNPs of Lineage 1 (Fig. 4a). Following the foundation of Lineage 2 sourced from Singapore, the strain JQ917404 isolated in India in 2009 developed with several SNPs including C1110T, T5730C, C7603T, G9111A, and C10038T, indicating a complex cross-transmission and adaptation of 5C1 population (Fig. 4a). Consequently, the master strains caused the large outbreak in Singapore during 2012‒2013 displaying the SNPs including A876G, A1128G, C4144T, T6501C, G7251A, T7305C, A7611G, T8298C, T8371C, G9024T, and A10375C (Fig. 4a). Later, the strains 2013/KX225487 and 2014/GZ8_0027 in 5C1-CN4 isolated in Guangzhou preserved the same SNPs developed in KM403633 and KM403634 isolated in Singapore in 2013, including C2016T and T9117C (Fig. 4a, c). Subsequently, the local master strains of 5C1-CN4 caused the large outbreak in Guangzhou in 2014 and the strain 2015/KT827378 evolved with the specific SNP T2427C (Fig. 4, Additional file 10: Figure S6). Meanwhile, the population size of the Lineage 2 sourced from Singapore was inferred with two rapid population expansions in 2013 and 2014, respectively, in accordance with the respective large outbreaks in Singapore in 2013, and in Chinese mainland in 2014 (Fig. 4, Additional file 13: Figure S8).
Notably, the largest cluster 5C1-CN4 was introduced from Singapore in 2013 and then became a consecutively transmitted in Guangzhou from 2013 to 2015. The evidence was strongly supported by the topology of both E-gene-based and genome-based phylogenic trees (Fig. 4a, b, Additional file 10: Figure S6g). Furthermore, the genome-wide SNPs analyses also verified that 5C1-CN4 was originated from Singapore, showing several same variations including C2016T, T3393C, G3864A, T5367C, A6261G, C7098T, T9117C, A10375C, and 21nt-dHVR-3’-UTR following its root strains. All of them were originally isolated from the large dengue outbreak in Singapore in 2013 [23] (Fig. 4c, Additional file 13: Figure S8). But a distinctive variation T2427C was observed in 5C1-CN4 as well, which indicated that this cluster has been developing to become a local master viral population (Fig. 4c). Moreover, the genome-based transmission chain of 5C1-CN4 further demonstrated that 5C1-CN4 was first introduced from Singapore to Guangzhou in 2013, and consecutively transmitted locally in Guangzhou from 2013 to 2015, during which it diffused from Guangzhou to other cities in Guangdong Province and even other PLADs in China (Fig. 4a, d, Additional file 10: Figure S6g). Moreover, a unique strain of 2015/KT827378 was isolated from the first indigenous dengue case in China through in-depth epidemiological investigation on April 4th, 2015, who resides in Tangjing Street, Baiyun District, Guangzhou. It was for more than four months (Nov 27th, 2014 to Apr 4th,2015) that neither imported nor indigenous dengue cases had been reported in Guangzhou since the 2014 large outbreak, but only between August to November in the year of 2014 had 1338 indigenous dengue cases been reported in this street.
Another important COC of DENV-1 responsible for the 2014 large outbreak in Guangdong Province, China was 1K1 with 6 designated transmission clusters (Additional file 10: Figure S6a, Additional file 14: Figure S9). Despite 1K1 strains were simultaneously reported in Thailand, Cambodia, Barbados, Australia, and Chinese mainland, the precise sources of all six transmission clusters of 1K1 in Chinese mainland could not be inferred by reconstruction of fine-scale genome phylogeny combining with the E-gene-based phylogenic tree, which thereby marked as unknown in the figure (Additional file 10: Figure S6a, Additional file 14: Figure S9). The largest cluster 1K1-CN6 was circulated in the core cities in the Guangdong‒Hong Kong‒Macao Greater Bay Area especially in Guangzhou and Foshan from 2014 to 2015, with the majority of its strains reported in 2014 (Additional file 14: Figure S9a). Inferred from both the E-gene-based and genome-based phylogenic trees of 1K1, the strain 2015/MN018295 isolated from the first dengue patient in Foshan on May 23rd, 2015 [24] was originated from the strain KX458013 isolated in Guangzhou on November 10th, 2014 (Additional file 14: Figure S9), which represented the occurrence of cross-year transmission of the cluster 1K1-CN6 in Guangzhou and Foshan, China. This evidence was also verified by the transmission chain established using genomes of 1K1-CN6. At last, the genome-wide SNPs comparison showed that the strain MN018295 preserved all the specific SNPs of 1K1-CN6 including T279C, C756T, A2175G, T3024C, G5073A, G7527A, A8637G, C9144T, A9210G, and A10116G (Additional file 14: Figure S9).
Dynamic characteristics of the transmission clusters belonging to the other 5 COCsBesides the COCs 5C1 and 1K1, a total of 97 transmission clusters were identified using the phylogenic trees for COCs 1E1, 1H4, 1J7, 1L1, and 1L2 (Additional file 6: Table S4, Additional file 10: Figure S6, Additional file 14: Figure S9, Additional file 15: Figure S10). Through the comprehensive analysis of phylogeny combining with epidemiological information for the importation sources of COCs clusters, it was found that 18.8% –100% of the clusters designated in 7 COCs could not be inferred, thereby marked as unknown in this study (Additional file 6: Table S4, Additional file 16: Figure S11). Among those with unknown sources, 44 clusters were from Guangdong Province, a number significantly larger than from other PLADs in China (Additional file 6: Table S4, Additional file 16: Figure S11). Followed by Yunnan Province, it had 13 clusters with unknown sources, of which 9 were in 1H4 and 3 were in IL2 (Additional file 6: Table S4). In terms of the temporal distribution, 8 clusters had cross-year transmission, 7 in Guangdong Province and 1 in Yunnan Province, including 5C1-CN4 and 1K1-CN6 as described above, 1E1-CN16 in Guangdong with unknown sources, and 1L1-CN7 in Yunnan and Zhejiang with the sources from Myanmar (Additional file 15: Figure S10).
As for 1E1-CN16, it was found transmit in Guangzhou during 2018‒2019, and largely reported in 2019 (Additional file 15: Figure S10). The E-gene-based phylogenic tree of 1E1 showed that several strains reported in Guangzhou in 2019 including MN921341 might be originated from the strain MN933727 isolated in Guangzhou in 2018, but the genome of MN921341 was unavailable for in-depth inferring (Additional file 15: Figure S10). Meanwhile, both the genome-based and E-gene-based phylogenic trees inferrably uncovered that the tMRCA of MN933669 isolated in Guangzhou in 2018 with other strains isolated in 2019 were similar to those isolated in 2017, indicating the evidence of these strains continuously circulating in Guangzhou were unconvinced (Additional file 15: Figure S10). Although the genome-wide SNPs analyses verified that the strain 2018/MN933669 gathered within the strains isolated in 2019 and represented several same variations including T2286C, Y886H, and C8034T, there were several specific amino acid variations in E-gene region of the strain MN933669 (Additional file 15: Figure S10). Due to the insufficiency of information of genomes of the strains involved in the other five cross-year transmissions, no further analyses on their transmission were carried out in this study (Additional file 16: Figure S11).
留言 (0)