
記住我

The number of participants to be included in SpeSerTryp was calculated based on estimates of test specificity reported in the literature [9, 10] or provided by the serological screening test manufacturers. The mean of the specificity estimates, 99.0%, was used as the reference value for the specificity, the significance level (alpha) was set at 5%, the power at 80% and the equivalence margin at 2% (based on the range of 97.2–99.2% of specificities previously observed with CATT [9, 10]). The minimum sample size required for the comparisons was 424 non-HAT affected controls [18]. Due to the uncertainty of the specificity estimates and to improve precision, it was proposed to include a minimum of 500 non-HAT affected controls in each country.
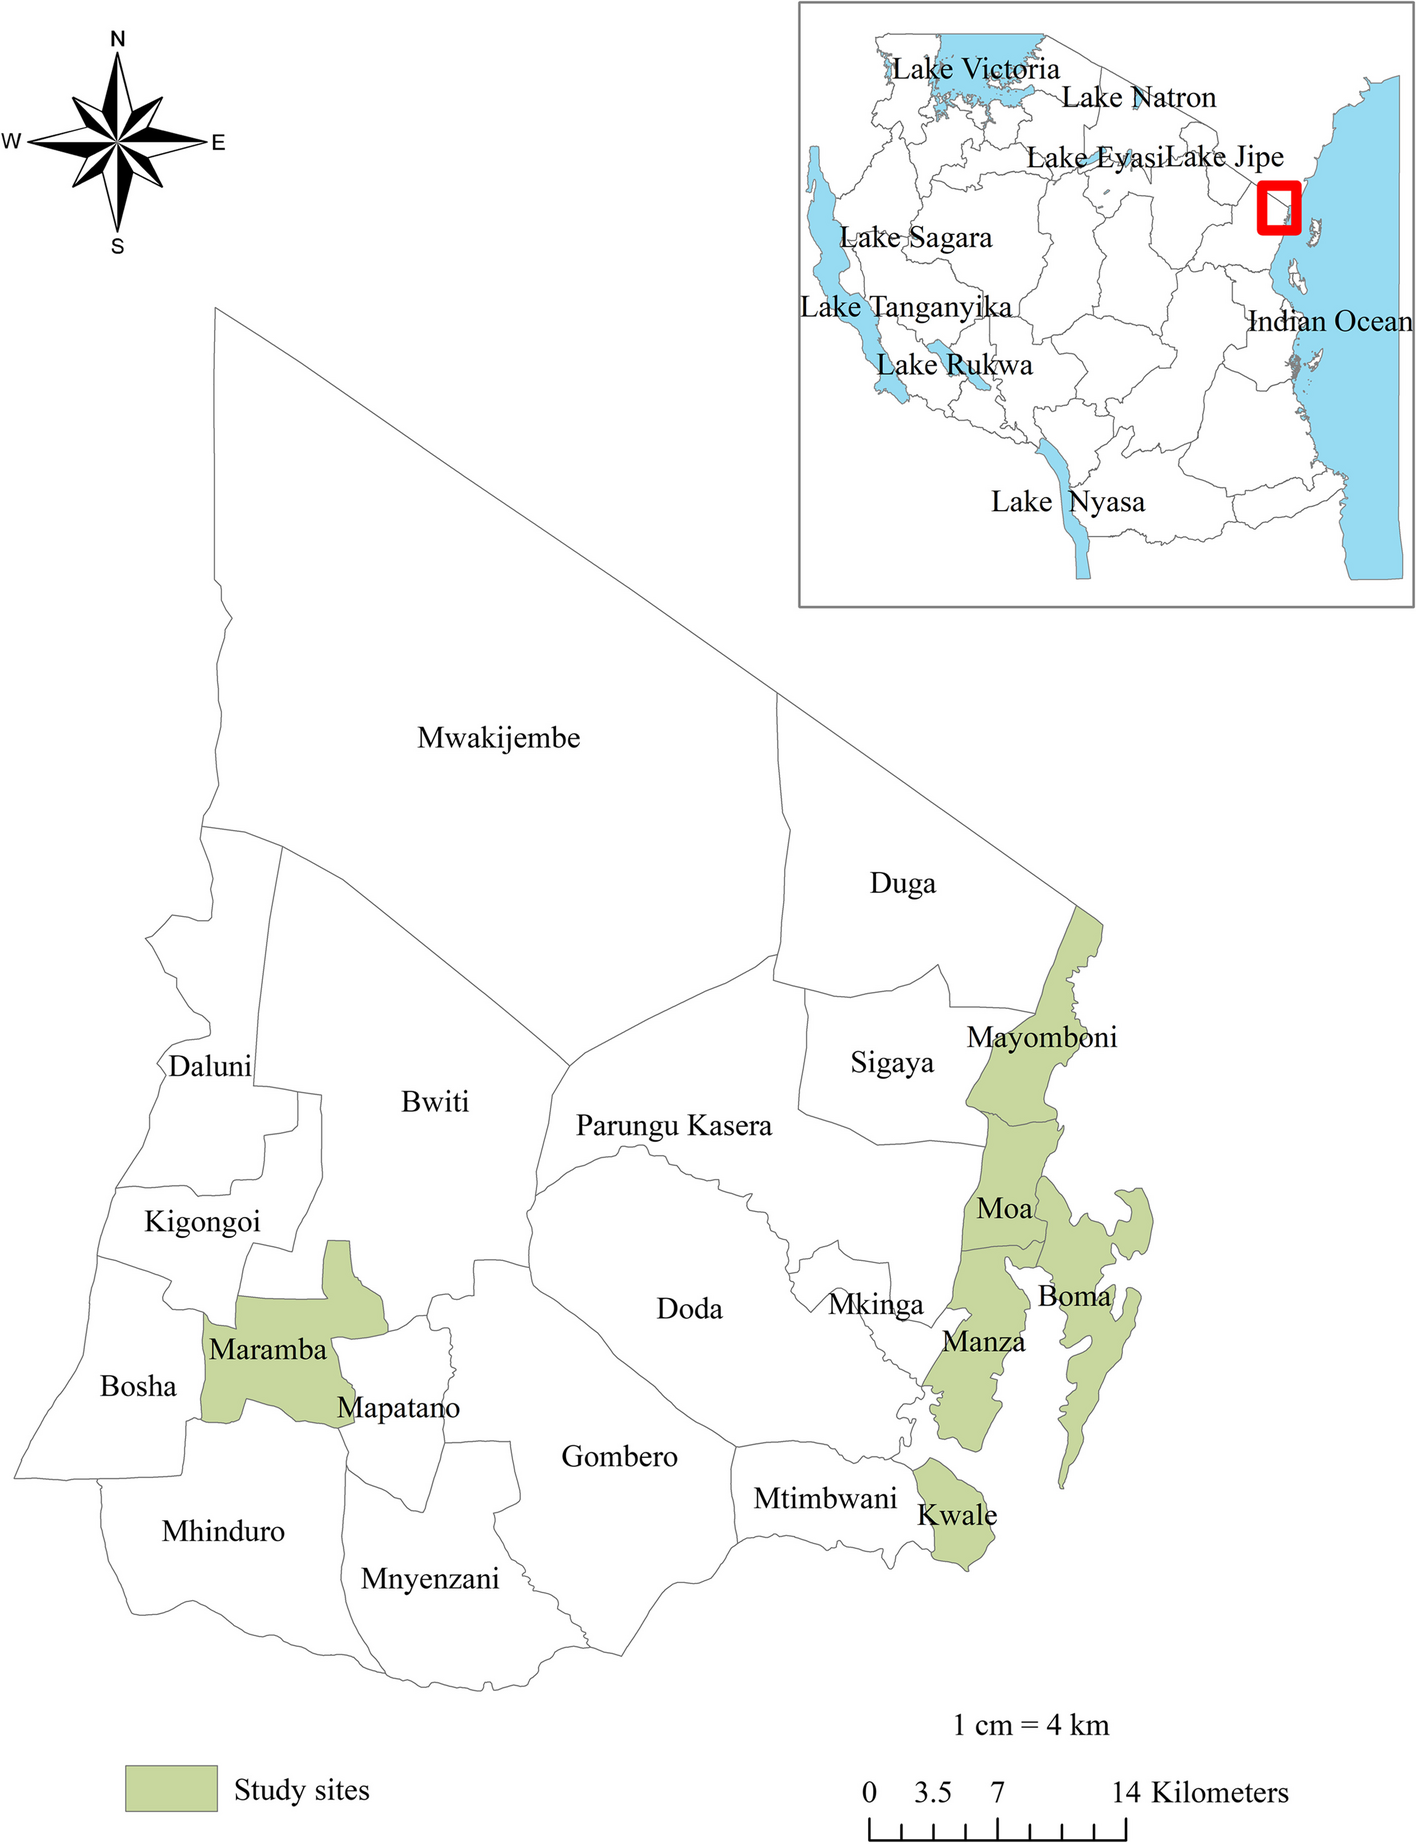
Inclusions took place consecutively, during active screening by experienced mobile teams between June 21 and July 5, 2022 in the Bonon and Sinfra hypoendemic foci, located in the Bouaflé and Sinfra health districts in Central West Côte d’Ivoire [4], and from June 28 to July 2, 2022 in the under-prefectures Ouassou and Khorira, which both can be considered hypoendemic, and are located in Dubréka prefecture in Guinea [3].
Inclusion criteria were being aged 10 years or more and having provided written informed consent for participation. Exclusion criteria were known severe anemia preventing blood collection; severe medical condition preventing the collection of informed consent and participation in the study (e.g. coma, cognitive impairment, etc.) or having a known history of previously treated HAT infection.
An overview of all tests for diagnosis of gHAT that were carried out in the SpeSerTryp study is given in Table 1.
Table 1 Overview of diagnostic tests for gambiense human African trypanosomiasis carried out in the SpeSerTryp studyTests performed in the field, specimen collection and case managementThe testing algorithm is summarized in Fig. 1. After having obtained informed consent from each participant or their legal representatives for children under 18 years, 6 mls of blood were collected in a heparinized tube by venepuncture. The heparinized blood was used for all the tests.
Fig. 1
Summary of the test algorithm and data interpretation. gHAT gambiense Human African trypanosomiasis; RDT rapid diagnostic test; ∅ negative test result; ⊕ positive test result; DBS dried blood spot; Shield: blood in DNA/RNA shield buffer
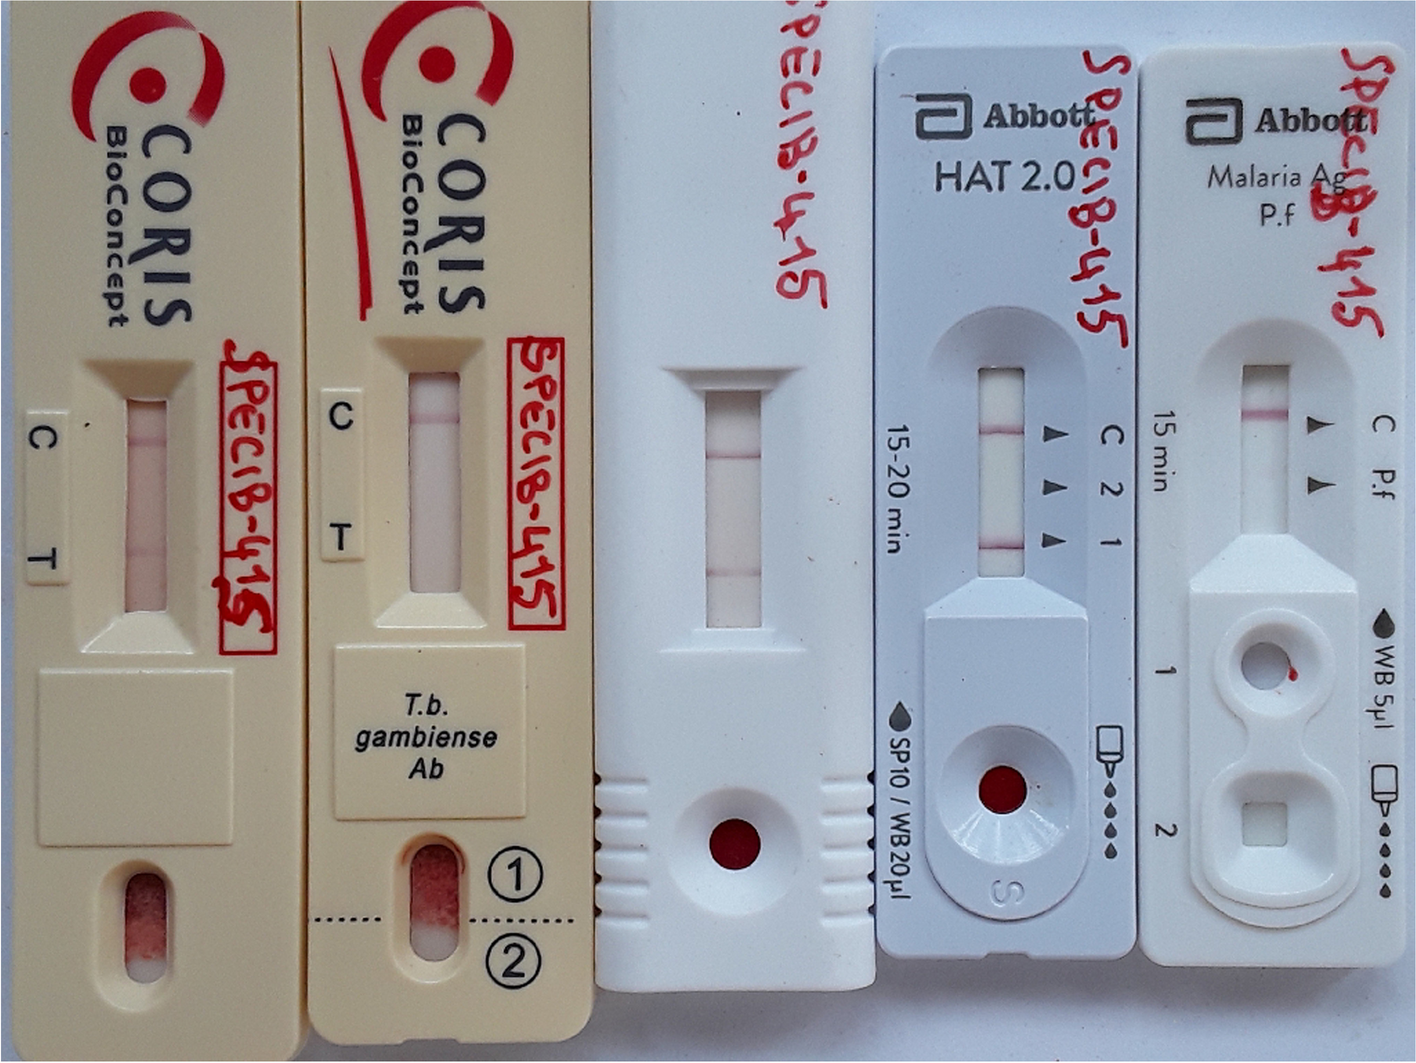
The gHAT serological screening tests CATT (Institute of Tropical Medicine, Antwerp, Belgium), Abbott Bioline HAT 2.0 (Abbott, Seoul, Republic of Korea), DCN HAT prototype (DCN, Carlsbad, USA), HAT Sero-K-Set (Coris BioConcept, Gembloux, Belgium), and HAT Sero-K-Set 2.0 prototype (Coris BioConcept, Gembloux, Belgium) were carried out in parallel, according to the instructions of the manufacturers. Diagnosis of malaria was performed with the Bioline Malaria Ag P.f. RDT (Abbott, Seoul, Republic of Korea). If one or more of the 5 gHAT serological screening tests was positive, a picture was taken of the RDT results, parasitological examination was performed (initiated within 1 h of blood collection) and a blood specimen was prepared for ulterior immunological and molecular reference laboratory tests.
For parasitological examination (reference test), 500 µl of heparinised blood was examined in the mini anion exchange centrifugation technique (mAECT) [24]. The mAECT column retains the blood cells, while trypanosomes, if present, flow through. The eluate is then collected in a special collector tube, which was centrifuged at 1500 × g for 10 min. The point of the collector tube was examined directly under the microscope at 100 × magnification for presence of trypanosomes. If mAECT was negative and palpable cervical lymph nodes were present, lymph was collected by lymph node puncture and a drop examined directly under the microscope at 400 × magnification. In the exceptional case of strong clinical suspicion, and if previous parasitological tests on blood and lymph remained negative, a lumbar puncture could be performed. In that case, cerebrospinal fluid was examined for the presence of trypanosomes in the modified simple centrifugation, and the white blood cell number was determined.
Dried blood spots (DBS) for the immunological laboratory tests were prepared by applying 12 spots of 30 µl of blood on Whatman grade 4 paper. The DBS were left to dry in the shadow and after drying, were packed individually in an envelope. Envelopes were packed by 10 in a plastic zip lock bag, to which 35 g of dry silicagel was added, after which the bag was closed hermetically. Specimens for molecular laboratory testing were prepared by mixing 1 ml of heparinized blood with 1 ml of DNA/RNA Shield 2 × buffer (Zymo Research, Irvine, USA). Tubes were frozen at -20 °C within 12 h and next stored at -80 °C.
Diagnosed HAT and malaria cases were treated by national programs according to the routine procedures in place in the country.
Retrospective scoring of HAT RDT test line intensitiesFor screening test positives, the intensity of the test lines of the gHAT RDTs was scored retrospectively based on the pictures taken in the field. Two readers, unaware of the field screening test results, independently scored all RDT test line intensities between zero (negative) and 4 (strongly positive) on the picture by comparison with a reference card [25]. If both readers had scored a line intensity the same, this score was retained. When both readers scored a line intensity differently, a third reader –unaware of previous scores- scored the intensity of all gHAT RDT lines on the picture of that seropositive again, and the final score became the intensity score given by 2 out of 3 readers, or, if 3 different scores had been given, the median of the 3 intensities.
Tests performed in the reference laboratoryImmunological reference laboratory testsTrypanolysis was carried out as previously described, using T.b. gambiense variant antigen type LiTat 1.3, LiTat 1.5 and LiTat 1.6 [19]. Trypanolysis was considered positive if the test specimen caused 50% lysis or more. The indirect ELISA/T.b. gambiense, using as antigens a mixture of LiTat 1.3 and 1.5 VSG, was carried out according to the standard protocol [13, 20]. Indirect ELISA/T.b. gambiense was considered positive if the percent positivity was 30% or more. The g-iELISA (apDia, Turnhout, Belgium) was carried out on LiTat 1.3 and on LiTat 1.5 VSG, according to the instructions of the manufacturer [14]. As test samples for the g-iELISA, 8 discs of 6 mm diameter were punched out from the DBS and eluted overnight in 400 μl of g-iELISA sample diluent. The specimen was considered positive in g-iELISA if the percent inhibition was ≥ 30%.
Molecular reference laboratory tests Total nucleic acids (TNA) extractionTNA were extracted from 300 µl of human blood in DNA/RNA 2 × Shield buffer (Zymo Research, Irvine, USA) with the Maxwell RSC DNA blood kit (Promega, Madison, USA) in the Maxwell RSC 16 automated system (Promega, Madison, USA), according to the manufacturer’s instructions. Purified TNA 40 µl aliquots were stored at -80°C.
PCRAll DNA extracts were analysed with the TBRN3 and 18S PCRs (Table 2), targeting Trypanozoon specific regions, and TgsGP PCR targeting the T.b. gambiense-specific glycoprotein as previously described with slight modifications [21,22,23]. A total volume of 25 μl, 5 μl TNA extract plus 20 μl of PCR mix (1 × Go Taq Green Master Mix, 0.5 µmol/L of primer in nuclease-free water), was used for amplification. Amplification was carried out in a SimpliAmp™ thermal cycler (Thermo Fisher Scientific, Waltham, USA) with the following parameters: an initial cycle of denaturation at 95 °C for 5 min, then 35 cycles consisting of denaturation at 95 °C for 45 s, hybridization at 50 °C (TBRN3 PCR) or 60 °C (18S and TgsGP PCR) for 45 s, and elongation at 72 °C for 45 s, and finally a last elongation cycle at 72°C for 5 min. Amplicons were separated by electrophoresis in 2% agarose gel stained with gelRed for 45 min at 100 V. The ChemiDoc TM imaging system (Bio-Rad, Hercules, USA) was used to visualize and record results. Fragment sizes were checked using the GeneRuler Ladder size marker (Thermo Fisher Scientific, Waltham, USA).
Table 2 PCR target genes and primers used in the study SHERLOCK assaysThe SHERLOCK assays were carried out as previously described [15]. Briefly, the RPA was performed with TwistAmp Basic kits (TwistDx, Maidenhead, UK) on the purified TNA using reverse transcriptase Transcriptor (Roche, Basel, Switzerland) and RPA primers specific for each target: 18S rRNA (T.b. 18S ribosomal RNA), 7SL (T.b. 7 spliced-leader RNA), TgsGP (T.b. gambiense specific glycoprotein) and RP (human RNase P POP7) (Table 3). The reactions were run for 45 min at 42°C in a heating block.
Table 3 SHERLOCK target genes, RPA primer regions and sequences, and DNA IVT region and sequence used for production of the crRNA guideSpecific crRNA guides were prepared by an in vitro transcription (IVT) step with a T7 RNA polymerase (Biosearch technology, Teddington, UK): specific DNA templates (Table 3) were in vitro transcribed using the HiScribe™ T7 Quick High Yield RNA Synthesis Kit (NEB, Ipswich, USA) and purified using magnetic beads (Agencourt RNAClean XP, Beckman, Brea, USA).
The detection step was carried out as previously described [15] using a purified home-made recombinant LwCas13a and the specific crRNA guides prepared as described above. The detection was run in triplicate in 384-well black-plates, F-bottom, μClearbottom (Greiner, Kremsmünster, Austria) at 37 °C in a plate reader (INFINITE F200 PRO Option Infinite F Nano + , TECAN, Männedorf Switzerland). Fluorescence values were recorded at initial time point and after 3 h of incubation.
The SHERLOCK RP assay was carried out first, to validate the quality of the TNA extractions from each sample, before testing the other targets. All reactions included a negative template control (NTC) with nuclease-free water as input, and a positive template control with in vitro transcribed target fragments specific of each SHERLOCK assay (18S Tids, 7SL Zoon, TgSGP) as well as TNA from T.b. brucei AnTat1.1E or T.b. gambiense ELIANE strain. For each sample, the fold-change over the NTC background fluorescence (FC) was calculated by dividing the sample by the NTC fluorescence value at 3 h. Thresholds for positivity were at FC ≥ 7.1 for RP, FC > 5 for 18S Tids, FC > 2.6 for 7SL Zoon and FC > 2.1 for TgsGP.
Trypanozoon-S2-RT-qPCRsThe Trypanozoon-S2-RT-qPCR reactions were run with 1 × qScript XLT ToughMix (Quantabio, Beverly, USA), using 300 nmol/L primers and 100 nmol/L of fluorescent labelled probes (LGC Biosearch Technologies, Hoddesdon, UK) for each of the four sets (Table 4). Conducted in a 20 µl volume using 5 µl of TNA extract, amplification occurred on a Q-qPCR magnetic induction cycler (Quantabio, Beverly, USA) at 95 °C denaturation for 10 min, followed by 40 cycles of 95 °C for 15 s and 60 °C for 60 s. Amplification analysis was performed using Q-qPCR 1.0.2 software (Quantabio, Beverly USA) using the dynamic method on automatic threshold settings. Prior analysis suggested a specificity cut-off for the Trypanozoon-S2-RT-qPCR 177T at 30 Cq, and 35 Cq for the Trypanozoon-S2-RT-qPCRs 18S2, GPI-PLC, and TgsGP.
Table 4 Trypanozoon-S2-RT-qPCR target genes, primers and probes RT-qPCRs DT8, DT9 and TgsGPProbes were defined from Tb927.10.8530 (DT8) and Tb927.10.1090 (DT9). For DT8, forward 5’-GCTTCTCCCGTTGATGTC-3’ and reverse 5’- AATATCGGTTACGTCGCC-3’ primers amplified a 212 bp fragment with HEX-CTCGCTCGCATGACTCAT-BHQ-1 as probe. For DT9, forward 5’-AACCCCTGGAGGACATC-3’ and reverse 5’-GCTTTGTACCGTCAGAAGA-3’ primers amplified a 144 bp fragment with FAM- CCGTGGTTGAATAGTGAACCG-BHQ-1 as probe. A third primers/probe set targeted the TgsGP gene as previously described [26]. The multiplex RT-qPCR conditions were as follows: 200 nmol/L primers and 400 nmol/L of fluorescent labelled probes (LGC Biosearch Technologies, Hoddesdon, UK) for each of the three sets were mixed with 1 × qScript XLT ToughMix (Quantabio, Beverly, USA) and 5 µl TNA extract in a 20 µl final volume. In a Q-qPCR magnetic induction cycler (Quantabio, Beverly, USA), after a 50 °C reverse transcription step for 10 min, followed by a 95 °C denaturation step for 10 min, amplification was performed by 40 cycles of 95 °C for 15 s and 60 °C for 60 s. Amplification analysis was performed using Q-qPCR 1.0.2 software (Quantabio, Beverly, USA) using the dynamic method on automatic threshold settings. Prior analysis suggested a specificity cut-off for the RT-qPCR DT8, DT9 and TgsGP sets at 35 Cq.
Data analysisFor the analysis of the study results, data from individuals who were not eligible but were included by accident, or with missing field test results (RDT or parasitology not carried out) were removed from the dataset. Test results, with the exception of gHAT RDT line intensities, were transformed into qualitative results in order to construct contingency tables. A participant was defined as a gHAT case if the presence of trypanosomes was demonstrated microscopically in lymph, blood or —if a lumbar puncture was carried out— in cerebrospinal fluid. A participant was defined as a malaria case if the Bioline Malaria Ag P.f. RDT was positive. All other participants were considered respectively gHAT negative or malaria negative. Statistical analyses were carried out in Graphpad Prism software version 10.0 (Boston, USA). The difference in age between individuals in Côte d’Ivoire and Guinea was assessed by an unpaired T test. Specificity of the RDT and laboratory tests was calculated with 95% Wilson Brown confidence intervals. Differences in fractions between groups (Côte d’Ivoire versus Guinea, or malaria positive versus malaria negative) were assessed by Chi square tests. Differences in specificity between 2 tests carried out on the same individuals were assessed by McNemar (Graphpad prism McNemar https://www.graphpad.com/quickcalcs/McNemar1.cfm). Agreement between test results was determined through calculating Cohen’s kappa coefficient (ƙ) (Graphpad prism https://www.graphpad.com/quickcalcs/kappa1/) [27].
留言 (0)