
記住我


Medium-pressure liquid chromatography (Pure C-850 Flash prep®, Buchi, Switzerland) with UV-ELSD detection connected to reversed phase flash columns (Flash pure C18, 40 μm, 4 and 12 g) was used for final purification. DRX-600 spectrometer (Bruker Daltonics, USA) was used to record nuclear magnetic resonance (NMR) spectra. “Waters” 3100 “USA", TQ Detector (Acquity ultra performance LC), Mass lynx V 4.1 was used for ESI–MS spectra.
Drugs, chemicals and kitsRotenone was obtained from Sigma-Aldrich and it was dissolved in DMSO (dimethyl sulfoxide). From Sigma-Aldrich in USA, other reagents and chemicals of analytical grade were purchased. There were five Eliza kits obtained from Sunlong Biotech Co. LTD in this study.
Plant material and botanical identificationThe leaves of Pentas lanceolata were collected from Al-Orman Botanical Garden in November 2021, Giza, Egypt. The plants were botanically identified by Treas Labib, Herbarium Section, El-Orman Botanical Garden, Giza, Egypt. The identification was confirmed by Dr Reem Sameer Hamdi, professor of plant taxonomy and flora, Faculty of Science, Botany Department (Cairo University). In our laboratory, a sample of the studied plant is being maintained under the accession number (No. 2021-P.5).
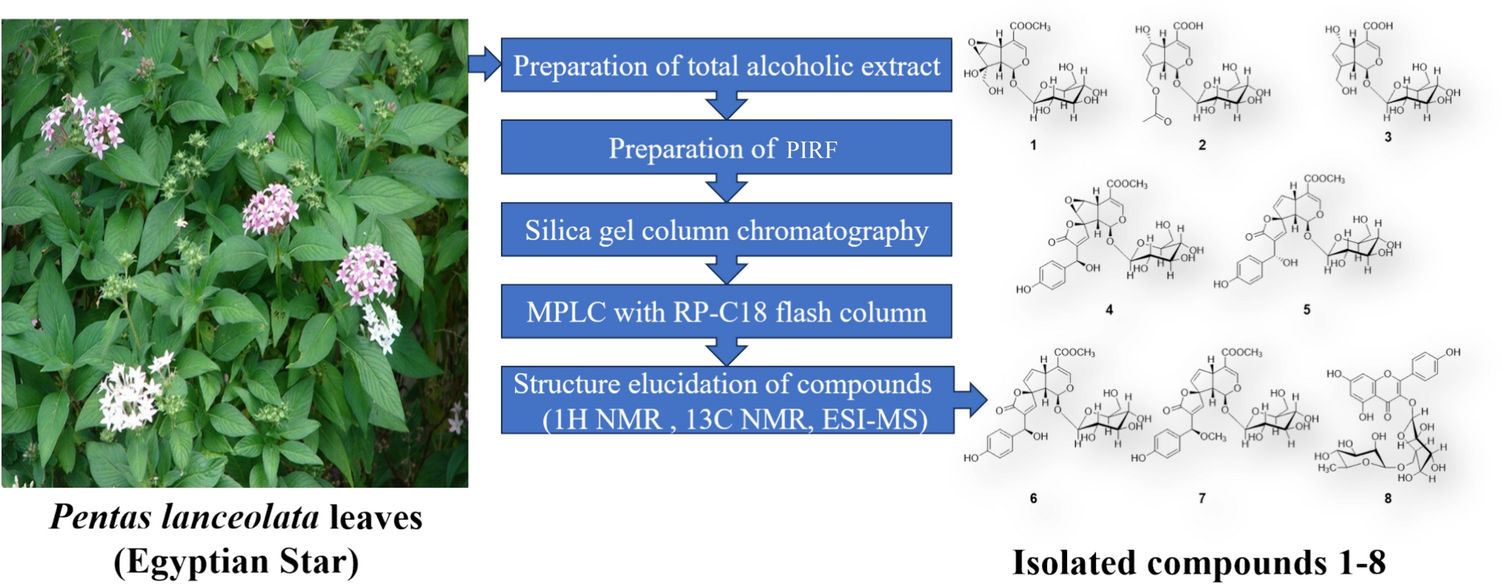
Extraction and isolation of compoundsThe extraction was carried out according to the method of Abd-Alla et al. (2022) and the preparation of iridoids-rich fraction (PIRF) has been performed according to our previous work (Fahmy et al. 2020). A brownish-green dry fraction (PIRF, 17.32 g) was stored at 4 °C until use. Part of PIRF (11 g) was subjected to column chromatography (80 cm × 80 mm packed with 320 g silica gel 60–120 mesh Merck) eluted with an elution system of dichloromethane: methanol (9:1) to give rise of two main fractions (A and B). Fraction A (400 mg) rechromatographed on silica gel (22.0 g). Methanol/ chloroform system was used as mobile phase. The column was conditioned with methanol/chloroform 0.5:9.5, v/v and the chromatographic run started with mixture 9: 1 (v/v). Gradually, the polarity was increased to finally to 3:7, v/v to afford three subfractions (Fr.A-1 to Fr. A-3). Fr. A-1 (eluted with methanol/chloroform 1:9, v/v) was further subjected to medium pressure liquid chromatography (MPLC) with RP-C18 flash column (4 g) and eluted with methanol/water (MeOH/H2O) gradient to yield compound 1 (eluted with 7% MeOH/H2O, 2 mg) and compound 8 (eluted with 40% MeOH/ H2O, 2.4 mg). Fr. A-2 (eluted with chloroform/methanol 8.5:1.5, v/v) was purified by preparative TLC on silica plated with dichloromethane-MeOH- H2O (8:2:0.2) to yield compound 2 (9 mg). On Sephadex LH-20, Fr. A-3 (chloroform/methanol 8:2, v/v) was purified and 50% MeOH/ H2O was used as elution system to afford compound 3 (7.8 mg). Fraction B (150 mg) was purified using MPLC with RP-C18 flash column (12 g) and eluted with MeOH/ H2O gradient to yield compound 4 (eluted with 20% MeOH/ H2O, 8.0 mg), compound 5 (eluted with 25% MeOH/ H2O, 5.8 mg), compound 6 (eluted with 30% MeOH/ H2O, 20.2 mg) and compound 7 (eluted with 40% MeOH/ H2O, 7.5 mg). Direct comparison with standard compounds available in our laboratory and/or comparison with literature data were used for the identification of all the isolated compounds. Figure 1 shows the design of extraction and isolation of compounds of iridoids-rich fraction from Pentas lanceolata leaves (PIRF).
Fig. 1
Design of extraction and isolation of compounds of iridoids-rich fraction from Pentas lanceolata leaves (PIRF)
6β,7β-Epoxy-8-epi-splendoside (1): 1H NMR (600 MHz, CD3OD), δ 7.48 (d, J = 1.5 Hz, H-3, 1H), 5.77 (1H, s, H–l), 4.57 (d, J = 7.9 Hz, H–l", 1H), 3.88 (dd, J = 12.0, 2.0 Hz, H-6"a, 1H), 3.81 (d, J = 2.6 Hz, H-6, 1H), 3.74 (s, -COOMe, 3H), 3.68 (d, J = 11.7 Hz, H-10a, 1H), 3.65 (dd, J = 12.0, 5.9 Hz, H-6"b,, 1H), 3.51 (d, J = 2.6 Hz, H-7, 1H), 3.48 (d, J = 11.7 Hz, H-10b, 1H), 3.33–3.23 (H-5", H-4", and, H-3", overlapped with solvent signal, H-5), 3.13 (dd, J = 9.0, 8.1 Hz, H-2", 1H), 2.33 (d, J = 8.8 Hz, H-9, 1H); 13C NMR (150 MHz, CD3OD), δ 33.2 (C-5), 46.4 (C-9), 51.8 (COOMe), 57.9 (C-6), 60.8 (C-7), 62.8 (C-6"), 65.2 (C-10), 71.6 (C-4"), 74.5 (C-2"), 77.9 (C-5"), 78.4 (C-3"), 80.6 (C-8), 93.8 (C-1), 99.8 (C-1"),107.7 (C-4), 154.2 (C-3), 168.4 (C-11); ESI- MS: m/z 443.11 [M + Na].
Asperulosidic acid (2): 1H NMR (600 MHz, CD3OD), δ 7.41 (d, J = 1.4 Hz, H-3, 1H), 5.98 (d, J = 1.5 Hz, H-7, 1H), 4.97 (d, J = 8.9 Hz, H-1, 1H), 4.94 (d, J = 15.0 Hz, H-10a, 1H), 4.90 (dd, J = 6.0, 1.6 Hz, H-6, 1H), 4.81 (d, J = 15.0 Hz, H-10b, 1H), 4.72 (d, J = 7.9 Hz, H–l'', 1H), 3.83 (dd, J = 12.0, 1.5 Hz, H-6"a, 1H), 3.61 (m, H-6"b, 1H), 3.23–3.38 (H-2", H-3", H-4", and H-5", overlapped with solvent signal), 3.05 (t, J = 6.9 Hz, H-5, 1H), 2.58 (t, J = 8.1 Hz, H-9, 1H), 2.09 (s, CH3CO, 3H); 13C NMR (150 MHz, CD3OD), δ 20.7 (CO-Me), 43.8 (C-5), 46.9 (C-9), 63.0 (C-6"), 64.0 (C-10), 71.6 (C-4"),75.1 (C-2"),76.1 (C-6), 77.8 (C-5"),78.5 (C-3"), 100.5 (C-1"), 100.8 (C-1), 107.4 (C-4), 131.7 (C-7), 146.1 (C-8), 151.4 (C-3), 170.3 (C-11), 172.6 (CO-Me); ESI–MS: m/z 455.05 [M + Na]+.
Deacetyl-asperulosidic acid (3): 1H NMR, (600 MHz, CD3OD), δ 7.61 (s, H-3, 1H), 6.02 (d, J = 1.5 Hz, H-7, 1H), 5.05 (d, J = 8.9 Hz, H-1, 1H), 4.82 (H-6, 1H), 4.72 (d, J = 7.9 Hz, H–l", 1H), 4.46 (dd, J = 15.5, 1.1 Hz, H-10a, 1H), 4.22 (d, J = 15.5 Hz, H-10b, 1H), 3.85 (dd, J = 12.2, 1.8 Hz, H-6"a, 1H), 3.62 (dd, J = 12.0, 5.8 Hz, H-6"b, 1H), 3.39 (t, J = 8.8, H-5", 1H), 3.22–3.29 (3H, m, H-2", H-3"and H-4", 3H), 3.02 (t, J = 6.6 Hz, H-5, 1H), 2.56 (t, J = 7.9 Hz, H-9, 1H); 13C NMR (150 MHz, CD3OD), δ 172.0 (C-11), 154.6 (C-3), 151.5 (C-8), 129.8 (C-7), 109.6 (C-4), 101.4 (C-1), 100.4 (C-1"), 78.5 (C-3"), 77.8 (C-5"), 75.6 (C-6), 75.0 (C-2"), 71.7 (C-4"), 62.9 (C-6"), 61.7 (C-10), 46.0 (C-9), 43.0 (C-5). ESI–MS: m/z 413.28 [M + Na]+.
13R-epi-Epoxygaertneroside (4): 1H NMR (600 MHz, CD3OD) δ 7.55 (d, J = 1.6 Hz, H-3, 1H), 7.22 (d, J = 8.6 Hz, H-2', H-6', 2H), 7.04 (d, J = 1.5 Hz, H-10, 1H), 6.77 (d, J = 8.6 Hz, H-3', H-5', 2H), 5.40 (d, J = 1.2 Hz, H-13, 1H), 5.33 (brs, H-1, 1H), 4.54 (d, J = 7.9 Hz, H-1", 1H), 4.03 (d, J = 2.5 Hz, H-7, 1H), 3.85 (dd, J = 11.8, 1.2 Hz, H-6"a, 1H), 3.77 (s, -COOMe, 3H), 3.70 ( m, H-6"b, 1H), 3.46 (d, J = 7.6 Hz, H-5, 1H), 3.35 (d, J = 2.5 Hz, H-6, 1H), 3.12–3.35 (H-2", H-3", H-4", and H-5", overlapped with solvent signal), 2.77 ( dd, J = 8.3, 1.1 Hz, H-9, 1H); 13C NMR (150 MHz, CD3OD), δ 33.0 (C-5), 43.6 (C-9), 51.9 (COOMe), 57.8 (C-7), 59.2 (C-6), 62.5 (C-6"), 69.6 (C-13), 71.3 (C-4"), 74.4 (C-2"), 77.8 (C-5"),78.4 (C-3"),92.6 (C-8), 92.8 (C-1), 99.6 (C-1"), 108.0 (C-4), 116.3 (C-3', C-5'), 129.3 (C-2', C-6'), 133.0 (C-1'), 140.5 (C-11), 148.0 (C-10), 153.9 (C-3), 158.6 (C-4'), 168.0 (C-14), 171.7 (C-12); ESI- MS: m/z 587.13 [M + Na].
Gaertneroside (5): 1H NMR (600 MHz, CD3OD) δ 7.51 (d, J = 1.6 Hz, H-3, 1H), 7.45 (d, J = 1.3 Hz, H-10, 1H), 7.28 (d, J = 8.5 Hz, H-2', H-6', 2H), 6.78 (d, J = 8.5 Hz, H-3', H-5', 2H), 6.47 (dd, J = 5.6, 2.5 Hz, H-6, 1H), 5.56 ( dd, J = 5.6, 2.2 Hz, H-7, 1H), 5.36 (d, J = 1.2 Hz, H-13, 1H), 5.15 (d, J = 4.9 Hz, H-1, 1H), 4.67 (d, J = 7.9 Hz, H-1", 1H), 3.91 (m, H-5, 1H), 3.79 (dd, J = 12.1, 2.2 Hz, H-6"a, 1H), 3.75 (s, -COOMe, 3H), 3.69 (m, H-6"b, 1H), 3.21–3.38 (H-2", H-3", H-4", and H-5", overlapped with solvent signal), 2.90 (dd, J = 7.6, 4.9 Hz, H-9, 1H); 13C NMR (150 MHz, CD3OD), δ 40.3 (C-5), 50.8 (C-9), 51.9 (COOMe), 62.2 (C-6"),69.9 (C-13), 70.9 (C-4"),74.4 (C-2"),77.8 (C-5"),78.4 (C-3"), 94.4 (C-1), 98.0 (C-8), 100.5 (C-1"),110.9 (C-4), 116.3 (C-3'/C-5'), 129.6 (C-2'/ C-6'), 129.9 (C-7), 133.2 (C-1'), 137.9 (C-11), 141.6 (C-6), 150.1 (C-10), 152.5 (C-3), 158.6 (C-4'), 168.4 (C-14), 172.4 (C-12); ESI- MS: m/z 547.14 [M-H]−.
13R-epi-Gaertneroside (6): 1H NMR (600 MHz, CD3OD) δ 7.48 (d, J = 1.5 Hz, H-3, 1H), 7.25 (d, J = 1.3 Hz, H-10, 1H), 7.21 (d, J = 8.6 Hz, H-2', H-6', 2H), 6.77 (d, J = 8.6 Hz, H-3', H-5', 2H), 6.45 (dd, J = 5.6, 2.6 Hz, H-6), 5.47 (dd, J = 5.6, 1.8 Hz, H-7, 1H), 5.40 (d, J = 1.0 Hz, H-13, 1H), 5.35 (d, J = 3.8 Hz, H-1, 1H), 4.65 (d, J = 7.9 Hz, H-1", 1H), 3.90 (m, H-5, 1H), 3.88 (dd, J = 11.8, 1.0 Hz, H-6"a, 1H), 3.74 (s, -COOMe, 3H), 3.65 (m, H-6"b, 1H), 3.36 ( m, H-3", 1H), 3.28–3.30 (H-4", and H-5", overlapped with solvent signal), 3.22 (dd, J = 9.2, 8.0 Hz, H-2", 1H), 3.00 (dd, J = 7.9, 3.9 Hz, H-9, 1H); 13C NMR (150 MHz, CD3OD), δ 39.9 (C-5), 50.6 (C-9), 51.9 (COOMe), 62.6 (C-6"), 69.5 (C-13), 71.4 (C-4"), 74.5 (C-2"), 77.8 (C-5"), 78.5 (C-3"), 93.8 (C-1), 97.9 (C-8), 99.8 (C-1"), 111.4 (C-4), 116.3 (C-3'/C-5'), 129.2 (C-2'/C-6'), 130.1 (C-7), 133.2 (C-1'), 137.9 (C-11), 141.0 (C-6), 150.5 (C-10), 152.2 (C-3), 158.5 (C-4'), 168.4 (C-14), 172.4 (C-12); ESI- MS: m/z 547.14 [M-H]−.
13R-Methoxy-epi-gaertneroside (7): 1H NMR (600 MHz, CD3OD) δ 7.49 (d, J = 1.3 Hz, H-3, 1H), 7.30 (brs, H-10, 1H), 7.19 (d, J = 8.5 Hz, H-2', H-6', 2H), 6.77 (d, J = 8.5 Hz, H-3', H-5', 2H), 6.45 ( dd, J = 5.6, 2.5 Hz, H-6, 1H), 5.45 (dd, J = 5.6, 1.9 Hz, H-7, 1H), 5.34 (d, J = 4.4 Hz, H-1, 1H), 4.95 (brs, H-13, 1H), 4.67 (d, J = 7.9 Hz, H-1", 1H), 3.90 (m, H-5, 1H), 3.86 (m, H-6"a, 1H), 3.75 (s, -COOMe, 3H), 3.65 (m, H-6"b, 1H), 3.27–3.39 (H-3", H-4",H-5" and -OCH3, overlapped with solvent signal), 3.22 (1H, d, J = 9.0 Hz, H-2", 1H), 2.97 (dd, J = 7.7, 4.4 Hz, H-9, 1H); 13C NMR (150 MHz, CD3OD), δ 40.2 (C-5), 50.7 (C-9), 51.9 (COOMe), 57.2 (-OCH3), 62.8 (C-6"), 71.5 (C-4"), 74.6 (C-2"), 77.8 (C-5"), 78.5 (C-3"), 78.9 (C-13), 93.9 (C-1), 98.0 (C-8), 99.8 (C-1"), 111.3 (C-4), 116.4 (C-3'/C-5'), 129.8 (C-2'/C-6'), 129.9 (C-7), 130.2 (C-1'), 135.8 (C-11), 141.3 (C-6), 150.9 (C-10), 152.4 (C-3), 158.9 (C-4'), 168.4 (C-14), 172.3 (C-12); ESI- MS: m/z 561.14 [M-H]−.
Kaempferol-3-O-robinobioside (8): 1H NMR (600 MHz, CD3OD) δ 8.09 (d, J = 8.8 Hz, H-2', 6', 2H), 6.88 (d, J = 8.8 Hz, H-3', 5', 2H), 6.38 (d, J = 1.8 Hz, H-6, 1H), 6.19 (d, J = 1.8 Hz, H-8, 1H), and 5.02 (d, J = 7.8, H-1", 1H), 4.52 (brs, H-1"', 1H), 1.18 (d, J = 6.3, H-6"', 3H). 13C NMR (150 MHz, CD3OD) δ 17.91 (C-6'''), 67.4 (C-6''), 69.7 (C-4''), 70.2 (C-5'''), 72.1 (C-3'''), 72.3 (C-2'''), 73.0 (C-2''), 73.9 (C-4"'), 75.1 (C-3"), 75.4 (C-5"), 95.3 (C-8), 100.5 (C-6), 101.9 (C-1"'), 105.1 (C-1"), 105.7 (C-10), 116.1 (C-3'/C-5'), 122.7 (C-1'), 132.4 (C-2'/C-6'), 135.7 (C-3), 158.7 (C-9), 159.1 (C-2), 161.6 (C-4'), 162.9 (C-5), 167.8 (C-7), 179.4 (C-4); ESI–MS m/z: 593.15 [M-H]−
Experimental design of in vitro and in vivo studiesAs shown in Fig. 2, the experimental design of in vitro and in vivo studies was carried out.
Fig. 2
Experimental design of in vitro and in vivo anti-parkinsonian study. DMSO, Dimethylsulfoxide, PIRF, The iridoids-rich fraction isolated from Pentas lanceolata leaves, Rot, Rotenone
In vitro studies on BDNF and NGFThe human colonic epithelial cell line (Caco-2) and human astrocytoma cell (1321N1) were incubated and maintained in Dulbecco's Modified Eagle Medium with high glucose (DMEM) with 10% fetal bovine serum (FBS). At a density of 0.5 × 10⁵ cells/well, the cells were incubated in 24-well plate in a humidified atmosphere (at 37 °C) and containing 5% CO2.
At 24 h after seeding, cells were treated with each sample of PIRF dissolved in dimethyl sulfoxide (DMSO) solution. After 24 h, cells were collected, and then total RNA was extracted from the cultured cells using PureLink RNA Mini kit (Invitrogen, CA, USA). The cDNA strand was synthesized from 400 ng of total RNA using ReverTra Ace qPCR RT Master Mix (TOYOBO, Osaka, Japan). THUNDERBIRD SYBR qPCR Mix (TOYOBO, Osaka, Japan) was used for quantitative real-time PCR. Real-time PCR was performed using AriaMX Real-time PCR System (Agilent Technologies, CA, USA) under the following conditions: 3 min (at 95 °C), followed by 40 cycles for 3 s (each of 95 °C), for 30 s (60 °C). Primers used for amplification were as follows: GTCAAGTTGGGAGCCTGAAATAGTG and AGGATGCTGGTCCAAGTGGTG for BDNF, ACCTTTCTCAGTAGCGGCAA and TGTGTCACCTTGTCAGGGAA for NGF and GGGTCAGAAGGACTCCTATG and GTAACAATGCCATGTTCAAT for β-actin as an internal control. PCR products were analyzed using AriaMx Real-time PCR System Software.
Experimental design of the in vivo studyWe have five groups with eleven male mice in each one: Control group receiving vehicle (DMSO), induced group using rotenone (1.5 mg/kg, three times a week), the last three groups received rotenone together with one of the following oral treatments: L-Dopa (reference drug, 25 mg/kg), 50 mg /kg PIRF, 100 mg /kg PIRF.
AnimalsMale mice were divided into five groups. They were housed with free access to standard chow diet and water at humidity (60 ± 10%), constant temperature (25 ± 2 °C), and a 12/12-h light/dark cycle. According to the guidelines for the Care and Use of Laboratory Animals published by the US National Institutes of Health (NIH Publication No. 85–23, revised 2011), the investigation was carried out. It was performed in agreement with ethical procedures approved by the Ethics Committee of Safety and Health Committee in NRC (Ethics number: 04420124).
MethodologyInduction of PDThe method of Abdel-Salam et al. (2014) was used for rotenone-induced PD. Rotenone (dose of 1.5 mg/kg/day) was given as a solution after dissolving in DMSO, via the S.C. route (for 3 weeks, three times/ week) to make a total of nine doses. Starting from the first day of rotenone, the treatment with L-dopa or PIRF (50 or 100 mg/kg) will be given orally daily for 21 consecutive days.
Behavioral studyTwenty-four hours after the last treatment day, three behavioral tests were accomplished to assess motor functions in mice, specifically stair test, wood-walking test, and wire-hanging test (El-Shamarka et al. 2020).
Stair testThe stair test aims to assess skilled motor coordination. Briefly, at the bottom of a wooden stair, each mouse was added. From the experimental bench, they were placed at an angle of 55 °C. For each mouse, the time spent climbing the stairs three times was recorded.
Wood-walking testThe mice were allowed to walk along a wooden stick (1 m long and 1 cm thick). For each mouse, the time spent reaching the end of the stick is recorded to assess motor coordination (three trials for each mouse).
Wire-hanging testIt is also called the horizontal bar test. It is done by hanging the mice from a steel rod by their forelimbs, placed 25 cm above the bench. The rod was 0.2 cm in diameter and 25 cm long. For each mouse, the time could stay hanging itself suspended from the rod is the latency time. For three trials, the latency time (with a cut-off time of 60 s) was recorded.
Tissue samplingUsing urethane, the mice were anesthetized at the end of behavioral tests and were killed by cervical dislocation. The right and left striata are detached directly after rapid separation of the brains. They were kept on ice and kept at − 80 °C for further handling. In each group, five brains are collected from 5 mice. A homogenizer (yellow line, DI18 basic, Germany) was used to homogenize the right striatum in phosphate buffered saline (PBS; 0.1 M, pH = 7.4) to prepare 20% homogenate. A cooling centrifuge (Sigma 3–30 k, USA) was used to centrifuge the homogenate (1000 xg for 15 min at 4 °C). The supernatant was kept at − 80 °C for further colorimetric assay of antioxidants. In ice-cold saline, the left striatum is homogenized to prepare 25% w/v homogenate of each mouse. The homogenate was centrifuged at 4 °C for 20 min. at 1000 xg and stored at − 80 °C for additional ELISA of TNF-α, IL-1β, Ach E, β- amyloid and MCP-1. Then three brains from each group were homogenized in methanol (HPLC grade), then centrifuged and the supernatant was kept at -80 for determination of dopamine level using HPLC technique. Alternatively, in well-sealed containers, the rest three brains are separately immersed in formalin solution (10%) in normal saline and kept for histopathological investigation after tissue hardening.
Biochemical parametersDetermination of reduced glutathione (GSH content)Briefly, Ellman´s reagent or 5,5'-dithiobis (2-nitrobenzoic acid) (DTNB) is reduced by the free sulfhydryl group on GSH molecule to generate 5- thio-2-nitrobenzoic acid which has yellow color and can be determined by reading absorbance at 412 nm (Ellman 1959).
Lipid peroxidation determinationThe product of lipid peroxidation; malondialdehyde (MDA) was measured according to the method of Nair and Turner (1984). The absorbance (at λ532 nm) was recorded using a spectrophotometer for the product of thiobarbituric acid-forming TBA-MDA adducts reacted with thiobarbituric acid reactive substances (TBAS).
Nitric oxide content determinationGriess reagent was used for measuring the nitric oxide (NO) content (Moshage et al. 1995). By nitrate reductase, the nitrate is converted to nitrite. Nitrite is converted to a deep purple azo compound by Griess reagent. The absorbance was measured at by a spectrophotometer (at λ 540 nm). As an indicator to produce nitric oxide, nitrite was mostly used as a stable end-product of nitric oxide radical.
ELISA of TNF-α, IL-1 β, AchE, β- amyloid and MCP-1Estimation of striatal TNF-α, IL-1, AchE, β- amyloid and MCP-1 were performed using ELISA technique by test kits obtained from Sunlong Biotech Co. LTD with the following catalogue number: SL0722Ra, SL0402RA, SL0027Ra, SL1392Ra, SL0497Ra according to manufacturer instructions based on the sandwich principle by the aid of ELISA reader (Model Spectra Max Plus-384 Absorbance Microplate Reader, USA).
Determination of dopamine contentDopamine was analyzed in brain supernatant using Dionex Ultimate 3000 UHPLC (Thermo Scientific, USA). The separation was carried out on Zorbax Eclipse XDB C18 (4.6X150 mm, 5 µm). The mobile phase was phosphate buffer (pH, 3.0): methanol (80:20, v/v) at flow rate 0.5 ml/min. The detection wavelength was 270 nm.
Histopathological studyTissues are hardened for at least 7 days. The sections of striata were stained after preparation according to method of Bancroft and Steven (1983). For 1 h, these sections were washed with water. The hardened sections were dehydrated in graded concentrations of ethanol. In melted paraffin wax, the cleared specimens (in xylene) are then embedded. Drying (for 4–6 h) of sample was carried out in an oven at 70 °C. The sections of tissue (3–5 μm thick) were prepared by rotary microtome. The routine hematoxylin and eosin (H and E) stain was used for staining.
Statistical analysisThe statistical analysis was done using one-way analysis of variance (ANOVA) test. Data are expressed as means ± standard error of the mean (SEM). ANOVA test was followed by Tukey–Kramer post hoc test to compare all means pairwise. This was accomplished by the aid of statistical package for social sciences computer software version 22 (SPSS Inc., Chicago, USA). A P-value less than 0.05 is typically considered to be statistically significant.
留言 (0)