
記住我


This was a single-group exploratory safety and tolerability study conducted with patients attending the Northern Cancer Institute in Sydney and the Icon Cancer Centre in Hobart, Australia. Changes in intestinal dysbiosis assessed by faecal testing and changes in systemic inflammatory markers were assessed by blood tests. The study sought to enrol 30 men and women into the pilot trial on satisfying inclusion and exclusion criteria and upon signing/written informed consent.
At baseline, participants were required to provide:
1.Faecal samples for FMA (faecal microbial analysis) to assess the microbiome characterisation.
2.Non-fasting blood samples, to be collected for gut permeability biomarkers including serum lipopolysaccharide levels (LPS) to evaluate intestinal dysbiosis.
Ethical approvalThe National Institute of Integrative Medicine Human Research Ethics Committee (EC00436) granted protocol approval coded as NIIM HREC Reference number: 0043E_2017 on 26th of November 2018. This study was carried out according to the Declaration of Helsinki. The study was conducted in compliance with all stipulations of the protocol, the conditions of ethics committee approval, the NHMRC National Statement on Ethical Conduct in Human Research (2007) and the Note for Guidance on Good Clinical Practice (CPMP/ICH-135/95), and the International Conference on Harmonisation Good Clinical Practise guidelines. The trial was registered on the Australian New Zealand Clinical Trial Registry (ACTRN12618000927224).
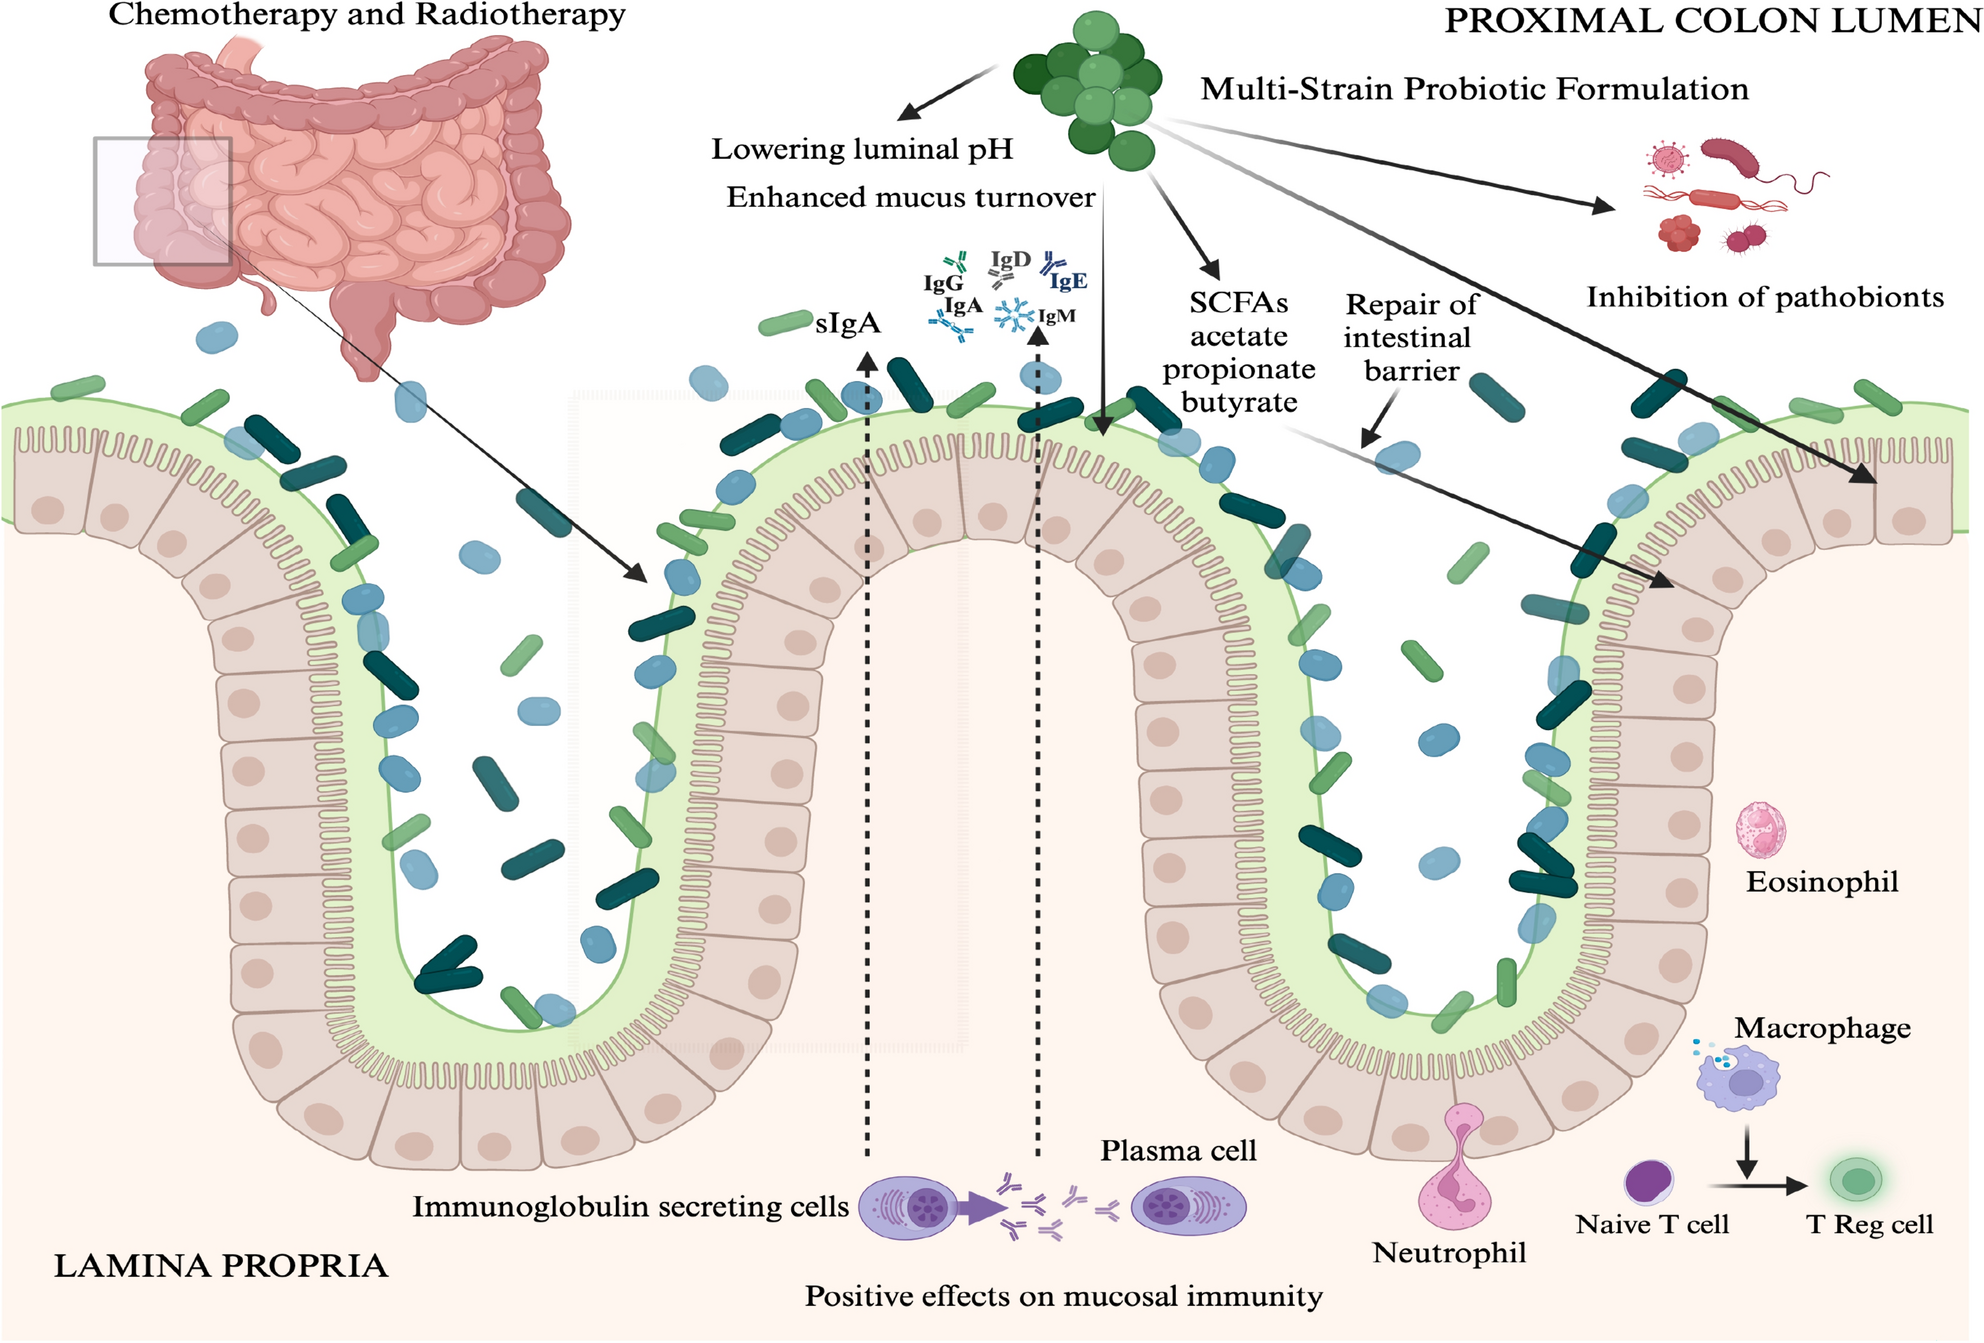
InterventionA daily dose of four capsules of a multi-strain probiotic formulated and supplied by Medlab Clinical Ltd (MultiBiotic™) was administered by clinical trial participants following a baseline faecal sample collection. Faecal and blood samples were also collected from participants at a midpoint of their cancer treatment and at the end of treatment.
The investigational product was labelled as MultiBiotic™ (i.e. with a Therapeutic Goods Administraiton listing of ARTG 227562) described as a multi-genera and multi-species probiotic formulation developed by research scientists at Medlab Clinical Ltd positing to provide support for gastrointestinal health maintenance. Multibiotic™ contains three species of Lactobacillus bacteria, three species of Bifidobacterium bacteria and Streptococcus thermophilus. The Multibiotic formulation contained a total of 21.075 billion Colony Forming Units (CFU) per capsule (Table 1).
Table 1 The study drug was a multi–species probiotic formulation containing seven bacterial species that was ARTG listed with the Therapeutic Goods Administration in AustraliaThe IP was manufactured in accordance with Good Laboratory Practice (GLP) and Good Manufacturing Practice (GMP) for toxicological and clinical studies, respectively. The intellectual property (IP) was produced utilising Medlab Clinical’s patent protected probiotic formulation. Manufacturing and validation of the IP was assigned under agreement to Nutribiotech Co Ltd., South Korea, whilst packaging and labelling was assigned to South Pack Laboratories Pty Ltd in NSW, Australia. Nutribiotech holds all relevant licences to manufacture in accordance with the Therapeutic Goods Administration (TGA) guidelines.
The IP was supplied in a volume of 60 hard capsules in a sealed glass bottle. The average fill weight of each capsule was 280 mg and the average total capsule weight was 325 mg ± 7.5%. The IP presents as a hardshell capsule size 1 containing a fine off white speckled free-flowing powder. The IP was stored between 2°¾8° C away from direct heat and sunlight. The IP was packeged in 115 mL brown glass bottles with tamper proof lids, packaged into cartons of 10 bottles and shipped under ambient conditions to the clinical trial sites (Fig. 2).
Fig. 2
CONSORT Diagram of a single arm exploratory pilot study
Participant inclusion and exclusion criteriaThe inclusion criteria included (i) adult patients diagnosed with cancer and who were chemotherapy naïve or about to commence a new chemotherapy regimen due to disease progression; (ii) were aged 18 to 75 years; determined to have a life expectancy of more than 12 months; (iii) there was absence of any psychological, familial, sociological, or geographical conditions, which could potentially hamper compliance with the study protocol and follow-up schedule; (iv) participants agreed to comply with the study protocol; and agreed to participate following a signed and written informed consent.
Participant exclusion criteria included (i) active infections treated by antibiotic therapy; (ii) hypersensitivity to the study drug (i.e. Probiotics); (iii) any concurrent malignancy other than non-melanoma skin cancer; (iv) serious concomitant systemic disorders or diseases incompatible with the study; (v) patient has a history of primary psychological disorder; (vi) and illicit drug use.
Faecal bacterial DNA extraction and sequencingStool samples were collected using a stool specimen collection kit. This collection kit included instruction for the stool sample collection, gloves, a sterile container, and sealed plastic pouch. Participants brought the stool sample to the clinic. Samples were stored at − 20 °C at the study centres before being transfer to the laboratory. DNA was obtained from human faecal material by using the QIAamp® DNA Stool Mini Kit (QIAGEN LTD. West Sussex, UK) and the Qiacube according to manufacturer’s guidelines. The samples of 200 mg were added to 1 ml InhibitEx buffer in labelled 2 ml microcentrifuge tubes stored in ice. Vortexed for 1 min and heated at 70 °C for 5 min. Then vortexed for 15 s before being centrifuged at 20,000 G/14,000 rpm for 1 min to pellet stool particles. 200 ml of supernatant aliquoted into the labelled microcentrifuge tubes. Whole-genome sequencing. The quantity and quality of the extracted DNA was determined using the Implen NanoPhotometer® (LabGear, Australia). DNA samples were stored at − 80 °C until analysis.
DNA was sequenced on the MiSeq 16S Metagenomics system using 300 bp paired reads and the MiSeq v3 reagents which sequences the V3 and V4 regions of the 16S rRNA gene (Illumina, Australia). Post-sequencing, Illumina’s BaseSpace metagenomics workflow was used to perform taxonomic classification based on the Greengenes database. This workflow demultiplexes indexed reads, generates FASTQ files, and then classifies reads at several taxonomic levels ranging from kingdom to species.
Faecal microbial analysisDue to COVID restrictions stool collection kit was mailed to participants. This collection kit includes instruction for the stool sample collection, gloves, a sterile container, and sealed plastic pouch. Participants were instructed to store the stool samples in their freezer at − 20° C and return it to the researchers soon after using a freezer bag. Samples were subsequently stored at ICON cancer centre at − 20° C.
Stool samples were collected from patients using the QIAamp® DNA Stool Mini Kit (QIAGEN Ltd. West Sussex, UK) and the Qiacube automated extractor according to the manufacturer’s guidelines. DNA extraction was be performed using the QIAamp DNA stool kit and faecal microbial composition was identified by sequencing the 16S rRNA using the Illumina next-generation sequencing system.
Blood biochemistryShort chain fatty acidsBlood samples were collected from 26 study participants following the method described. Twenty-six patients provided baseline samples. Twenty participants completed the study and provided a final blood sample for analysis.
A GC–MS method, with minor modifications from published methods, was employed to determine the level of SCFA in plasma samples (Garcia-Villalba et al. 2012; Juanola et al. 2019). A modified GC–MS method for analysis of SCFAs (i.e. acetic acid, propionic acid, butyric acid, iso-butyric acid and iso-valeric acid) using acetic acid-d4 stock solution as an internal standard was developed to provide a standard assay testing method for SCFAs in plasma collected from participants from two study centres. Quantitative and qualitative determination of SCFAs was performed on GC equipped with an automatic liquid sampler and coupled with an Agilent mass selective detector.
Analysis was performed using an Agilent 7890A gas chromatography system coupled to an Agilent 5975C inert XL EI/CI mass spectrometric detector (MSD, Agilent Technologies, Sydney, Australia). The column used was a high polarity, polyethylene glycol, fused silica capillary column Agilent J&W DB-WAXETR (30 m × 0.25 mm id × 0.25 μm film thickness).
Helium was used as the carrier gas at a flow rate of 1 mL/min. Injection was made in the spitless injection mode with an injection volume of 1 mL and an injector temperature of 250 °C. The column temperature was kept initially at 70 °C, increased to 100 °C at a rate of 10 °C/min and kept at 100 °C for 0.5 min increased to 130 °C at 6 °C/min and kept at 130 °C for 0.5 min increased to 180 °C at 10 °C/min and then increased to 220 °C at 40 °C/min., and kept at 220 °C for 1 min (total run time = 16 min). Solvent delay was 4 min.
The detector was operated in electron impact ionisation mode (electron energy 70 eV), scanning in the 30–250 m/z range. Mass spectral data was collected in SIM mode for quantification. Temperature of the ion source, quadrupole and interface was 230 °C, 130 °C and 250 °C respectively. Identification of acetic acid, acetic acid-d4, propionic acid, butyric acid, iso-butyric acid, and iso-valeric acid was based on the retention time of standard compounds and with the assistance of NIST MS library.
Identification of acetic, propionic, butyric, acids was based on the retention time of standard compounds and quantified using the Agilent Mass Hunter Quantitative version 8.07.00 software with the assistance of NIST MS search 2 libraries. Quantification of each SCFA was based on calibration curves obtained from increasing concentrations of standards diluted in ethyl acetate.
A characteristic single ion was selected for the quantification of each compound: acetic acid 60.1 m/z, acetic acid–d4 63 m/z, propionic acid 74 m/z, iso-butyric acid 88 m/z, and butanoic acid 73 m/z and iso-valeric acid 87 m/z.
The use of extracted ion chromatograms (EICs) for area calculation and quantification reduced the possibility of misinterpreting overlapping peaks.
Lipopolysaccharides (LPS)Metabolic endotoxemia was determined by measuring plasma LPS using a commercially available kit (Pierce™ Limulus amoebocyte lysate chromogenic endotoxin quantification kit from Thermo Fisher, Sydney, NSW, Australia) (Thermofisher-Scientific 2021). The LAL Chromogenic endotoxin quantitation kit measures the amount of endotoxin in a sample using the limulus amebocyte Lysate (LAL) assay. The endotoxin concentration is measured via a chromogenic (photometric) signal generated in the presence of endotoxins. The photometric signal is read by a microplate reader.
Analysis was performed in duplicate according to the kit manufacturer’s instructions. Six mL of blood was collected in EDTA-plasma tubes, immediately placed at 4 °C and then centrifuged for 15 min at 1000 × g (or 3000 rpm) at 2–8 °C.
Plasma samples were aliquoted in endotoxin-free tubes using endotoxin-free pipette tips and stored at –80ºC. Assay was performed in a prewarmed 96-well plate and maintained at 37 °C throughout the assay.
Plasma samples were diluted 50-fold in endotoxin-free water. Diluted samples, blank and endotoxin Standard dilutions (50 μL) were dispensed in each well. Freshly reconstituted Limulus Amebocyte Lysate (50 μL) was added to each well. The plate was shaken to aid mixing and incubated at 37 °C for 25 min.
Following incubation prewarmed (37 °C) chromogenic substrate (100 μL) was added to each well, and incubation was extended for an additional 6 min at 37 °C. The reaction was stopped by adding 25% glacial acetic acid (50 μl). Absorbance was measured using a 96-well plate reader at 405 nm (Thermo-Fisher-Scientific 2021).
Food frequency questionnaireThe EPIC-Norfolk Food Frequency Questionnaire was used to record and score nutritional intake during the cancer treatments as quintiles of fruit, vegetables and total fibre consumed during the study period, and values compared to previously published data (Bradbury et al. 2014). Due to COVID-restrictions the questionnaire was mailed to participants, and they were requested to return it via surface mail.
Statistical analysisData were presented descriptive, as mean (95% CI) or median (95% CI) where appropriate. unless otherwise stated. Data were tested for normality of the distribution, and statistical analysis was performed with the statistical software STATA (version 17, Texas, USA) and GraphPad Prism 10 (California, USA).
The Functional Assessment of Cancer Therapy–C (FACT–C) questionnaire was used to assess participants physical, emotional, social, and functional wellbeing. Comparison between the various FACT–C domains was carried out using the Wilcoxin signrank matched pairs test to determine positive or negative changes in scores at baseline and the end of treatment. The Z score and the p-significance indicated if there was a significant difference in median baseline vs. post-end of treatment rank scores (Table 3). Furthermore, the data were presented in graph form to show median scores changes with treatment progression [Graph Pad Prism (version 10.0)] (Figs. 3A–F).
The EPIC-Norfolk Food Frequency Questionnaire utilises the FFQ EPIC Tool for Analysis (FETA) to calculate nutrient and food group data from the entered food frequency questionnaires (FFQ). Excel table was further analysed by the FETA software application licenced under the General Public Licence, version 2 (GPL v.2).
Compositional changes in patients’ intestinal microbiomes were assessed by Linear Discriminate Analysis (LDA) effect size (LEfSE). The analysis found no significant differences after FDR corrections after a log LDA threshold cut-off of 2, Kruskal–Wallis p value < 0.05 for any taxon. Adonis function in R (version 3.2) was used for the statistical analysis of the relative abundances of bacterial genera beta-diversity as calculated by Brady–Curtis dissimilarities. Principal Coordinates Analysis (PCoA) was graphically shown using a 2D distribution. Permutational Multivariate Analysis of Variance (PERMANOVA) was carried out at the phyla and species levels.
留言 (0)