
記住我

Altogether 45 patients were enrolled. Details of clinical characteristics and infection foci have been described earlier [17]. Twenty-seven patients (60%) were male and 18 (40%) female. The mean and median age was 55 years. The most common underlying conditions were obesity (31%) and hypertension (31%), while 40% of the patients had no previously diagnosed chronic conditions. 20% (9/45) of patients were in Charlson class 0, 42% (19/45) in class 1, 13% (6/45) in class 2 and 24% (11/45) in class 3.
The most common infectious focus was soft tissue infection (51%). Thirteen cases (29%) needed intensive care. Eight patients (18%) died before the follow-up visit: four within a week from hospital admission, and an additional three later during hospitalization. One patient died over a month after the acute phase.
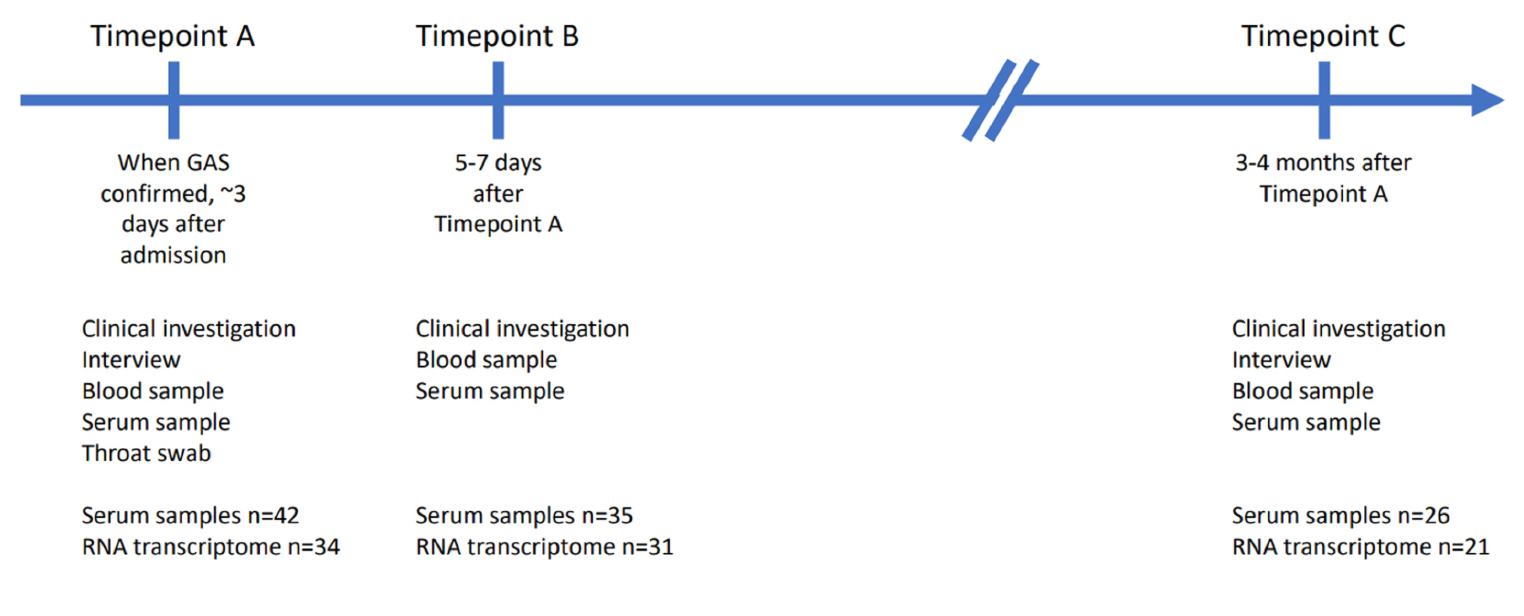
Sufficient PAXgene samples were acquired from 41 cases at timepoint A, 35 at timepoint B and 26 at timepoint C. Serum samples were obtained from 42 patients at timepoint A, 35 at timepoint B and 26 at timepoint C (Fig. 1).

Figure 1 Overview of the study design. When GAS was isolated from blood or other normally sterile site, the patient would be recruited, interviewed, assessed clinically, and a throat swab, serum, and whole blood (PAXgene Blood RNA tube, BD) to be used for transcriptome analysis would be obtained (timepoint A). Five to seven days later a second blood test was taken (timepoint B). Three to four months after recruitment each patient was invited for a follow up visit to obtain a third blood test to represent the patients’ transcriptome in a recovered state (timepoint C). The numbers of RNA transcriptome samples represent the samples that were left after disregarding impure or insufficient samples.
Transcriptome analysis resultsAfter quality trimming of the RNA samples, 94 were subject to transcriptomic analysis. Eight out of the 94 samples were disqualified for further analysis due to low spike-in reads or low 5’-end capture rates in the protein-coding genes, suggesting assay failure. The remaining 86 qualified samples included 34, 31, and 21 subjects at timepoints A, B and C, respectively.
Out of the 15,589 protein-coding genes and spike-in RNAs yielding sequence, 5,476 genes with biological variation in the qualified samples at each timepoint were selected [Fig. 2a] and classified into ten modules by WGCNA according to the expression correlation [Fig. 2b]. The modules were arbitrarily assigned a color code as an identifier. Although the genes selected from the timepoints were similar, the Uniform Manifold Approximation and Projections (UMAP) of these selected genes suggested large timepoint-dependent effects and associations with disease severity (Supplementary Fig. 1).
Fig. 2
Overview of the transcriptome data. (A) 5,476 genes altered in timepoints A, B and C. Each scatter plot represents the significantly altered genes (black) in each timepoint compared to the technical variations of the spike-in RNAs (red). Y axes are the coefficient of variation, X axes are normalized mean expressions. (B) Modules (row header, color names) and the number of the selected genes in each group and at each timepoint. Genes in the grey group are unclassifiable
Together with the grouping of the selected genes, a summary expression profile of each timepoint, consisting of the color-coded modules, was estimated and compared with nine binary and four quantitative clinical traits (Fig. 3a). We focused primarily on severe disease, death and need for intensive care at timepoint A, representing the acute phase.
At timepoint A, severe disease was most strongly associated with low expression levels of genes in the brown module. The same association was found with acute kidney injury. The ten genes with the strongest association with severe disease in the brown module were related to natural killer cell (NK cell) functions or otherwise to cytolytic immunity (Fig. 3b) [25,26,27,28,29,30,31,32]. Of these, low expression level of CCL5 had the strongest correlation to severe disease (AUC 0.92, 0.82-1.00 in 95% CI; Fig. 4). Low expression levels of the brown module were also associated with a high Charlson comorbidity index, as well as older age, and higher C-reactive protein (CRP) and leukocyte values. The second strongest associations with severe disease were high expression of the genes in the turquoise and red modules (Supplementary Tables 1 and 2). High expression of the turquoise module also associated with acute kidney injury, hypotension and high CRP and leukocyte counts (Fig. 3a). Expression levels of two genes, one from brown and the other one from turquoise or red, at timepoint A had an even stronger association with severe disease (Supplementary Table 3), but these associations were less robust because of the number of events per variable (EPV) was less than 20 as would be ideal for a two gene analysis [24].
Fig. 3
Associations between the color-coded modules and single genes in the brown module. (A) Associations of the modules with correlating gene expression levels, and the clinical traits at timepoint A. The severe disease category is highlighted. The color gradient signifies values of -log10(P) * sig(r), where P is P-value of a correlation coefficient between expression levels of a module and clinical parameters, r is the correlation coefficient, and sig(r) is 1 if r > 0 (= positive correlation) and − 1 if r < 0 (= negative correlation). The exclamation marks signify statistical significance, * = p < 0.05, ** = p < 0.005, *** = p < 0.0005. WGCNA = weighted gene correlation network analysis, Obesity = BMI ≥ 30 kg/m2, CRP = C-reactive protein, Leuc = leucocyte count, CCI = Charlson comorbidity index, TPA = timepoint A. (B) Top 10 associations of low expression of single genes with severity in the brown module and their functions.
Fig. 4
Receiver operating characteristic curves of CCL5 expression compared to CRP. AUC and the 95% CI are beside the legends. At 90% specificity, the sensitivity of CCL5 expression for severe disease is 80%, whereas for CRP it is 45%
The yellow and magenta modules (Fig. 3b; Supplementary Table 4) were associated with death and intensive care, respectively. High expression of the yellow module was strongly linked to death, and low expression of the magenta to need for intensive care, although the EPVs were also less than 10.
None of the top ten genes in the brown module carried the associations over to timepoints B or C, nor did the top ten genes in the turquoise or red module.
CCL5 measurementAs the transcriptome data showed low CCL5 expression to be associated with severe disease, the soluble CCL5 concentrations were measured from the serum samples collected at all three timepoints. CCL5 concentration was measured from 103 serum samples from 42 enrolled patients: 42 subjects at timepoint A, 35 at timepoint B and 26 at timepoint C. Twenty-five patients had serum available from all three timepoints, timepoints A + B from 10 subjects, timepoints A + C from one subject and solely timepoint A from six subjects.
Median CCL5 concentration of the whole population increased significantly from timepoint A to timepoint B (median 72.8 vs. 115 ng/ml, respectively, p < 0.0001, Fig. 5a and b). CCL5 concentration was still significantly elevated at timepoint C compared with timepoint A (98.6 vs. 72.8 ng/ml, respectively, p = 0.0178, Fig. 5b). At timepoint A, when comparing CCL5 concentrations from only cases with available transcriptome data, there was a statistically significant difference between CCL5 levels among the 11 severe and 23 nonsevere cases (46.2 ng/ml vs. 81.8 ng/ml, respectively, p = 0.046, Fig. 5c).
The four patients with the lowest serum levels at timepoint A all had severe disease. Of the cases in the lowest 25 percentile (< 47ng/ml) of CCL5 levels with or without transcriptome data at timepoint A, 7/10 were in the severe disease group. The correlation coefficient for the expression level and serum concentration was 0.336 (p = 0.052). Median CRP concentrations were also statistically significantly different between the severe and nonsevere groups at each timepoint.
Fig. 5
CCL5 concentrations measured from the serum samples of the patients at timepoints A (n = 42), B (n = 35) and C (n = 26). (A) Individual cases CCL5 concentration trends. p-values: Paired t-test. (B) Dots represent the patients whose samples were included in the RNA transcriptomic analysis, triangles represent patients with missing transcriptome data. Red indicates severe disease. Black line indicates the median. p-values: Mann-Whitney U test. (C) Comparison between CCL5 concentration of the severe and nonsevere groups in the three timepoints, included are only cases with available transcriptome data. At timepoint A there is a statistically significant difference in CCL5 concentrations between severe (11 cases) and nonsevere (23 cases) groups (46.2 vs. 81.8 ng/ml, respectively, p = 0.0456). Black line indicates the median. p-values: Mann-Whitney U test. (D) Comparison of C-reactive protein concentrations between the severe and nonsevere groups in the three timepoints. All cases with available C-reactive protein concentration data shown. Black line indicates the median. p-values: Mann-Whitney U test
留言 (0)