Study design
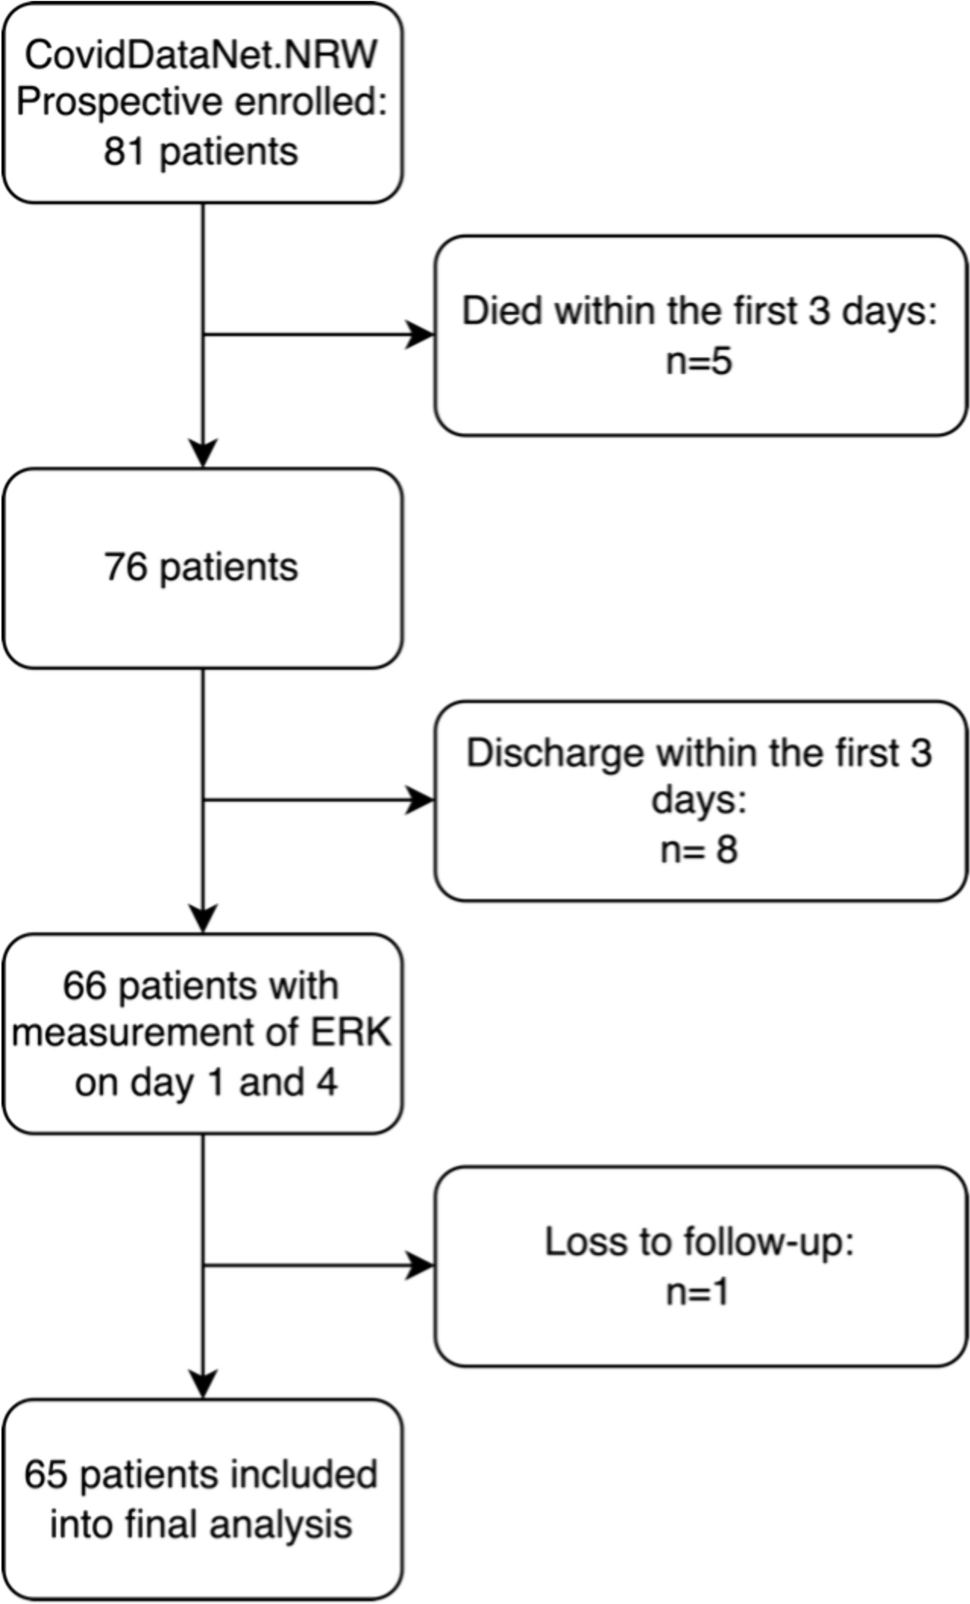
The multicentric CovidDataNet.NRW study (German Clinical Trial Registry No. DRKS00026184) prospectively enrolled patients with sepsis because of a COVID-19 infection, meeting the sepsis-3 criteria. These patients were recruited from the Intensive Care Units (ICUs) of three distinct university hospitals situated in the German state of North Rhine-Westphalia. Ethical approval for this study was granted by the Ethics Committee of the Medical Faculty of Ruhr-University Bochum (Registration No. 18–6606–BR) or the relevant ethics committee at each respective study center. Patients were recruited between March 1, 2020 and October 30, 2022.
This study encompassed adult patients diagnosed with COVID-19-induced sepsis within the preceding 36 h, in accordance with the current sepsis-3 definition, which requires a suspected or proven infection along with a Sequential Organ Failure Assessment (SOFA) score increase of at least two points. The patient cohort comprised a mix of surgical and medical cases admitted to the ICU. Exclusion criteria included: (1) age less than 18 years at the time of ICU admission, (2) withdrawal or withholding of consent, and (3) discontinuation of treatment. Patients with an unknown 30-day survival status were excluded from subsequent analysis.
Clinical data and patient characteristics
Electronic medical data, including vital signs, laboratory results, point-of-care diagnostics, demographic information, and the duration of ICU or hospital stays, were meticulously captured within a comprehensive database using CentraXX software, developed by Kairos GmbH in Bochum, Germany. This data collection process adhered to the pseudonymization procedures mandated by the ethics committee.
In cases of missing data, a qualified physician at each respective clinic conducted individual patient record investigations. Where deemed appropriate, data from ± 12 h of sepsis onset were included to ensure completeness. The SOFA scores were manually calculated by experienced physicians at each recruitment site. SARS-CoV-2 PCR Test were performed via nasopharyngeal swaps by the attending physicians and cycling time values (CT value) were reported. The number of cycles was limited to 40. If no viral RNA was detected by that time, the patient was considered negative. Throughout their ICU stay, each patient underwent comprehensive microbiological monitoring, which included surface swabs, tracheal secretions, urine cultures, and bronchial secretions or bronchoalveolar lavage where feasible. If a pathogen was detected and deemed in need of treatment by the attending physician (i.e., with no evidence of contamination or colonization), the patient was classified as superinfected. The findings were stratified according to the day of sample collection (during the overall ICU stay versus after day 4).
Extraction of peripheral blood mononuclear cells (PBMCs)
Blood was drawn from the patients at study inclusion and after 4, 8 and 14 days. Peripheral blood mononuclear cell (PBMCs) were isolated from EDTA stabilized blood samples using Ficoll density gradient centrifugation (GE Healthcare Europe, Freiburg, Germany). The phase containing PBMCs was collected and washed with PBS. Subsequent to erythrocyte lysis, and PBS (phosphate buffered saline) washing, the PBMCs were stored at – 196 °C until use. Upon thawing, cells were counted, spun onto microscopic slides using a cytospin (Cellspin II, Tharmac, Wiesbaden, Germany), and then fixed using 4% formaldehyde solution.
Proximity ligation assay for pERK
The Proximity Ligation Assay (PLA) to assess the phosphorylation level of ERK was performed as described previously [21]. Briefly, PBMCs were permeabilized using 1% Triton-X in PBS. Partial unfolding of the target proteins was done by incubating the slides with 1% SDS in PBS. After subsequent washing slides were blocked using the Duolink Block (Sigma). Primary antibodies against ERK (1:100, #4696, Cell Signaling Technology, Danvers, MA) and pERK (1:100, #4370, Cell Signaling Technology) were incubated at 4 °C over night. After another round of washing, we incubated the slides with secondary proximity probes (anti-mouse and anti-rabbit, NaveniFlex 100 MR, Navinci Diagnostics, Uppsala, Sweden) for 1h at 37 °C. The Unfold PLA reaction was conducted as per manufacturers recommendations (Navinci Diagnostics). After mounting the slides with slow fade antifade reagent (S36940, Thermo Fisher) and counterstaining the nuclei with DAPI we evaluated the pERK level using a IX51 Microscope (Zeiss, Germany).
Image analysis
Analysis of the images was undertaken using FIJI and the Cell Profiler software. First, maximal intensity projections were performed and channels were merged using FIJI. The images were then imported to Cell Profiler where the modules primary object identification, secondary object identification and relate object modules were used to quantify the PLA signals per cell. As we did no cytoplasmic counterstain, we estimated a cell to be of 30 pixel diameter around the nucleus. Only slides with at least 50 cells were evaluated.
Cytokine measurements
The following cytokines were measured on day 1 and day 4 by a customized human LegendPlex assay (BioLegend, San Dieago, CA): Inteleukin-1 beta (IL-1b), Interleukin-6 (IL-6), Interleukin-10 (IL-10), Interleukin-18 (IL-18), Interferon gamma (INF-γ), tumor necrosis factor alpha (TNF-α), Interferon alpha2 (INF-α2).
Plasma proteomics
The liquid chromatography-tandem mass spectrometry (LC–MS/MS) analyses were conducted as described before [22]. Briefly, plasma samples were prepared according to the SP3 protocol [23] and analyzed using an Ultimate 3000 RSLCnano HPLC coupled to an Orbitrap Exploris 240 mass spectrometer (both Thermo Scientific). The peptides were separated using a 37 min gradient from 4 to 28% acetonitrile in 0.1% formic acid and were measured using data independent acquisition. DIA-NN (v.1.8) was used for protein quantification with an in-house created spectral-library generated from plasma DDA measurements with FragPipe (v.17.1).
Statistics
Continuous variables are presented as means ± standard deviation in the case of normal distribution and as median and interquartile range (25th; 75th percentile) in the case of non-normally distributed variables. The statistical analyses were performed using the software R (R version 3.5.3; The R Foundation for Statistical Computing; http://www.R-project.org). A two-sided p-value < 0.05 was considered statistically significant. Confidence intervals (CIs) were calculated with 95% coverage.

留言 (0)