
記住我
Serum concentration of adropin was measured using enzyme-linked immune-sorbent assay (ELISA) according to SinogeneClon Biotech Co.
Assessment of fibroblast growth factor-1, Acidic (FGF-1)Fibroblast growth factor-1 was determined using the enzyme-linked immunosorbent assay (ELISA) DLdevelop kits.
Estimation of the level of Toll-like receptor-1(TLRs)Level of Toll-like receptor-1(TLRs) in the serum estimated according to R&D Systems, Minneapolis, MN, USA, using ELISA Kit, Catalogue Number:SL4063Hu.
Gene expression of TNF-α geneReal-time quantitative PCR techniqueIsolation of RNA and reverse transcription (RT) process
In accordance with the manufacturer's instructions, total RNA was isolated from the blood cells of control individuals and patients with inflammatory bowel disease (IBD) using the RNeasy Mini Kit (Qiagen, Hilden, Germany) supplemented with DNaseI (Qiagen) digestion step. After digesting DNA residues with one unit of RQ1 RNAse-free DNAse (Invitrogen, Germany), isolated total RNA was resuspended in water treated with DEPC, and photospectrometry at 260 nm was used to measure the results. A total RNA sample's purity was determined by measuring its 260/280 nm ratio, which ranged from 1.8 to 2.1. Additionally, formaldehyde-containing agarose gel electrophoresis was used to ensure integrity through the analysis of the 28S and 18S bands using ethidium bromide stain [13]. Aliquots were kept at -80 °C unless they were used right away for reverse transcription (RT).
RevertAid™ First Strand cDNA Synthesis Kit (Fermentas, Germany) was used to reverse transcribe complete Poly(A) + RNA isolated from blood cells into cDNA in a total volume of 20 µl. A master mix comprising 50 mM MgCl2, 10 × RT buffer, 10 mM of each dNTP, 50 µM oligo-dT primer, 20 IU ribonuclease inhibitor (a 50 kDa recombinant enzyme to inhibit RNase activity), and 50 IU MuLV reverse transcriptase was used in conjunction with 5 µg of total RNA. The RT reaction was conducted using the method of 10 min at 25 °C and 1 h at 42 °C. [14] and concluded with a 5-min denaturation step at 99 °C. The reaction tubes holding the RT preparations were then flash-cooled in an ice chamber prior to being utilized for quantitative real-time polymerase chain reaction (qRT-PCR) cDNA amplification.
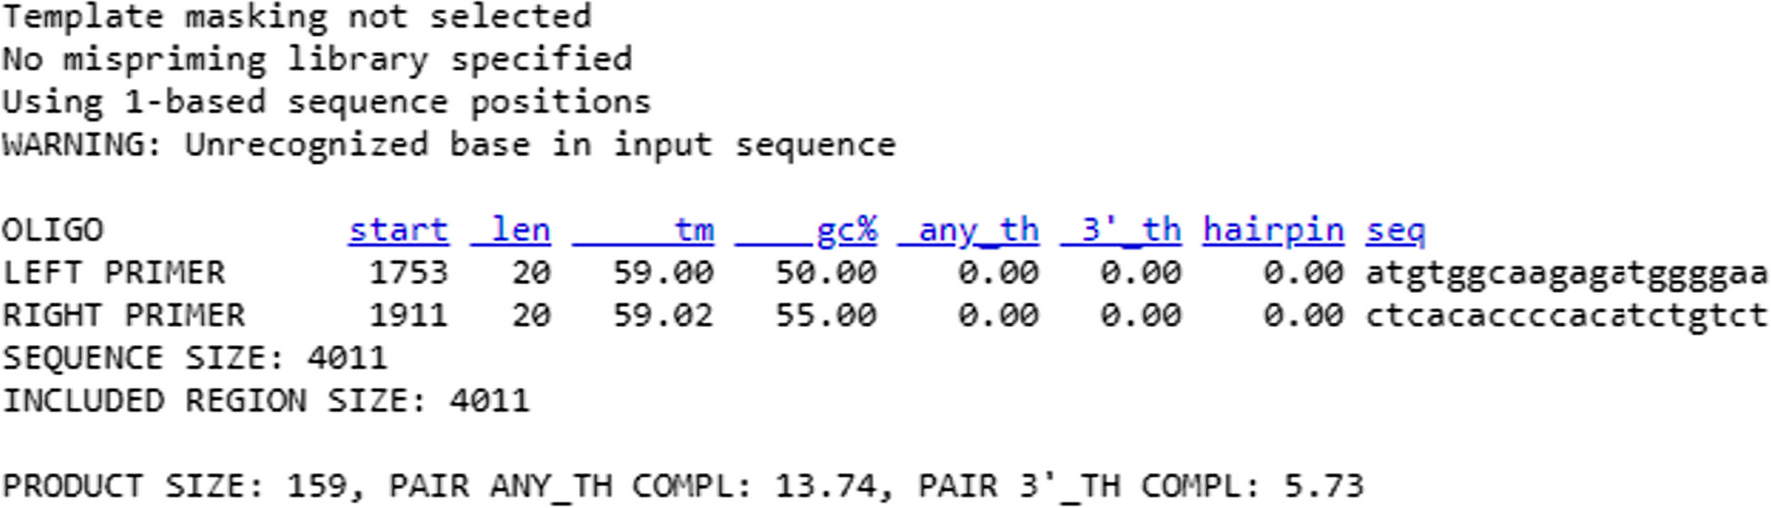
Real-time PCR (qPCR)Using the StepOneTM Real-Time PCR System from Applied Biosystems (Thermo Fisher Scientific, Waltham, MA USA), the cDNA copy number of blood cells was determined. 6.5 µL of distilled water, 5 µL of cDNA template, 12.5 µL of 1 × SYBR® Premix Ex TaqTM (TaKaRa, Biotech. Co. Ltd.), 0.5 µL of 0.2 µM sense primer, 0.5 µL of 0.2 µM antisense primer, and 0.5 µL of distilled water were used to set up the PCRs in 25 µL reaction mixtures [15]. There were three steps assigned to the response program. The first step was three minutes at 95.0 °C. The second step comprised 40 cycles, with each cycle being divided into three steps: (a) 15 s at 95.0 °C, (b) 30 s at 55.0 °C, and (c) 30 s at 72.0 °C. The third step consisted of 71 cycles which started at 60.0 °C and then increased about 0.5 °C every 10 s up to 95.0 °C. A control of distilled water was included in every experiment. The sequences of specific primer of the cytokine gene tumor necrosis factor alpha (TNF-α) was designed and is listed in Tables 2. The 2−ΔΔCT method was utilized to ascertain the target's relative quantification in relation to the reference [13].
The primer blast results are as follows:

As the primer was designed, we got the annealing temperature which was used in the qRT-PCR program. Due to qRT-PCR accuracy and sensitivity versus conventional PCR, melt curve analysis provides the most confidence instead of gel electrophoretic in assessment of primer specificity. So, according to the following obtained melting curve from the current experiment indicating that the single peak observed for an amplicon from TNF-α specific primers (Fig. 1) is typically interpreted as representing a pure, single amplicon which is more accurate than the gel electrophoretic.
Fig. 1
Metling curve of TNF-α specific primers
Statistical analysisThe statistical SPSS software for Windows, version 20.0 (SPSS, USA), was used to analyze the data. The means ± standard deviation (SD) is presented for the results. Data that were not paired were compared using the independent sample t test. P-values less than 0.05 were regarded as noteworthy.
留言 (0)