Gene expression profile data collection
Two profiling datasets, GSE123342 (n = 22 for healthy people and n = 170 for STEMI patients) and GSE59867 (n = 44 for healthy people and n = 390 for STEIMI patients), were obtained from the NCBI Gene Expression Omnibus database (GEO, https://www.ncbi.nlm.nih.gov/geo/). The raw data underwent preprocessing through background correction and quantile normalization utilizing a robust multi-array average algorithm [6].
Selection of key m6A methylation regulators
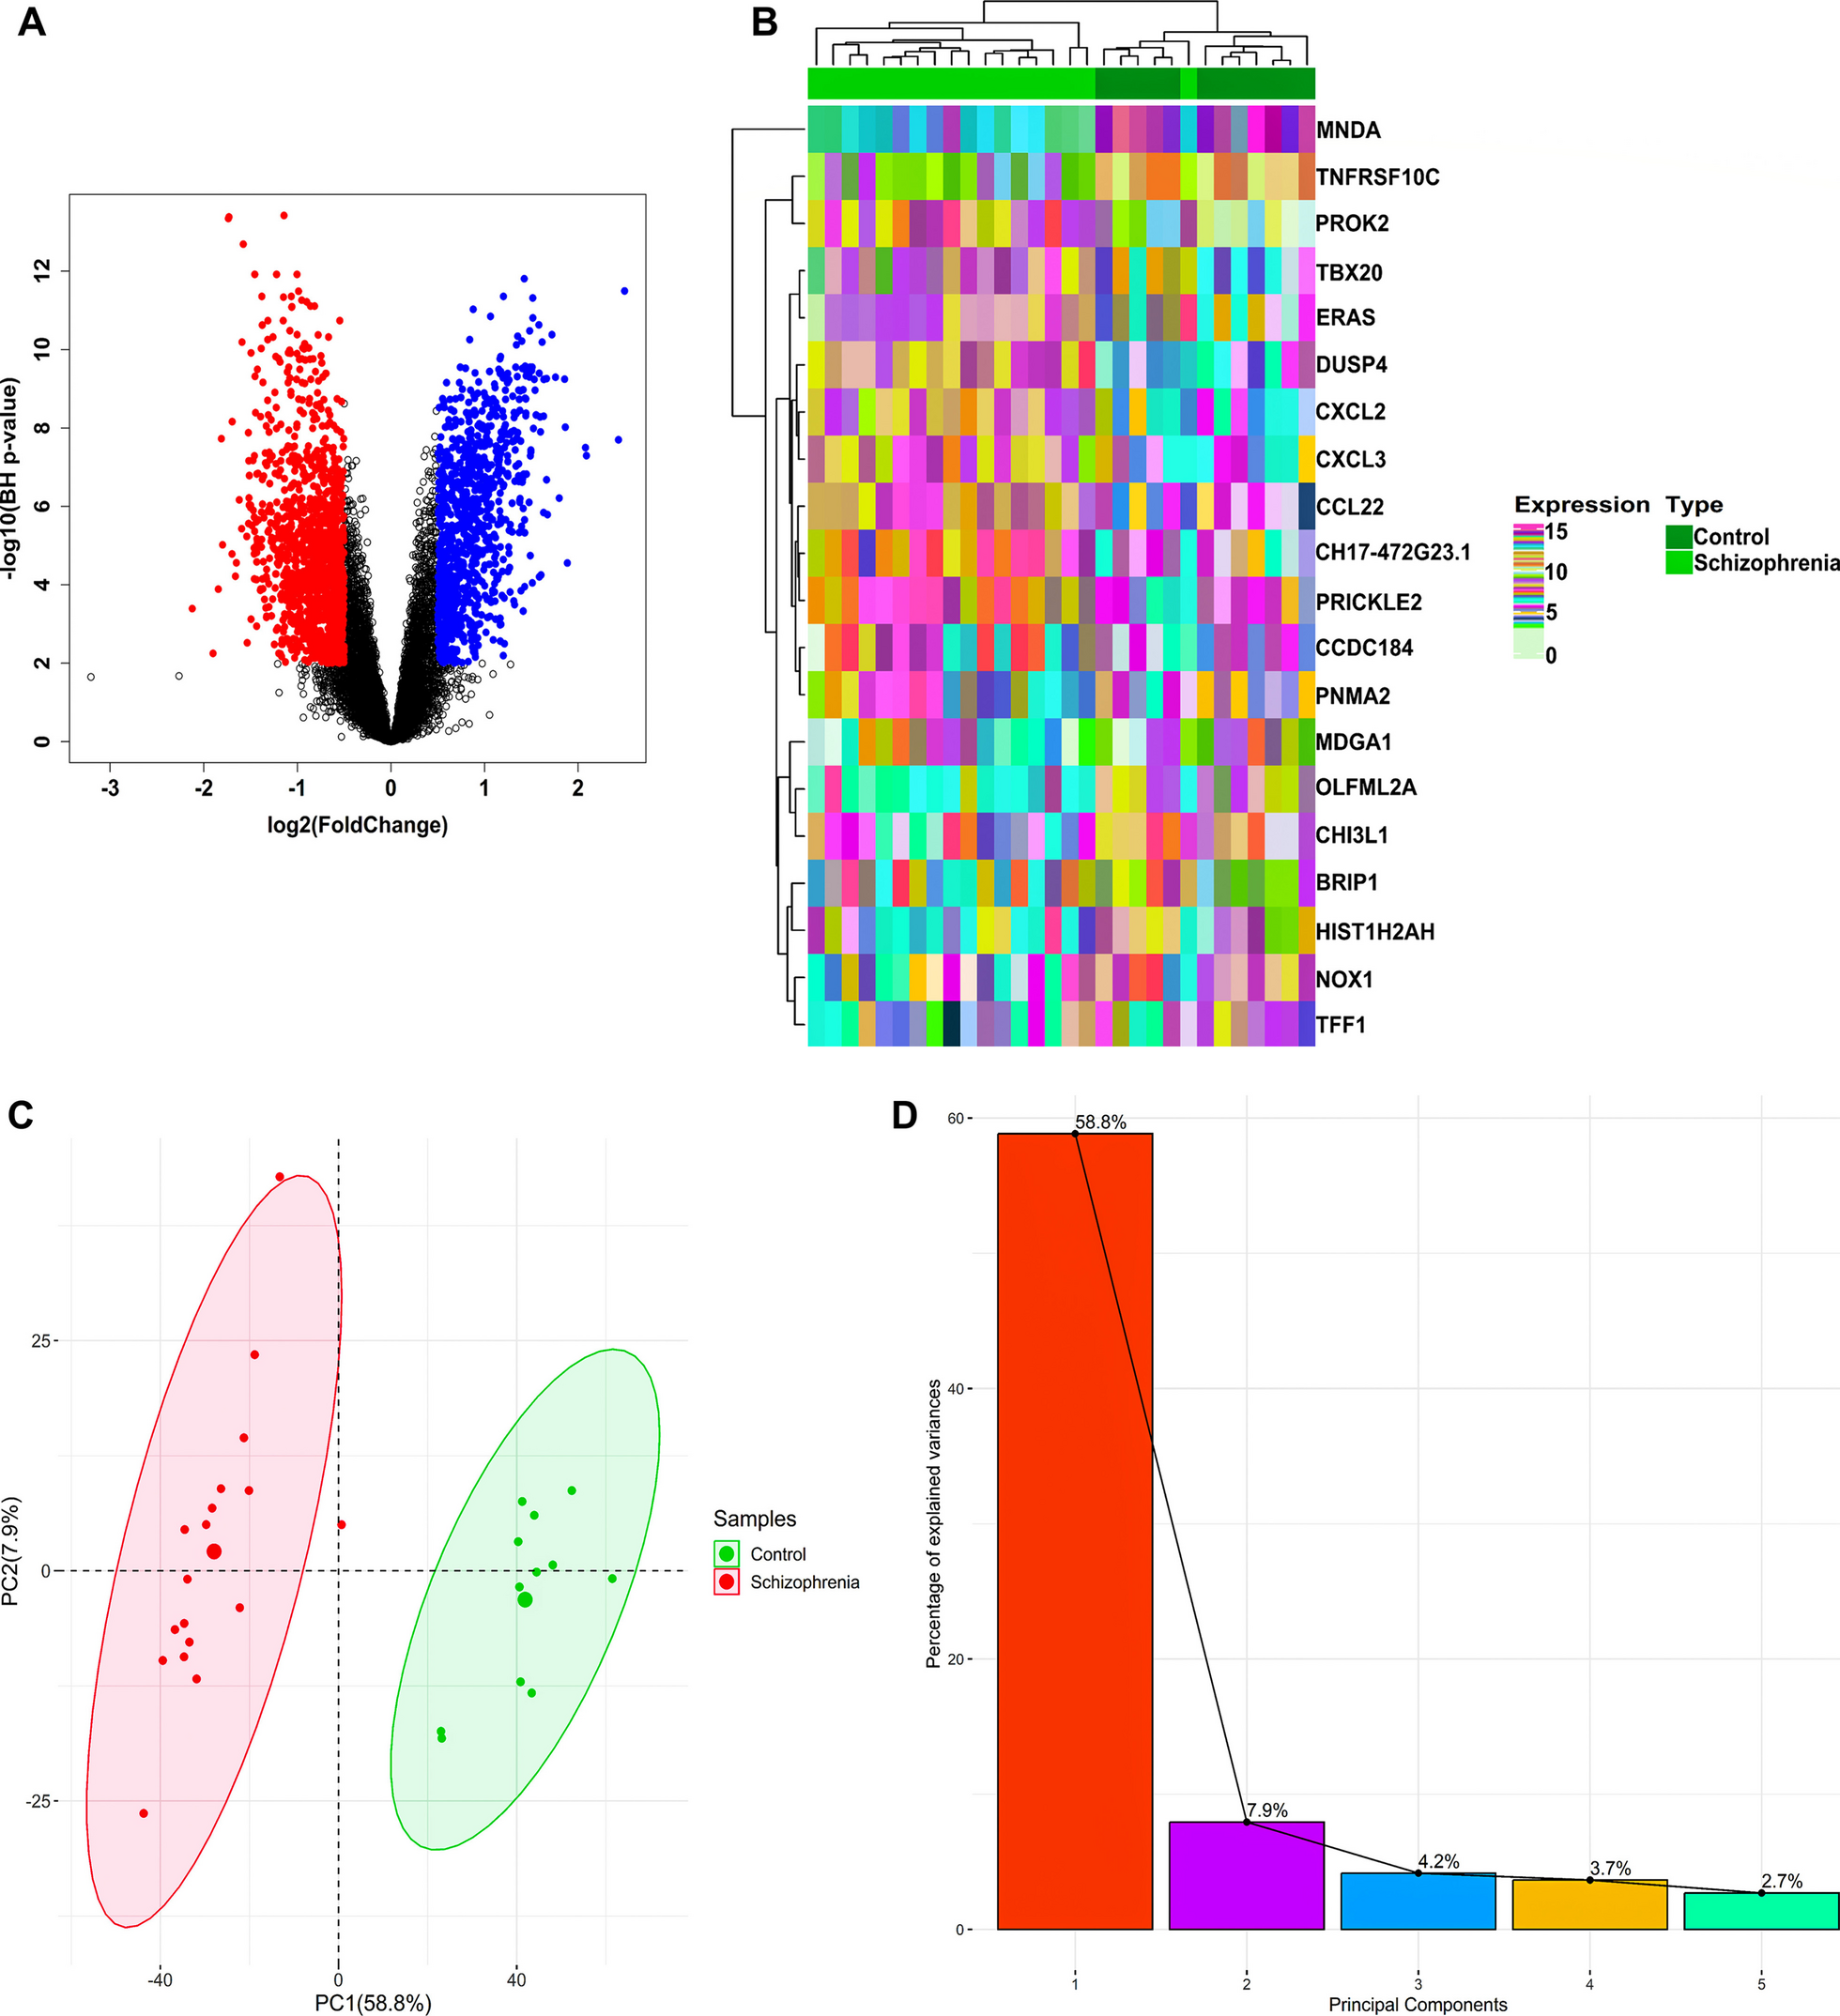
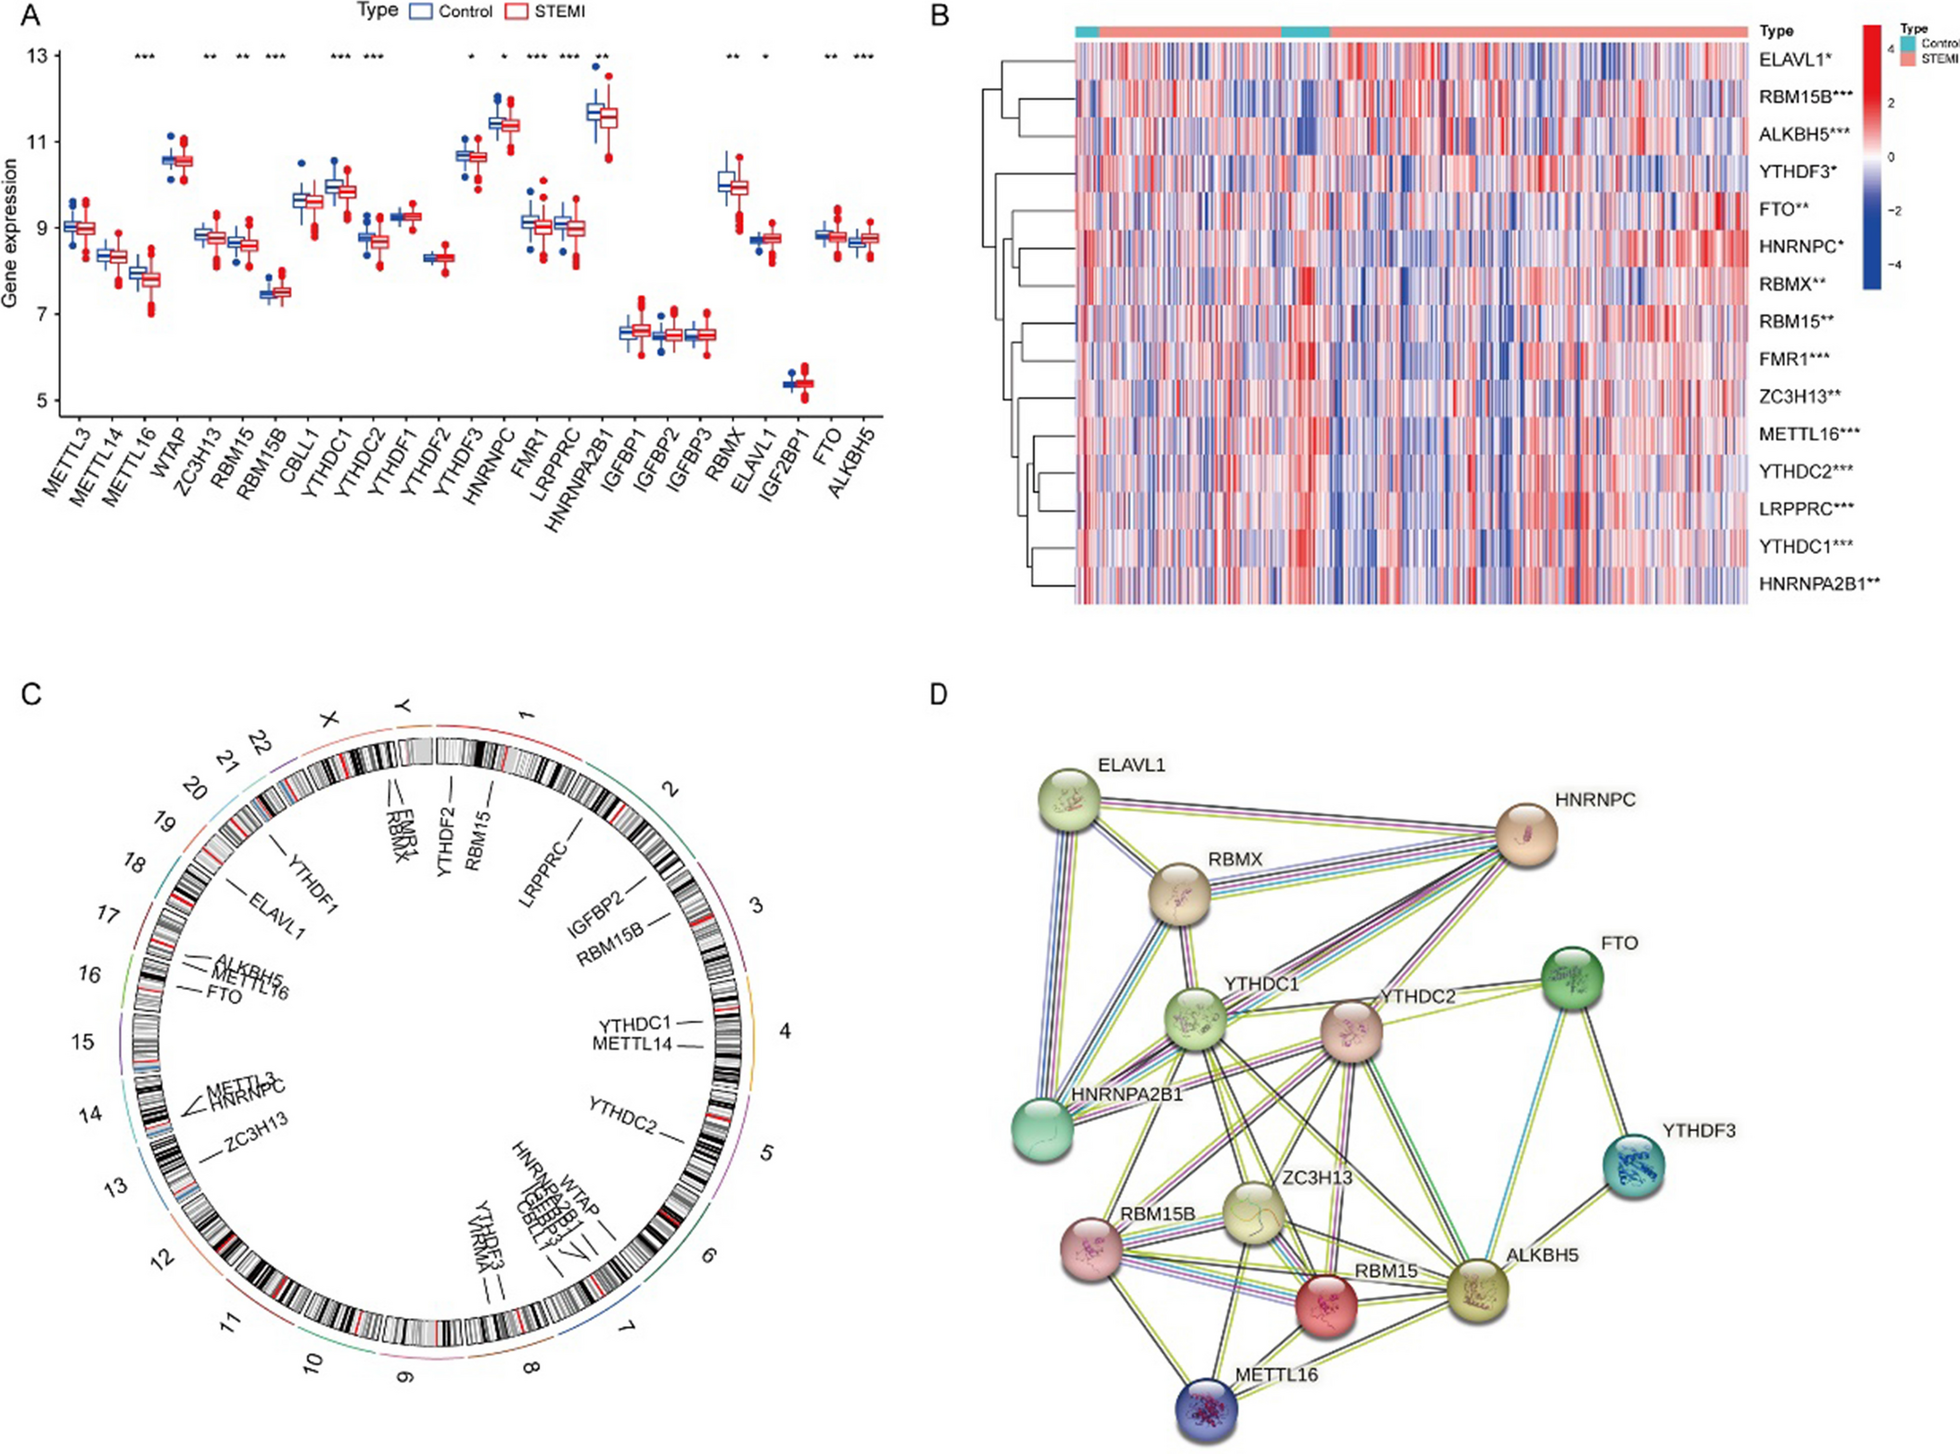
A total of 26 m6A-related gene regulators, including 9 writers (METTL3, METTL14, METTL16, WTAP, VIRMA, ZC3H13, RBM15, RBM15B, and CBLL1), 15 readers (YTHDC1, YTHDC2, YTHDF1, YTHDF2, YTHDF3, HNRNPC, FMR1, LRPPRC, HNRNPA2B1, IGFBP1, IGFBP2, IGFBP3, RBMX, ELAVL1, and IGF2BP1), and 2 erasers (FTO and ALKBH5), were analyzed in this study. We merged and batch‐normalized the GSE123342 and GSE59867 databases using the Perl 5.32.1001 and R packages (sva and limma 3.40.6). The Limma package was used to identify correlations between the m6A RNA methylation regulators. The comprehensive gene expression matrix was obtained after merging the GSE123342 dataset and the GSE59887 dataset and batch normalization. Statistical significance was defined as p < 0.05. Heatmaps and box plots were construed to determine differentially expressed genes, which were being highlighted as DEGs. Finally, the chromosomal locations of the differentially expressed m6A regulators were characterized with Circos software.
Construction and verification of the nomogram
The “rms” package in R software was used to construct predictive nomograms based on the expression values of six key m6A regulators. The calibration curve assessed the predictive power of the nomogram.
Consensus clustering for STEMI samples
Classification of STEMI samples based on genes associated with m6a methylation by the “Consensus Cluster Plus” package in the R software [7]. The ideal cluster number was identified using the consensus matrix (CM) and cumulative distribution function (CDF) curves of the consensus score [8]. We also performed principal component analysis (PCA) with different clusters.
Assessment of biological variables among various differently expressed gene of different cluster with STEMI patients
Gene Ontology (GO) analysis is a standard method for conducting large-scale functional enrichment studies covering biological processes, molecular functions, and cellular components [9]. Kyoto Encyclopedia of Genes and Genome (KEGG) is a widely used database for storing information on genomes, biological pathways, diseases, and pharmaceuticals [9]. GO annotation analysis and KEGG pathway enrichment analysis of the differentially expressed genes were performed using the R’s clusterProfiler package [9], and p < 0.05 for false discovery rate was considered statistically significant.
Protein–protein interaction (PPI) network construction and hub genes identification
A PPI network was constructed using the online STRING database (STRING, version 11.5; https://cn.string-db.org) to predict interactive relationships between differentially expressed genes. Cytoscape 3.8.2 was employed for PPI network visualization and hub gene analysis.
Immunity and inflammation infiltration analysis
ssGSEA is an extension of genomic enrichment analysis (GSEA) to determine the intensity of immune cell infiltration. The tool can be used to define enrichment scores that provide a representation of the absolute level of enrichment of genomes in each sample in a given dataset. Using the “GSVA” R package, we performed ssGSEA to examine differences in immune cell infiltration between the two groups and determine whether there was any correlation between the two subtypes [10].

留言 (0)