
記住我


In assessing the risk of bias in studies related to O. viverrini infections, the appraisal revealed that the majority of studies (93.60%, n = 117) exhibited low or moderate risk of bias (Figure S1, Tables S2 in Additional file 1). Likewise, in the study of C. sinensis infection, most studies (96.15%, n = 25) demonstrated low or moderate risk of bias (Figure S2, Table S3 in Additional file 1). These findings underscore the overall standardized methodological quality of the studies included in the systematic review.
Publication biasUpon visual inspection of the funnel plot for the prevalence estimate of O. viverrini infection, an asymmetry is evident, suggesting a potential publication bias. It appears that smaller studies, potentially yielding more positive outcomes, are published more frequently, as observed with a cluster of studies in the upper left of the plot (see Additional file 1: Figure S3). To validate this visual assessment, we conducted an Egger's test, providing a statistical measure of the funnel plot's asymmetry. The Egger’s test revealed significant small-study effects (P-value = 0.001), indicating the presence of publication bias.
Similarly, the funnel plot for the prevalence estimate of C. sinensis infection also displayed potential asymmetry, indicating the presence of publication bias. This was particularly noted by the scarcity of studies with high standard errors and low proportion estimates in the upper left of the plot (see Additional file 1: Figure S4). To quantify this potential bias, we performed an Egger’s test, which confirmed statistical significance (P-value = 0.006). These observations collectively suggest that publication bias may have influenced the results, potentially leading to an underestimation of the prevalence estimates for O. viverrini and C. sinensis infections in the GMS.
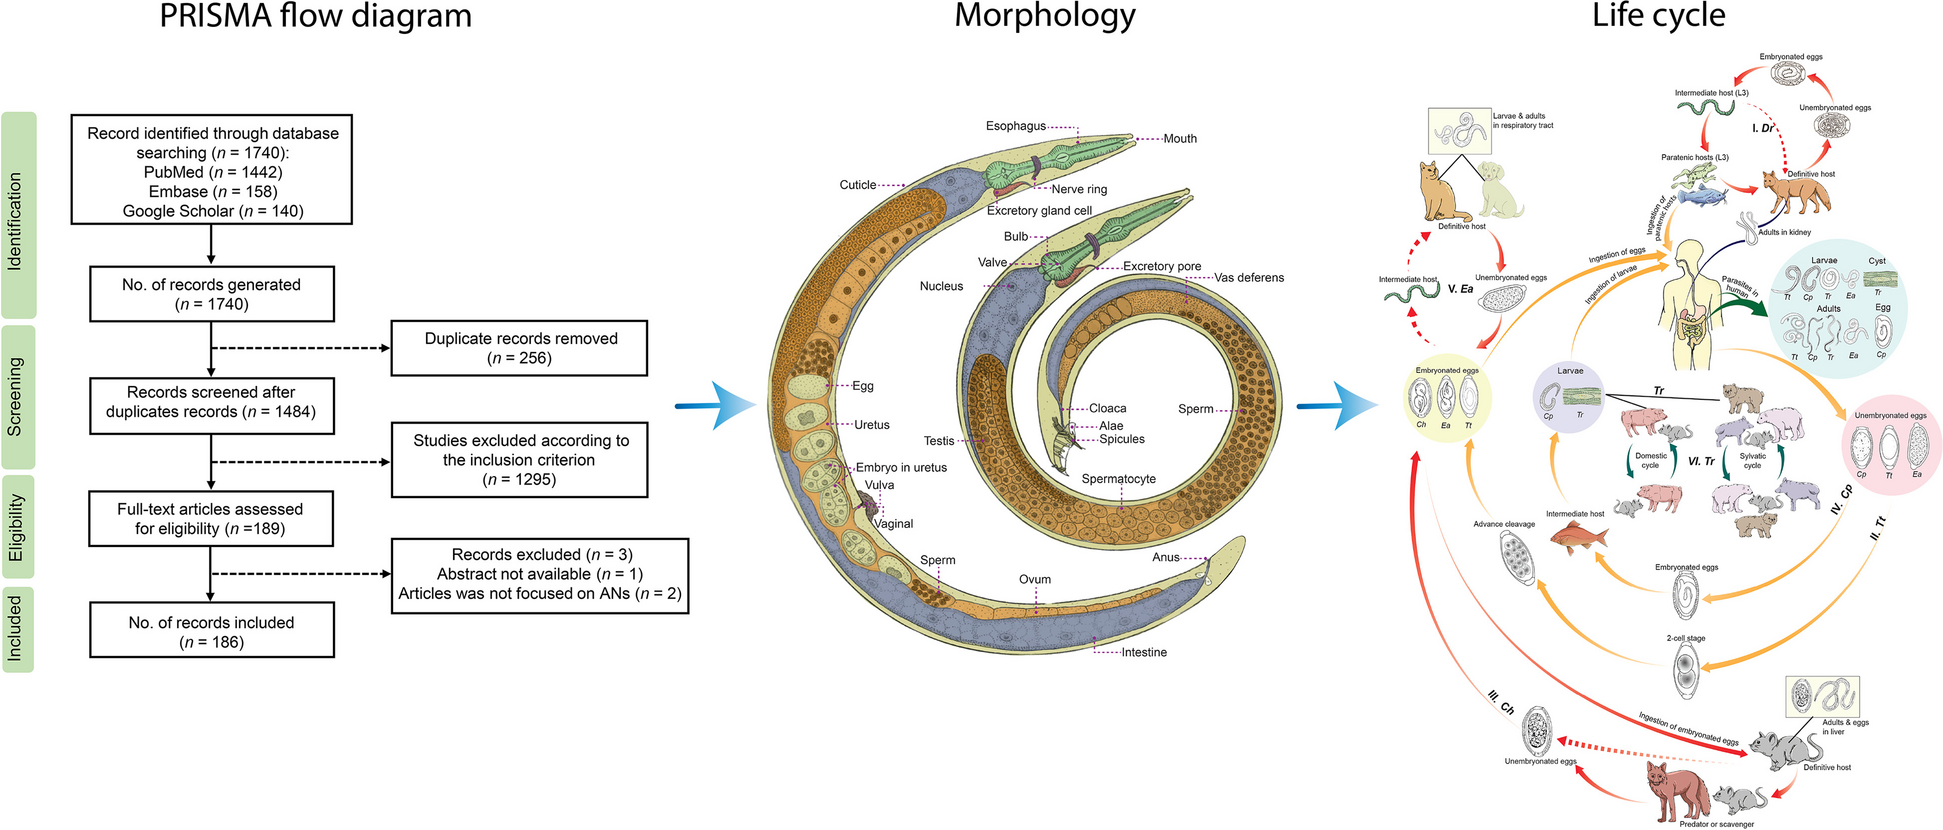
Search resultsOur electronic database search yielded a total of 2997 articles. After removing 675 duplicates, we screened 2323 studies based on titles and abstracts. Subsequently, 340 studies were retained for further review, involving the removal of duplicate articles and a critical appraisal of titles and abstracts. Following the application of eligibility criteria, 155 articles comprising 218 datasets were deemed suitable for inclusion in the quantitative synthesis (Fig. 1).
Fig. 1
PRISMA flowchart of the available published documents for the prevalence of Opisthorchis viverrini and Clonorchis sinensis in the GMS
Study characteristicsThe datasets encompassed 751,108 participants from six countries, including Thailand, Lao PDR, Cambodia, Vietnam, Myanmar, and China (Guangxi) (Table 1). Opisthorchis viverrini datasets were derived from 186 studies (Additional file 2), while C. sinensis datasets were sourced from 32 studies (Additional file 3). Studies on O. viverrini were conducted primarily in Thailand (89 studies, 47.85%), Lao PDR (55 studies, 29.57%), Cambodia (34 studies, 18.28%), Vietnam (6 studies, 3.23%), and Myanmar (2 studies, 1.07%). The majority of C. sinensis studies (24 studies, 75%) were carried out in Guangxi, China, with Vietnam hosting the remaining 25% (8 studies).
Table 1 The prevalence of Opisthorchis viverrini and Clonorchis sinensis in the Greater Mekong subregionPrevalence of Opisthorchis viverrini and Clonorchis sinensis in the GMSIn total, 45,083 individuals out of a general population of 260,237 tested positive for O. viverrini, yielding a pooled prevalence of 21.11% (95% CI: 17.74–24.47%). Notably, there was significant heterogeneity among studies (I 2 = 99.80%, P-value < 0.001). The highest pooled prevalence estimates were observed in Lao PDR (34.06%, 95% CI: 26.85–41.26%), Thailand (18.19%, 95% CI: 13.86–22.51%), Vietnam (11.75%, 95% CI: 1.25–22.24%), and Cambodia (10.48%, 95% CI: 5.52–15.45%), while Myanmar exhibited the lowest prevalence at 2.66% (95% CI: 0.00–6.83%) (Table 1, Fig. 2).
Fig. 2
Map depicting the estimated prevalence of Opisthorchis viverrini and Clonorchis sinensis in the GMS. Map approval No.: GS (2024) 1295
Regarding Clonorchis sinensis infection in the GMS, the overall prevalence is 25.33% (95% CI: 18.32–32.34%). Guangxi, China, recorded the highest prevalence rates at 26.89% (95% CI: 18.34–35.43%), whereas Vietnam had lower prevalence rates at 20.30% (95% CI: 9.13–31.47%) (Table 1, Fig. 2).
The subgroup analysis, based on different GMS countries, is depicted in Figs. 3 and 4, showing trends similar to the pooled prevalence as presented in Table 1. The prevalence of O. viverrini infection was highest in Lao PDR (21.56%, 95% CI: 13.37–32.87%), followed by Thailand (10.38%, 95% CI: 7.40–14.39%), Vietnam (6.17%, 95% CI: 1.77–19.34%), Cambodia (2.36%, 95% CI: 0.96–5.64%), and Myanmar (1.81%, 95% CI: 0.45–7.02%) (Fig. 3). The subgroup analysis of C. sinensis infection revealed prevalence rates ranging between 15.53% and 21.69%. After Guangxi, China (21.69%, 95% CI: 14.75–30.71%), Vietnam (15.53%, 95% CI: 7.29–30.08%) exhibited the second-highest pooled prevalence (Fig. 4).
Fig. 3
Forest plot of subgroup analysis with country segregation to examine opisthorchiasis in GMS
Fig. 4
Forest plot of subgroup analysis with country segregation to examine clonorchiasis in GMS
Prevalence of Opisthorchis viverrini infection over time in the GMSAccording to the study population in the GMS, 35 datasets were conducted in children, 90 datasets were examined in both children and adults across all age groups, and 61 studies were conducted in adults. Subgroup analyses revealed that the O. viverrini infection rate was 2.87% (95% CI: 1.44–5.64%) among children, 14.84% (95% CI: 9.81–21.82%) across all age categories, and 10.98% (95% CI: 7.49–15.80%) among adults (Table 2).
Table 2 Prevalence estimates of Opisthorchis viverrini and Clonorchis sinensis infection in the GMS, according to a priori-defined subgroups and age group parametersAn additional subgroup analysis was performed to examine the temporal pattern of O. viverrini infection, focusing on the timeframe of sample collection. Based on the period of collecting the samples, the subgroup analysis showed that the overall prevalence rates of O. viverrini infection in the GMS were 29.27% (95% CI: 16.94–45.63%), 4.32% (95% CI: 2.10–8.70%), 10.69% (95% CI: 7.72–14.64%), and 1.86% (95% CI: 0.62–5.48%) for studies released before the year 2000, between 2000 and 2009, between 2010 and 2019, and from 2020 to the present, respectively (Table 2). Random-effects meta-regression analysis revealed a significant substantial declining trend in prevalence with the collection period (P-value < 0.0001) (Fig. 5). It's important to note that Vietnam and Myanmar had limited access data for such analysis (6 for Vietnam and 2 for Myanmar), and therefore, subgroup analysis and meta-regression were omitted to avoid excessive estimated errors.
Fig. 5
Random-effects meta-regression analyses illustrating the prevalence trend of Opisthorchis viverrini infection in the general population across different collection periods. The results reveal a statistically significant downward trend in prevalence within the GMS
Prevalence of Opisthorchis viverrini Infection in different diagnostic methodsVarious diagnostic techniques were employed for opisthorchiasis diagnosis in the datasets, categorized into three main groups: 1) the Kato-Katz method (90 datasets), 2) FECT (49 datasets), and 3) other techniques, including sedimentation, flotation methods, Stoll's dilution egg count, and/or molecular techniques (44 datasets). These diagnostic methods were further divided into four collecting periods to illustrate the progression of diagnostic techniques over time, with prevalence estimates of O. viverrini infection in the GMS shown in Table 3.
Table 3 Prevalence estimates of Opisthorchis viverrini infection in the GMS, as determined by methods of diagnosis over timeIn each period of data collection, subgroup analysis revealed that the prevalence rates of diagnostic methods before the year 2000 and between 2000 and 2009 did not differ significantly (P-value = 0.65, 0.59, respectively). However, a significant difference (P-value = 0.0029) was observed among diagnostic methods during 2010–2019. Specifically, subgroup analysis of diagnostic methods during 2010–2019 revealed pooled prevalence rates of 15.73% (95% CI: 10.49–22.92%) for Kato-Katz, 8.20% (95% CI: 4.90–13.39%) for FECT, 2.58% (95% CI: 0.42–14.31%) for a combination of FECT and Kato-Katz, and 2.23% (95% CI: 0.66–7.29%) for other diagnostic methods, respectively.
Prevalence of Clonorchis sinensis infection over time in the GMSSubgroup analysis of C. sinensis infection in the GMS, specifically in Vietnam and China (Guangxi), was conducted based on age groups and data collection periods. For age group analysis, the pooled prevalence was found to be 13.09% (95% CI: 3.78–36.58%) in adults and 21.13% (95% CI: 14.81–29.24%) for all age groups. Regarding the collection periods, the subgroup analysis revealed prevalence rates of 20.85% (95% CI: 8.19–43.77%), 13.00% (95% CI: 6.45–24.48%), and 25.58% (95% CI: 16.90–36.73%) for studies conducted before the year 2000, between 2000 and 2009, and from 2010 to 2019, respectively (Table 2). However, the differences between collection periods were not statistically significant (P-value = 0.08). A random-effects meta-regression analysis further revealed a non-significant constant trend in the prevalence rates across collection periods (P-value = 0.93) (Fig. 6).
Fig. 6
Random-effects meta-regression analysis of Clonorchis sinensis infection prevalence in the general population across collection periods showed a statistically non-significant constant trend in the GMS
Prevalence of Opisthorchis viverrini infection in ThailandIn Thailand, 89 out of 186 research studies reported the prevalence of O. viverrini infection, involving a total study population of 169,577 (Table 1). The pooled prevalence of infection among Thais was found to be 18.19% (95% CI: 13.86 to 22.59%) (Table 1). Significant heterogeneity between studies was observed, with population type, collection period, and region serving as significant covariates.
The infection prevalence was substantially greater across all age groups at 14.84% (95% CI: 8.63–24.32%) compared to adults (9.29%, 95% CI: 6.32–13.46%) and children (1.22%, 95% CI: 0.33–4.43%), indicating a significant difference (P-value = 0.002). The trend of O. viverrini infection in Thailand showed a decline over time, being significantly higher before the year 2000 at 40.86% (95% CI: 21.50–63.54%) compared to 1.13% (95% CI: 0.37–3.37%) two decades later from 2020 to the present. Furthermore, over the more than two decades of data collection in Thailand, random-effects meta-regression analysis revealed a significant downward trend in prevalence (P-value = 0.0001) (Additional file 1: Figure S5).
In regions where sufficient data allowed for the evaluation of study region as a covariate, the O. viverrini infection prevalence was significantly higher in the Northeast (13.66%, 95% CI: 9.44–19.36%) and the North (5.53%, 95% CI: 2.57–11.51%, P-value = 0.007) compared to other regions of Thailand (Table 4).
Table 4 Prevalence estimates of Opisthorchis viverrini infection in Thailand, Lao PDR, and Cambodia, according to a priori-defined subgroups and age group parametersPrevalence of Opisthorchis viverrini Infection in Lao PDRIn Lao PDR, 55 studies involving a total of 54,457 participants reported a pooled O. viverrini infection prevalence of 34.06% (95% CI: 26.85–41.26%) (Table 1). Table 4 displays the prevalence of infection with significantly high heterogeneity (I 2 = 99.9%, P-value < 0.0001). Population type, collection period, and province served as significant variables contributing to the significant heterogeneity among studies.
High infection prevalence was observed across all age groups, at 48.24% (95% CI: 35.28–61.44%), compared to adults (40.47%, 95% CI: 19.14–66.17%) and children (4.66%, 95% CI: 2.04–10.29%) (Table 4, P-value < 0.0001). Before the year 2000 through 2019 in Lao PDR, a random-effects meta-regression revealed a non-significant upward trend in prevalence (P-value = 0.27) (Additional file 1: Figure S6). Among the periods of data collection, opisthorchiasis prevalence was significantly higher before the year 2000 at 54.94% (95% CI: 41.00–68.17%) and remained high at 40.18% (95% CI: 26.41–55.71%) in the later two decades, except for the period between 2000 and 2009 when the prevalence decreased to 7.96% (95% CI: 3.35–17.75%). Only one study on O. viverrini prevalence from 2020 to the present was available, and it remained high at 51.04% (95% CI: 48.04–54.05%).
For the endemic locations with provided data, three provinces exhibited considerably higher prevalence than others, namely, Saravane (62.53%, 95% CI: 35.79–83.32%), Khammouane (46.82%, 95% CI: 38.18–55.65%), and Champasack (45.52%, 95% CI: 24.42–68.36%) (Table 4).
Prevalence of Opisthorchis viverrini Infection in CambodiaOut of 186 articles published on O. viverrini infection prevalence, a total of 34, with a population of 24,927, were recruited from Cambodia. The prevalence of O. viverrini infection in Cambodia was 10.48% (95% CI: 5.52–15.45%) (Table 1). Significant variation in prevalence was observed among studies, including collecting period and province, but not among age groups (Table 4). Prevalence was slightly higher among adults (5.58%, 95% CI: 1.29–21.11%) compared to all ages (2.29%, 95% CI: 0.63–8.02%) and children (1.05%, 95% CI: 0.18–5.88%), but the difference was not statistically significant (P-value = 0.60) (Table 4).
Regarding the time period, opisthorchiasis prevalence was reported to be low prior to the year 2000 at 5.14% (95% CI: 2.16–11.78%) and slightly increased to 6.19% (95% CI: 2.65–13.76%) between 2010 and 2019, with a substantial reduction to 0.17% (95% CI: 0.01–2.72%) between 2000 and 2009. Random-effects meta-regression analysis revealed a non-significant increasing trend in the collecting period of prevalence rates (P-value = 0.12) (Additional file 1: Figure S7). Although inadequate data were available to explore all provinces, one province named Kampong Cham had the highest prevalence (26.95%, 95% CI: 16.42–40.94%), while Kratie and Takeo had the lowest (2.96%, 95% CI: 0.71–11.46% and 0.69%, 95% CI: 0.03–15.44%, respectively) (Table 4).
Prevalence of Clonorchis sinensis Infection in Guangxi, ChinaUsing random-effects analysis, the pooled prevalence estimate of C. sinensis infection in Guangxi, China, was determined to be 26.89% (95% CI: 18.34–35.43%) with considerable heterogeneity (I 2 = 99.8%, P-value = 0.001). The study by Hong et al. (2001) identified the highest proportion of C. sinensis infection (69.00%, 95% CI: 58.97–77.87%) [19]. Since the demographic datasets did not include age information, subgroup analysis based on age was not performed.
For the time period subgroup analysis, prevalence rates of 42.10% (95% CI: 13.55–77.13%), 12.72% (95% CI: 6.75–22.69%), and 25.42% (95% CI: 15.99–37.90%) were observed for data collected before the year 2000, between 2000 and 2009, and from 2010 to 2019, respectively (Table 5). There was no significant difference among the periods of data collection. However, a slightly decreasing trend in the prevalence rates of C. sinensis over the collection periods was observed through random-effects meta-regression analysis (P-value = 0.46) (Additional file 1: Figure S8).
Table 5 Prevalence estimates of Clonorchis sinensis infection in Guangxi, China, and Vietnam, according to a priori-defined subgroups and demographic parametersPrevalence of Clonorchis sinensis infection in VietnamIn Vietnam, a total of 1036 individuals from a population of 6293 tested positive for C. sinensis infection, indicating a pooled prevalence of 20.30% (95% CI: 9.13–31.47%). Subgroup analysis based on the collection time revealed prevalence rates of 11.85% (95% CI: 5.23–24.66%), 12.82% (95% CI: 1.85–53.35%), and 26.88% (95% CI: 13.47–46.47%) for studies collected before 2000, between 2000 and 2009, and from 2010 to 2019, respectively (Table 5). A non-significant, upward trend in prevalence rates over time was detected using random-effects meta-regression analysis (P-value = 0.31) (Additional file 1: Figure S9).
While the difference between demographic groups was not statistically significant (P-value = 0.68), it was observed to be higher among all ages (17.88%, 95% CI: 6.89–39.05%) than among adults (13.09%, 95% CI: 3.78–36.58%) (Table 5).
留言 (0)