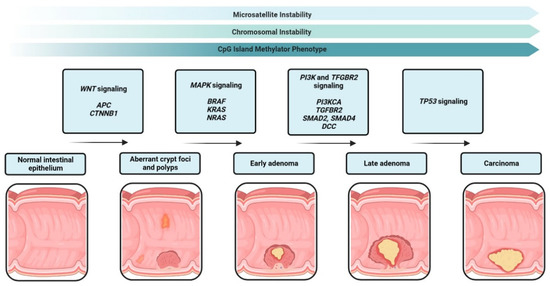
1. IntroductionAsthma is a chronic inflammatory disease of the airways that manifests in a heterogenous manner and includes multiple disease subgroups. The most common and well-studied type is allergic asthma, which is driven by a type 2 (T2) immune response characterized by secretion of cytokines, including interleukin-4, -5 and -13, and eosinophil recruitment [
1]. This response relies on signals from multiple cell types, including T helper (TH) 2 cells, which instigate a type 2 signaling cascade. In patients with asthma, this aberrant T2 signaling is often treated using inhaled corticosteroids (ICS) to dampen the cellular immune response. The activation and polarization of TH cells have been extensively studied, and multiple TH cell types (such as TH1, TH2, TH17 and TH9) have been identified in human and murine models [
2,
3]. Each TH subtype activates its own unique signaling cascade, which can be used to characterize and identify various disease states. Once thought to terminally differentiate into a specific subclass of TH cell, recent studies have focused on the plasticity of TH cells and genetic, epigenetic and environmental factors that may influence TH cell activation and polarization.Increasing evidence suggests that non-coding RNAs regulate numerous processes in the cell. MicroRNAs (miRNAs) are a set of non-coding RNAs that act as master regulators of post-transcriptional gene expression [
4]. miRNAs generally bind to target sites within the 3′ UTR of mRNAs via an ~8 nucleotide seed sequence, which then leads to their downregulation either through translational repression or cleavage and decay. Furthermore, miRNAs can bind one or several different mRNA targets in a spatial and temporal manner, leading to a complex regulation that is currently not well understood. As miRNAs are generally extremely stable and ubiquitously expressed, their dysregulation has been shown in numerous studies to be involved in the pathogenesis of disease [
2,
4,
5,
6,
7]. More recently, the involvement of miRNAs in inflammation, asthma and other airway diseases has been demonstrated [
2,
5,
6,
7]. Several studies have utilized miRNAs as potential circulating biomarkers to distinguish between diseases or disease subtypes [
8,
9,
10], but mechanistic studies of miRNAs and the genes they target are lacking, especially in asthma.Using a gene array, we found the serum/glucocorticoid-regulated kinase 1 (SGK1) gene to be upregulated in circulating peripheral blood mononuclear cells (PBMCs) from individuals with asthma. While Sgk1 has been implicated as an important factor in driving T cell polarity in murine models [
11,
12,
13,
14], very little is known about its role in humans and asthma [
12,
14]. Furthermore, recent studies have identified dysregulated miRNAs in T cells from individuals with asthma [
15,
16], leading us to question whether miRNAs may regulate SGK1. Thus, we aimed to determine if miRNAs regulated SGK1 expression and if this regulation may play a role in T cell biology in humans. Herein, we describe the relationship between SGK1 and miR-19a in human CD4+ T cells and suggest that miR-19a plays a role in binding and regulating SGK1 transcript levels during T cell development. 2. Materials and Methods 2.1. Study ParticipantsParticipants used in this study were recruited from the West Sweden Asthma Study cohort [
17], as previously described [
10]. Additional healthy individuals were recruited for the PrimeFlow™ RNA Assay and T cell polarization studies. Informed consent was obtained from all participants, and ethical approval was obtained from the Gothenburg County Regional Ethical Committee (no. 593-08 and 906-2016). Clinical characteristics of the participants are shown in
Table 1. 2.2. Human PBMC Isolation and TreatmentWhole blood was collected in EDTA Vacutainer® tubes (Becton Dickinson, Franklin Lakes, NJ, USA) for differential cell count and C-reactive protein measurements (Clinical chemistry, Sahlgrenska University Hospital, Gothenburg, Sweden), as well as PBMC isolation, as previously described [
18]. Isolated cells were counted using a Sysmex XP-300 Automated Haematology Analyzer (Sysmex Europe, Norderstedt, Germany) and resuspended at a concentration of 2 × 10⁶ cells/mL. Approximately 2 million cells were seeded per well and grown in RPMI complete medium (RPMI 1640, 1% [v/v] L-Glutamine and 1% penicillin-streptomycin, all from Hyclone, Logan, UT, USA) and supplemented with 10% (v/v) heat-inactivated fetal bovine serum (Sigma-Aldrich, St. Louis, MO, USA) at 37 °C with 5% CO2. Cells were treated for 48 h with 0.2 µg/mL αCD3 (Purified NA/LE Mouse anti-Human CD3, clone UCHT1 (BD Pharmingen™, BD Biosciences, Franklin Lakes, NJ, USA)) and 0.33 µg/mL αCD28 (Purified NA/LE Mouse anti-Human CD28, clone CD28.2 (BD Pharmingen, BD Biosciences)), 2.5 µM dexamethasone (Merck, Branchburg, NJ, USA), either both treatments concurrently or medium only as control. Cells were collected and used in subsequent RNA or flow cytometry analyses. 2.3. Enrichment of CD4+ T Cells Post Treatment
PBMCs were harvested after 48 h of treatment, as described above, before being subjected to negative magnetic separation to enrich for CD4+ T cells according to the manufacturer’s instructions (MojoSort™ Human CD4 T cell Isolation Kit, Biolegend, San Diego, CA, USA). Sorted CD4+ T cells were collected in QIAzol® lysis reagent (Qiagen Sciences, Germantown, MD, USA) and stored at −80 °C until further analysis.
2.4. Enrichment and Polarization of CD4+ Naïve T cells
PBMCs were isolated as described above, and CD4+ naïve (CD4+CD45RA+) T cells were isolated using the Magnisort™ Human CD4 Naïve T cell enrichment kit (Invitrogen by Thermo Fisher Scientific, Life Technologies Corp., Carlsbad, CA, USA) according to the manufacturer’s instructions. Isolated CD4+ naïve T cells were counted and resuspended at 2 × 10⁶ cells/mL in Complete T cell culture medium (RPMI complete with 1% MEM Non-essential amino acids (Sigma-Aldrich), 1% Sodium Pyruvate 100 mM (Gibco, Life Tech Limited, Paisley, UK), αCD3 and αCD28 each added at 1 µg/mL). Two million cells were plated per well and the appropriate 2× polarization medium was added to each well. The following culture media was prepared form the corresponding cells: TH0 was Complete T cell culture medium only, TH1 medium (2×) was αIL-4 (10 µg/mL; Ultra-LEAF™Purified anti-human IL-4 clone MP4-25D2, BioLegend®), rhIL-12 (20 ng/mL; Peprotech, UK) and αIL-10 (10 µg/mL; Ultra-LEAF™Purified anti-human IL-10 clone JES3-9D7, BioLegend®) in Complete T cell culture medium and TH2 medium (2×) was αIFNγ (10 µg/mL; Ultra-LEAF™Purified anti-human IFN-γ clone B27, BioLegend®); rhIL-4 (10 ng/mL; Peprotech), and αIL-10 (10 µg/mL) in Complete T cell culture medium. Cells were cultured at 37 °C with 5% CO2 for 5 days. On day 5, cells were allowed to rest using medium with rhIL-2 (50 U/mL; Peprotech) but without αCD3 and αCD28. On day 7, cells were restimulated with the initial medium until day 10–12. Cells were subsequently used for flow cytometry or stored in QIAzol®Lysis reagent until RNA isolation and analysis. For kinetic experiments, cells were collected on days 0, 3, 5, 7 and 10.
2.5. RNA IsolationCells were lysed in QIAzol® Lysis Reagent and total RNA was isolated using miRNeasy Mini Kit (Qiagen) according to the manufacturer’s protocol, with the exception that Phasemaker™ tubes (Invitrogen by Thermo Fisher Scientific, Life Technologies Corp., Carlsbad, CA, USA) were utilized in the phase separation stage, as previously described [
10]. RNA was measured using an Agilent RNA 6000 Nano kit on an Agilent 2100 Bioanalyzer running 2100 Expert Software (Agilent Technologies Inc.; Santa Clara, CA, USA) or a DeNovix Microvolume Spectrophotometer DS-11FX+ (DeNovix, Inc., Wilmington, DE, USA). 2.6. RT2 Profiler PCR ArrayTotal RNA (500 ng) was reverse transcribed to cDNA using the RT2 First Strand Kit (Qiagen) according to the manufacturer’s instructions. cDNA was mixed with RT2 SYBR® green qPCR Mastermix (Qiagen) and nuclease-free water and pipetted into the RT2 Profiler Human Glucocorticoid Signaling array (Cat#PAHS-154Z, Qiagen) according to the manufacturer’s instruction and run in a CFX96 Touch Real-Time PCR Detection System (Bio-Rad Laboratories, Hercules, CA, USA). Data were analyzed via the GeneGlobe Analysis software available on the Qiagen homepage (
www.qiagen.com, accessed on 7 October 2022). 2.7. mRNA and miRNA Expression Analysis Using RT-qPCRIsolated total RNA from PBMCs was reverse transcribed to cDNA for subsequent mRNA analysis using the iScript™ cDNA Synthesis Kit (Bio-Rad) or for miRNA analysis using the miRCURY LNA RT Kit (Qiagen). Isolated total RNA from Jurkat pull-down experiments was reversed transcribed to cDNA using High-Capacity cDNA Reverse Transcription Kit (Applied Biosystems™, Thermo Fisher Scientific Baltics, Lithuania). All qPCR reactions were run on a CFX96 Touch Real-Time PCR Detection System (Bio-Rad) using SSO advanced SYBR Green (Bio-Rad) according to the manufacturer’s protocols. mRNA primers were purchased from Sigma-Aldrich, and miRNA expression was assessed using pre-designed miRCURY LNA miRNA PCR assays (
Table S1) and miRCURY LNA SYBR Green PCR kit (Qiagen) according to the manufacturer’s instructions. 2.8. PrimeFlow™ RNA AssayThe PrimeFlow™ RNA assay was performed as three separate experiments of 6 subjects in total (3 healthy and 3 asthmatic subjects) using a commercial assay kit (PrimeFlow™ RNA Assay, Invitrogen by Thermo Fisher Scientific, Affymetrix, Carlsbad, CA, USA). All buffers mentioned below were provided in the PrimeFlow™ RNA assay Kit. PBMCs were processed throughout the staining and hybridization procedure according to the manufacturer’s instructions (PrimeFlow™ RNA Assay with microRNA Pretreatment Protocol). In brief, PBMCs were incubated with 1 mg/mL of Human IgG (Sigma-Aldrich, St. Louis, MO, USA), followed by staining with viability dye (Live/Dead™ Fixable Aqua stain, Invitrogen, Life Technologies Corp., OR, USA) and surface antibody (αCD4). After the viability and surface staining, PBMCs were treated with PrimeFlow™ microRNA Pretreatment Buffer (Invitrogen), then fixed in Fixation buffer #1 before permeabilization with Permeabilization buffer with RNase inhibitor. Samples were then fixed in Fixation buffer #2, washed and kept overnight at 4 °C in wash buffer with RNase inhibitor. To detect cellular miRNA and mRNA, sequential hybridizations were performed in a dry incubator at 40 °C. Target probe sets were first hybridized, then signal amplification hybridization was performed using pre-amplifierDNA and amplifierDNA, followed by the corresponding fluorescent labeled probes (Type 1, Alexa Fluor 647; Type 4, Alexa Fluor 488). Probe sets used were the single pair target probe set for human miR-19a-3p (MIMAT0000073, VM1-10350-PF) and for human SGK1 (VA4-3083904-PF). For each experiment, a control probe, human ribosomal protein L13A (NM_012423, VA4-13187-PF), was performed in one tube to verify the hybridization process. Following hybridization, amplification and labeling of the probes, intracellular staining was performed. Antibodies (αT-bet, αGATA-3, αRORγt and αFOXP3) diluted in permeabilization buffer were added and incubated for 45 min at 4 °C. Several steps of washing were performed with appropriate buffers throughout the staining and hybridization, following manufacturer protocols. Finally, cells were analyzed using a BD FACSVerse flow cytometer (BD Biosciences) running FACSuite software, collecting 0.5–1.6 × 10⁶ events/sample. Analysis of the data was performed using FlowJo Software (TreeStar, OR, USA). Only live, singlet CD4+ lymphocytes, considered CD4+ T cells, were analyzed. Gating of miR-19a, SGK1 and surface/intracellular markers was determined using control samples by the fluorescence minus one (FMO) approach, i.e., controls containing all markers except the one of interest were used to set gates (
Figure S1). Antibodies used are given in
Table S2. Median fluorescence index (MFI) values were used to determine expression levels of SGK1 mRNA and miR-19a in the respective population (
Figure S1). 2.9. Imaging of CD4+ T Cells Using PrimeFlow™ RNA Assay
As described above, PBMCs were harvested after 48 h of treatment, CD4+ T cells were isolated using the MojoSort™ Human CD4 T cell Isolation Kit and PrimeFlow RNA™ Assay was performed until the hybridization step. After hybridization, cells were washed several times, then spotted on poly-L-lysine coated slides, mounted with Prolong Diamond Antifade (Invitrogen) and stored at 4 °C in the dark until imaging. Imaging was performed on a Leica SP8 confocal microscope (Leica, Buffalo Grove, IL, USA). Mean intensity per cell (n > 55 per condition) was calculated using ImageJ (Bethesda, MD, USA).
2.10. RNA PulldownThe protocol for RNA pulldown was adapted from Zhou et al. [
19]. Biotinylated miRNA mimics were obtained for miR-19a (hsa-miR-19a-3p miRCURY LNA miRNA Mimic, MIMAT0000073: 5′UGUGCAAAUCUAUGCAAAACUGA, GeneGlobeID: YM00472044) and cel-miR-39-3p (MIMAT0000010: 5′UCACCGGGUGUAAAUCAGCUUG, GeneGlobeID: YM00479902, both from Qiagen), as a negative control. Jurkat cells (ACC 282 obtained from DSMZ, Braunschweig, Germany) were grown in RPMI complete medium at 37 °C and 5% CO2. Cells were treated (approximately 15 × 106 cells per treatment), as previously described, for 48 h, then collected by brief centrifugation. Pelleted cells were lysed in 100 mM KCl, 5 mM MgCl2, 10mM HEPES pH 7.0, 0.5% NP-40/IPEGAL with 1 µL/100 µL rxn HALT protease and phosphatase inhibitor cocktail (Invitrogen) and RNaseOUT Recombinant Ribonuclease Inhibitor (40 U/µL; Invitrogen) on ice. Lysates were cleared by centrifugation and added to an equal amount of 2x TENT buffer (20 mM Tris pH 8, 2 mM EDTA, 500 mM NaCl, 1% Triton-X) with 200 µM biotinylated miRNA oligo and RNaseOUT, then mixed by gentle pipetting and incubated at room temperature for 45 min. Lysate reactions were added to 15 µL of magnetic Dynabeads (M-280 Steptavidin, Invitrogen) or Pierce Streptavidin Magnetic Beads (Pierce Biotechnology, Thermo Scientific, Rockford, IL, USA) pre-washed 2x with 0.1 M NaOH, 0.05M NaCl and 1x with 0.1 M NaCl and stored up to 2 days in 1x TENT buffer. Bead/lysate mixtures were then incubated for 45 min at room temperature with end over end rotation. Washing was performed twice using an equal amount of ice cold 1xPBS; the reactions were then placed on a magnet and flow through was discarded. Beads were resuspended in 0.1% SDS and incubated for 5 min at room temperature. Finally, an equal amount of 1xPBS was added, the bead solution was placed on the magnet and the entire supernatant was recovered. QIAzol® was immediately added to the supernatant and stored at −80 °C until RNA isolation, as described, using an miRNeasy micro kit (Qiagen). 2.11. Statistics
Statistics are presented as box and whiskers plots where the box represents 25–75% and the whiskers 5–95% of the data, analyzed using a Mann–Whitney non-parametric test. Spearman correlation testing was used to determine correlations between miRNA and mRNA expression. PrimeFlow data were analyzed using a non-parametric statistical test (Friedman test ANOVA followed by Dunn’s multiple comparisons test). Statistical analyses were performed with GraphPad Prism 9 software (GraphPad Software Inc., San Diego, CA, USA). p < 0.05 was considered significant.
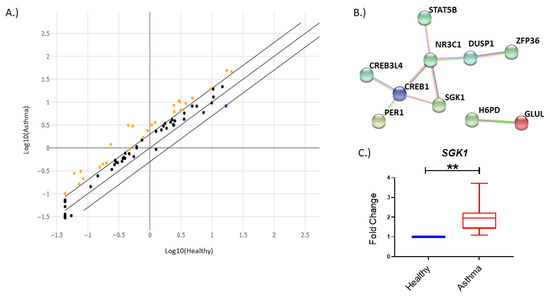
4. DiscussionIn recent years, miRNA regulation in airway and immune diseases has become a topic of increasing interest. Although the dysregulation of numerous miRNAs in circulation or locally in the lung have been identified [
7], the mRNAs that they target and the effects of this targeting are still understudied. Therefore, we sought to determine genes dysregulated in the glucocorticoid signaling pathway in individuals with asthma compared to their healthy counterparts. Additionally, we wanted to identify and examine the relationship that miRNAs may have in regulating our candidate genes. Here, we observed that the gene SGK1 was upregulated in individuals with asthma. Furthermore, we identified a miRNA previously reported to be associated with asthma pathogenesis, miR-19a, that was bioinformatically predicted to bind SGK1. We observed a negative relationship between SGK1 and miR-19a in CD4+ T cells during conditions used to stimulate T cell activation in vitro, suggesting that miR-19a may be regulating SGK1. Furthermore, we found that there was direct binding of SGK1 mRNA to miR-19a by pulldown assay. These data suggest that miR-19a interacts with SGK1 in CD4+ T cells. Lastly, we observed that during polarization of naïve CD4+ T cells, there was a significant negative correlation between miR-19a and SGK1 during early TH2 cell polarization. Collectively, our data suggest a direct regulatory relationship between SGK1 and miR-19a in CD4+ T cells.Murine studies have previously indicated a role for Sgk1 in T cell polarization, but to date, this role has not been examined in humans [
11,
12,
13,
14]. In a T cell-specific knock out of Sgk1, Heikamp and colleagues found that Sgk1 was required for the proper polarization of TH2 cells. Furthermore, they found that T cell Sgk1−/− mice did not respond to allergen challenge in a murine model of allergic asthma [
12]. In line with these findings, we observed that SGK1 was increased in circulating PBMCs, including T cells, from asthmatic individuals (
Figure 1). Additionally, we found that in human subjects, SGK1 levels indeed appeared to have a role in polarization of CD4+ naïve T cells to a TH2 cell phenotype during the early stages of T cell polarization. By focusing on the kinetics of the transcript, we observed that levels of SGK1 fluctuated over the course of a 10-day polarization procedure, where the strongest correlation between SGK1 and miR-19a was observed in early TH2 cell polarization (
Figure 6E). Moreover, using our in vitro models of T cell activation and polarization, we were able to probe the kinetics of both the target transcript and regulator in CD4+ T cells (
Figure 3A–C,
Figure S2A–I and
Figure 6A–G). This insight into differential mRNA and miRNA expression will allow future studies to examine the points where changes in both the transcriptome and proteome may be optimal to study T cell polarization.Most work on the role of SGK1 in T cell development has focused on its role in the TH17-Treg axis [
11,
13]. We also found that there was a strong positive correlation of the SGK1 transcript to RORC, the gene encoding for the TH17 transcription factor RORγt (
Figure 2D), in whole PBMC cultures. However, we were not able to further explore the TH17-SGK1 relationship due to small numbers of RORγt+ cells in our PrimeFlow assay and lack of optimal TH17 polarization conditions (data not shown). Most recently, Wu et al. identified Sgk1 as an enhancer of TH9 cell differentiation and examined its role in murine models of asthma [
14]. Like previous studies, our findings suggest a role for SGK1 in asthma [
12,
14]. Though asthma has long been believed to be primarily T2-driven, multiple phenotypes have emerged in recent years, and many exhibit a non-T2 phenotype [
2]. Our demonstration of the position of SGK1 at the axis of T cell differentiation may indicate its role in the pathogenesis of multiple asthma phenotypes.miR-19a belongs to the miR-17~92 cluster of miRNAs, and silencing the miR-17~92 cluster has been shown to impair TH2 cell responses [
2,
6,
7]. Our data support this finding, suggesting a role for miR-19a during early T cell polarization. Furthermore, profiling of miRNA expression in human airway T cells showed that miR-19a is highly expressed in individuals with asthma [
15]. We have also observed that miR-19a is expressed in circulating CD4+ T cells (
Figure 3 and
Figure 4). Interestingly, decreasing miR-19a activity by inhibitors reduced TH2 cytokine production by both human and mouse TH2 cells. miR-19a was further shown to promote TH2 cell activity through targeting PTEN, SOCS1 and A20. Interestingly, mouse studies have demonstrated that the miR-17~92 cluster regulated inflammatory properties of innate lymphoid cell type 2 (ILC2) activity and revealed overlapping miRNA-regulated gene expression networks in ILC2s and TH2 cells [
25].In our study, we used a pre-determined panel of genes that focused on the glucocorticoid signaling pathway to identify differences between healthy and asthmatic individuals. While this method is relatively quick and provides easy-to-process data, it will not uncover all changes in either the pathway or the samples assayed. Similarly, we examined only a handful of miRNAs that were reported to play a role in asthma and/or glucocorticoid signaling [
7,
22]. In the future, it would be interesting to profile these subjects using a more in-depth screening technique such as single-cell or total RNA sequencing. In single-cell RNA sequencing, circulating naïve, helper and memory T cells could be directly isolated and examined on a cell-to-cell basis for SGK1 expression in combination with T cell transcription factors. This type of screening could aide in our understanding of the gradients of T cell differentiation. Recent advances may soon allow for small RNA determination in single-cell RNA sequencing [
26]. This development would provide the possibility to capture and analyze miRNA–RNA relationships on the single-cell level. Due to the complex regulatory nature of miRNAs, it is highly unlikely that miR-19a is the only miRNA that regulates SGK1. We observed that under different treatment conditions, miR-19a appears to bind differently to SGK1 mRNA (
Figure 5B). This could be the result of multiple binding sites being targeted in the SGK1 3′UTR or one of the binding sites being inaccessible during a particular treatment, potentially due to another RNA or protein binding to SGK1. Future studies are warranted to determine which 3′UTR binding site in SGK1 is important in T cell activation/polarization.
Our findings suggest a role for SGK1 as a potential future target in asthma. As we observed that SGK1 transcript levels were upregulated in individuals with asthma, this may alter the polarization of TH2 cells, leading to aberrant T2 signaling. Therefore, modulation of SGK1 levels may be an alternative method to dampen the T2 immune response instead of the commonly used ICS treatment. However, a larger validation cohort would be required to more definitively determine if increased SGK1 expression is specific to asthma or subgroupings of asthma. Moreover, the downstream impact of altering SGK1 levels in humans would have to be explored.
Although SGK1 was found to be upregulated in individuals with asthma, SGK1 and miR-19a in CD4+ T cells appear to have a common regulatory relationship, independent of the disease. Our initial screen was performed in total PBMCs; thus, an additional cell type(s) may at least partially contribute to the increased SGK1 expression observed in cells from asthmatic individuals. Moreover, our treatment of PBMC cultures with αCD3/αCD28 may have simulated a strong T cell activation. This strong activation may have somewhat normalized how T cells react, making the differences between cells from healthy and asthmatic individuals negligible. Due to limitations in sample collection, we were not able to recruit additional asthmatic subjects to examine miR-19a and SGK1 expression in polarized, CD4+ naïve T cells. However, it appears that the relationship of miR-19a and SGK1 is present in individuals both with and without asthma, suggesting a general mechanism during T cell polarization. We recognize that the cohort for these supporting data is relatively small; however, we have consistent expression patterns of miR-19a and SGK1 in situ via PrimeFlow and in vitro during early polarization, strengthening the confidence in the data.
In conclusion, our data suggest that the regulation of SGK1 via the binding of miR-19a occurs at early stages of T cell polarization. Thus, further studies examining SGK1 and miR-19a are warranted to determine their precise role in T cell polarization and the development of asthma in humans.


留言 (0)