
記住我
We purchased wild type C57BL/6 mice (male, 10-week-old, 25–30 g on arrival) from Charles River Laboratories (Wilmington, MA). The mice were housed and kept in a colony room with food and water available ad libitum. The colony room was maintained on a 12:12 light to dark cycle and ambient temperature at 23.0 °C ± 1.5 °C. All procedures were conducted in accordance with the National Institutes of Health’s Guide for the Care and Use of Experimental Animals and were approved by Eastern Virginia Medical School’s Institutional Animal Care and Use Committee (protocol number: 20-010). The CRHR2 specific antagonist, As-2B, was purchased from Tocris (catalog# 2391).
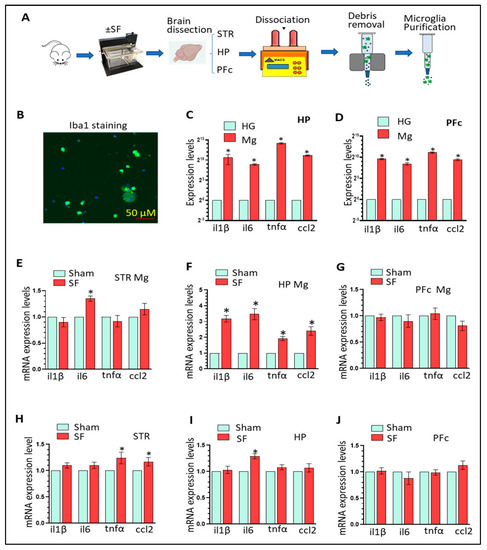
2.2. SF ProcedureWe performed SF by using commercial, validated devices (Lafayette Instruments, Sleep Fragmentation Chamber, model 80391) that employ an automated sweeper arm moving across animal cages. In brief, the mice were randomly divided into two groups receiving sham/SF (n = 18 ± SF). All mice were placed into the devices one day prior to the start of SF to let them become familiar with the environment of device. For SF, sleep was interrupted at 2 min intervals during the 12 h light period (7 AM–7 PM). This SF protocol in mice has been shown to produce moderate to severe SF [40,41,42] without significantly reducing overall sleep or impacting sleep macro- or micro-architecture [41,42]. During the 12 h dark period, the motorized sweeper was stopped letting the mice be free to behave normally. The mice were observed daily to assess their health. Sham animals were maintained in their home cages without any interruption. The mice were subjected to three-weeks of SF and sacrificed one day after the last SF session. The mice were randomly assigned into three subgroups (sub1-3, n = 6): the brains of sub1 mice were subjected to protein/RNA extractions, the brains of sub2 mice were used for slide preparation, and the brains of sub3 mice were used for adult Mg isolation (in striatum, HP, and PFc). Liver, spleen, and gut were collected for total RNA extractions (n = 6). 2.3. Adult Microglia IsolationMice were anesthetized with 4% isoflurane and transcardially perfused with 1X PBS followed by brain removal. The brains were then y dissected into different regions including the striatum, HP, and PFc. The brain parts were pooled for adult microglia isolation (MACS dissociation kits, Miltenyi Biotech Company, Bergisch Gladbach, Germany). Briefly, around 300–500 mg of brain tissue were homogenized in 2 mL enzyme mixture by using a gentleMACS™ Octo Dissociator (Miltenyi Biotech Company, Bergisch Gladbach, Germany) at 37 °C for 30 min. The homogenates were then transferred to MACS® Smart Strainer with centrifuging at 300× g for 10 min at 4 °C. The pellets were then processed for debris and red blood cell removal and dissolved in 500 µL labelling solution. Subsequently, the acquired cells were incubated with 15 µL CD11b beads for 15 min at 4 °C. The labeled cells were sent through a column in a magnetic field. The purified microglia were then suspended in 1 mL 1X PBS with 0.5% BSA and quantified by Countess 3 (Thermo Fisher, Waltham, MA, USA). The CD11b positive cells were seeded into 24-well plates for Ib1 immunostaining. The remaining purified microglia were stored in a freezer at −80 °C for later biochemical analysis.
2.4. Primary Microglia and BV2 Cell CulturePrimary microglia (PM) were obtained from 1- to 3-d-old C57BL/6 newborn pups. The brains were removed and cut into small pieces in Hank’s buffered salt solution (Invitrogen, 14025076). Then, the brain tissues were incubated in 0.25% trypsin (Invitrogen, 25300-054) for 15 min. After filtration with 70 µM strain, the mixed glial cultures were resuspended in DMEM (Invitrogen, 11995-065) with 10% heat-inactivated FBS (Invitrogen, 16000-044) with 100 U/mL penicillin, and 0.1 mg/mL streptomycin. We placed PM at 20 × 106 cells/flask density onto 75 cm2 cell culture flasks. The cell medium was replaced every 3 d, and after the first medium change, macrophage colony-stimulating factor (Invitrogen, PHC9504) 0.25 ng/mL was added. When confluent (7 to 10 d), mixed glial cultures were shaken gently by hand to promote microglia detachment from the bottom. We then collected the floating PM from each flask and centrifuged them at 1000× g for 5 min. PM were plated on 6-well plates for all subsequent experiments. The purity of microglial cultures was evaluated by Iba 1 immunostaining (Wako Pure Chemical Industries, 019-19741).
The BV2 cell line was obtained from Dr. Sanjay Maggirwar (University of Rochester Medical Center, Rochester, NY, USA) and was grown and routinely maintained in DMEM with 10% FBS at 37 °C and 5% CO2 and used up to passage 30.
2.5. Microglia TreatmentPM and BV2 cells were cultured in vitro with DMEM (10% FBS). Microglia were seeded into 6-well plates with 80% confluence and cultured overnight. The next day, microglia were replaced with fresh DMEM (FBS free) and exposed to CRH with varying doses (25–200 nM) for 6 or 24 h. For pre-treatment, microglial cells were exposed to As-2B at 100 nM for 45 min followed with CRH exposure. At indicated time points, microglial cells were collected either for RNA or protein extractions.
2.6. RNA Extraction, Reverse Transcription, and Quantitative (Q) Polymerase Chain ReactionAround 100–200 mg of brain tissue or 1 × 10⁶ microglia were directly added to 1 mL Trizol (Invitrogen). Brain or microglial lysates were briefly sonicated (3–5 s) with 70% power amplitude on ice and incubated for 20 min on ice. The lysates were centrifuged at 10,000× g for 10 min and the supernatants were transferred into new 1.5 mL microcentrifuge tubes with 0.2 mL of chloroform added. After vigorous vertexing, the lysates were centrifuged at 10,000× g for 15 min at 4 °C. The upper aqueous phase was transferred to a new tube following with 500 µL isopropyl alcohol add. Samples were incubated at room temperature for 10 min and centrifuged at 10,000× g for 10 min to precipitate total RNA. The RNA was washed with 75% ethanol. After 15 min drying at room temperature, the total RNA was dissolved in DEPC-treated H2O and quantified by Nanodrop. Reverse transcription (RT) reactions were performed using a Verso cDNA kit (Invitrogen). The reaction system (20 µL) contained 4 µL 5X cDNA synthesis buffer, 2 µL dNTP mix, 1 µL RNA primer, 1 µL RT enhancer, 1 µL Verso enzyme Mix (Invitrogen), total RNA template 1500 ng, and a variable volume of water. Reaction conditions were set at 42 °C for 30 min following with 85 °C for 5 min. QPCRs were performed using One-Step advanced qRT-PCR Kits (Invitrogen). Reaction systems were set up as follows: 10 µL Master mix, 1.0 µL primers, and 1 µL cDNA and 8 µL distilled H2O. A QS3 qPCR machine (Invitrogen) was employed for qRT-PCR Mouse primers for tnfα il6, il1β, ccl2, and CRH were purchased from Invitrogen (Mm00443258, Mm00446190, Mm00434200, Mm00441242, and Mm01288386, respectively). Mouse GADPH (Invitrogen, Mm99999915) was used as internal control for RNA quantification.
2.7. Western BlotsAround 50–100 mg brain tissue or one 6-well plate microglia were dissolved in 200 µL RIPA buffers with proteinase and phosphatase inhibitors (Thermo Fisher Scientific, Waltham, USA) followed with sonication for 5 s on ice with 70% amplitude (Thermo Scientific). The brain or cell homogenates were incubated at 4 °C for 30 min and then centrifuged at 12,000× g for 10 min. The protein supernatants were taken out and quantified through the BCA method. Equal amounts of the proteins (40 µg) were electrophoresed in a sodium dodecyl sulfate-polyacrylamide gel for one hour at 160 V and transferred to immobile PVDF membranes at 180 mA for 90 min. The blots were blocked with 3% nonfat dry milk in Phosphor-buffered saline (PBST). The Western blots were then incubated with indicated antibodies at 3% non-fat milk overnight at 4 °C. The next day, the PVDF membranes were washed three times with PBST and incubated with IRDye fluorescent mouse or rabbit second antibody for 60 min at room temperature. After three washes with PBST, the membranes were put into the Odyssey® Imaging System (Li-Cor Company, USA) for image development and the intensity of target fluorescent band was quantified using Image Studio™ Software (Li-Cor Company, Lincoln, USA). After imaging, the membranes were washed and blocked and re-probed with β-actin for normalization. The following antibodies were used: microglial marker CD11b (1:2000, NBP2-19019), astrocyte marker GFAP (1:5000; Abcam, ab7260), NLRP3 (1:2000, adipogen, AG-20B-0014-C100), Iba1 (1:2000, NBP2-19019), beclin1 (1:2000, NB500-249), LC3B (1:2000; NB100-2220), SQSTM1 (1:2000; Novus Biological, H00008878-M01); LAMP2 (1:2000; NB300-591); TFEB (1:2000; cell signaling technology, #4240), LAMP1 (1:2000; NB120-19294); CRH (1:2000, Abcam, ab184238); CRFR1 (1:1000; Sigma, SAB4500465); CRFR2 (1:1000, Sigma, SAB4500467); galectin 3 (1:2000, Abcam, AB2785), cathepsin B (Abcam, AB214428). Second antibodies were bought from Li-COR including IRDye® 680RD Donkey anti-Mouse (1:5000) or rabbit IgG; IRDye® 800CW Donkey anti-Mouse or rabbit IgG (1:5000). β-actin was purchased from Santa Cruz (1:2000, sc-8432) or from Sigma (1:2000, A2066).
2.8. Immunofluorescence StainingSF/Sham experienced mice were anesthetized with 4% isoflurane and transcardially perfused with 1X PBS followed fixed with 4% PFA. The brains were taken out and put into 4% PFA solution overnight at 4 °C. The brains were then washed with 1X PBS three times. The brains were embedded and sectioned (5 µM) by the EVMS histology core facility. Brain sections were co-incubated with primary anti-Iba1 antibody (1:500, Wako Pure Chemical Industries, Osaka, Japan, 019-19741) or anti-GFAP antibody (1:500, ab7260, abcam) overnight at 4 °C. Secondary AlexaFluor 488 goat anti-rabbit IgG (A-11008) or AlexaFluor 594 goat anti-mouse (A-11032) (Thermo Fisher Scientific Waltham, MA, USA) was added for two hours to detect Iba1 and GFAP, followed by mounting of sections with prolong gold antifade reagent with 4,6-diamidino-2-phenylindole (Thermo Fisher Scientific, Waltham, MA, USA, P36935). Fluorescent images were acquired on a Zeiss fluorescent microscopy. ZEN pro software (Carl Zeiss, Thornwood, NY, USA) was employed to process and analyze the intensity of Iba1 and GFAP signals. For the fluorescence intensity quantification of Iba1 or GFAP, two slices picked from per mouse were imaged and quantified for three mice in each group. Images were obtained under identical exposure conditions (20 X magnitude). All Iba1+ or GFAP+ cells were detected based on the threshold fluorescence intensity of each cell, soma diameter and manual counting tool within the counting frame of the interested regions. Then, by automated measurement, the mean intensity of each soma was measured and data were compared between sham and SF groups and shown in fold changes.
2.9. ImmunocytochemistryPM or BV2 cells were plated on 24-well plates with coverslips. The next day cells were fixed with 4% PFA for 15 min at room temperature. Then, cells were treated with 1X PBS with 0.3% Triton X-100 (Fisher scientific, BP151-1). Cells were then incubated with a blocking buffer containing 10% normal goat serum in PBS for 1 h at room temperature followed by addition of rabbit anti-LC3B (1:300) or galectin 3 (1:500) or cathepsin B (1:250) antibody and incubated overnight at 4 °C. The next day, secondary Alexa Fluor 488 goat anti-rabbit IgG or anti-mouse IgG (Invitrogen, A11008) were added at a 1:500 dilution for two hours at room temperature. Cells were then washed 3 times in buffer and mounted with prolong gold antifade reagent with 4,6-diamidino-2-phenylindole (Invitrogen, 36935). Fluorescent images were acquired on a Zeiss fluorescent microscopy under the same exposure conditions and analyzed by ZEN lite software. For Gal3, LC3B, and Cat B puncta analysis, the average numbers of puncta per cells were calculated by the total puncta numbers divided by the total cell numbers in each field. The puncta numbers were counted manually in six randomly selected fields for each sample and at least 50 cells were selected for each treatment.
2.10. Statistical AnalysisAll data are expressed as means ± the standard error of the mean (SEM). Data were statistically evaluated by unpaired student-t tests or one-way ANOVAs using GraphPad Prism 9 (La Jolla, CA, USA). Tests with probability levels of <0.05 were considered statistically significant.
4. DiscussionCSDs are prevalent around the world, contributing to the increased risks of multiple neurodegenerative and neuropsychiatric diseases in modern society. Microglial activation has been suggested as a critical factor involved in CSD-mediated brain dysfunction but the underlying mechanisms remain unknown. In this study, we determined that the hippocampal CRH system is sensitive to sleep disturbances and is responsible for CSD-mediated microglial activation in vivo. Mechanistically, CRH upregulates Gal3 expression and induces lysosomal impairment in vitro and in vivo. Overall, our findings suggest a novel mechanism responsible for CSD-mediated microglial activation.
One of our interesting findings is that three-weeks of SF had direct activation effects on purified Mg isolated from the HP but only had marginal effects on neuroinflammation levels of HP homogenates that included all types of brain cells including astrocytes, neurons, oligodendrocytes, endothelial cells, etc. It is possible that other types of brain cells are not sensitive to three weeks of SF and might actually mask the activation effects of SF on Mg (Mg account only 10–15% of all brain cells) when we performed homogenate analysis. Indeed, we did not find astrocytes activation in the three brain regions we examined in SF mice. This discrepancy with previous investigations [43] is probably due to the time period of SF (three weeks of SF vs. two month of SF) or the type of sleep disturbance (SF vs. sleep deprivation) [19]. Regardless, our findings suggest that hippocampal Mg activation is an early event induced by SF and might contribute to CSD-mediated neurological symptoms such as memory and cognitive performance if sleep problems continue.The CRH system is very sensitive to various types of stress including sleep disturbances. Increased CRH levels/activity has been found in both rodent models of sleep disorders and in patients with sleep problems [51,52]. Classically, CSDs increase the activation of the hypothalamic-pituitary-adrenal (HPA) axis by enhancing CRH levels in the paraventricular nucleus of the hypothalamus. Then, CRH is secreted from CRH producing neurons and acts on the anterior pituitary gland to initiate a cascade of stress responses [53,54]. Recently, accumulating evidence indicates that the CRH system (CRH and CRHRs) is also highly expressed in extra HPA regions including the STR, HP, PFc and is sensitive to sleep problems [31,32,33]. In addition, amygdala CRH has been well-investigated with respect to the effects on fear-induced reductions in sleep indicating reciprocal interactions between the CRH system and sleep disturbances [55,56,57]. In this study, we demonstrated that CRH system activity was increased in the HP by three weeks of SF, adding more evidence that CRH in extra HPA regions is also tightly regulated by sleep disturbances. Interestingly, we did not observe CRH system dysregulation in the STR and PFc indicating that the hippocampal CRH system may be more sensitive than other brain regions and that the alterations in the hippocampal CRH system is an early event induced by sleep disturbances.The mechanisms by which CSDs induce microglial activation and neuroinflammation in the brain are unclear. Endogenous molecules that could be tightly regulated by CSDs and also function as upstream signals for microglial activation have not been identified. Previous studies showed that CRHR 1 and 2 are expressed in microglial cells with relatively higher levels of CRHR2 [58] and that CRH was capable of increasing mRNA levels of proinflammatory mediators in microglia in vitro [46]. Our results further demonstrate the ability of CRH to activate microglia by showing that CRH upregulates CD11b levels and mILβ in both BV2 cells and PM. Of note, we observed high correlation between CRH upregulation and microglial activation in the HP of SF mice. Therefore, our results strongly suggest that the CRH system could serve as a link bridging CSDs and neuroinflammation in vivo.In searching for down-stream effectors of CRH, we have been focusing on Gal3 which is highly induced in activated microglia and plays critical roles in multiple neuroinflammation and neurovegetative diseases [47,48]. Gal3 belongs to the galectin family which includes 15 members (Gal1-15). Among those members, Gal3 is unique in its “chimera type” structure constituting of a single C-terminal carbohydrate recognition domain and a non-lectin collagen-like N-terminal region [59]. Gal3 could be released from activated microglia and functions as an endogenous ligand to bind Toll-like receptor 4 in neighboring microglia to amply immune responses [60,61]. Gal3 has also been identified as a Trem2 ligand involved in the regulation of the inflammatory response in Alzheimer’s disease [62]. Gal3 has been suggested to be a novel neuroinflammation marker [63] and increased Gal3 levels have been identified in multiple neurodegenerative diseases including Parkinson’s disease, Alzheimer’s disease, Huntington’s disease, and amyotrophic lateral sclerosis [47,48]. In vitro, Gal3 can be induced by several stimulators including LPS [64] and amyloid [65]. The roles of Gal3 in neuroinflammation in the context of sleep disorders are not known. In this study, we showed, in vitro, that CRH could upregulate Gal3 expression in BV2 and PM and that CRHR2 blockage could reverse CRH-mediated Gal3 upregulation. Additionally, CRH could increase Gal3 puncta formation in vitro. These results demonstrate that Gal3 is a novel substrate regulated by CRH and suggest that Gal3 may be involved in CRH-mediated microglial activation. Gal3 upregulation was also identified in the brains of SF mice indicating that Gal3 might play critical roles in CSD-mediated neuroinflammation in vivo. The mechanisms responsible for Gal3 upregulation by external stimuli are mostly unknown though previous investigations showed that miR-124 could target Gal3 and inhibit Gal3 expression [66]. Since miR-124 is abundantly expressed in resting microglia and decreased in activated microglia [67,68], it could be worthwhile to explore whether CRH could decrease miR-124 levels leading to Gal3 upregulation and we have an ongoing project for this purpose.CRH is capable of interacting with autophagy processes [69,70,71] and autophagy dysregulation has demonstrated roles in regulating inflammation and microglial activation [72,73]. We showed that CRH upregulated the levels of becin1, LC3BII, and p62 in PM as well as the increased formation of the autophagosome indicating that CRH could dysregulate autophagy by blocking autophagosome and lysosomal fusion. Normal lysosome degradation is critical for the completion of the autophagy process. In addition to being a neuroinflammation marker, Gal3 is also a well-accepted earlier marker for lysosomal damages [49]. When a lysosome is damaged or shows increased membrane permeability, Gal3 could gather around the disrupted lysosomes forming dot-like pattern. Such a response could initiate lysophagy to remove the damaged lysosomes. Interestingly, our results showed that CRH could induce a Gal3 dot-like expression pattern in microglial cells as early as 2 h post-treatment and persist 24 h post-treatment. In parallel, lysosomal Cat B showed a more diffuse expression pattern in cells implying the translocation from lysosomes into cytoplasm. Taken together, these results indicate that CRH could impair lysosome degradation by inducing LMP which ultimately results in autophagy dysregulation. Therefore, autophagy dysregulation is also involved in CRH-mediated Mg activation.We showed that CRH could upregulate Gal3 levels and lysosomal damage in Mg. However, the sequence for these two events is not clear. They could happen simultaneously or consecutively. There is no evidence that Gal3 can directly induce lysosomal damage though it is an earlier maker for such damage. It is possible that Gal3 activates the TLR4/NF-κB pathway or other unknown signals leading to increased levels of ROS which is capable of inducing LMP. Another possibility is that lysosomal damage come first which induces Gal3 expression. In each of these possibilities, Gal3 and lysosomal damage might work synergistically leading to Mg activation.
留言 (0)