Study Design and Population
Data for this study were obtained from previous trials conducted by the Dutch GBS Study Group investigating the clinical effect of IVIg in patients with GBS [5, 18]. First, a multicenter randomised controlled trial was conducted to compare the effects of IVIg (0.4 g/kg/day for 5 days, intermittent intravenous infusion) with plasma exchange [5]. Later, a double-blind, placebo-controlled, multicenter, randomised trial was performed to investigate the effect of concomitant treatment with methylprednisolone (MP) administered intravenously (500 mg over 5 days) or placebo starting within 48 h of the first IVIg (0.4 g/kg/day for 5 days) course [18]. All patients fulfilled the diagnostic criteria for GBS, were unable to walk independently at study entry, and received the same IVIg regimen of 0.4 g/kg/day for 5 consecutive days. Serum samples were obtained before the start of treatment, if possible; and 2 weeks, 4 weeks, 16 weeks, and 26 weeks after the start of treatment.
To define the pharmacokinetics of IVIg before the first 2-week follow-up visit, and to obtain more robust predictions, we included previous results on serum IgG levels from 15 patients with chronic inflammatory demyelinating polyneuropathy (CIDP). All patients with CIDP had stable disease and were treated with a fixed IVIg maintenance regimen [19].
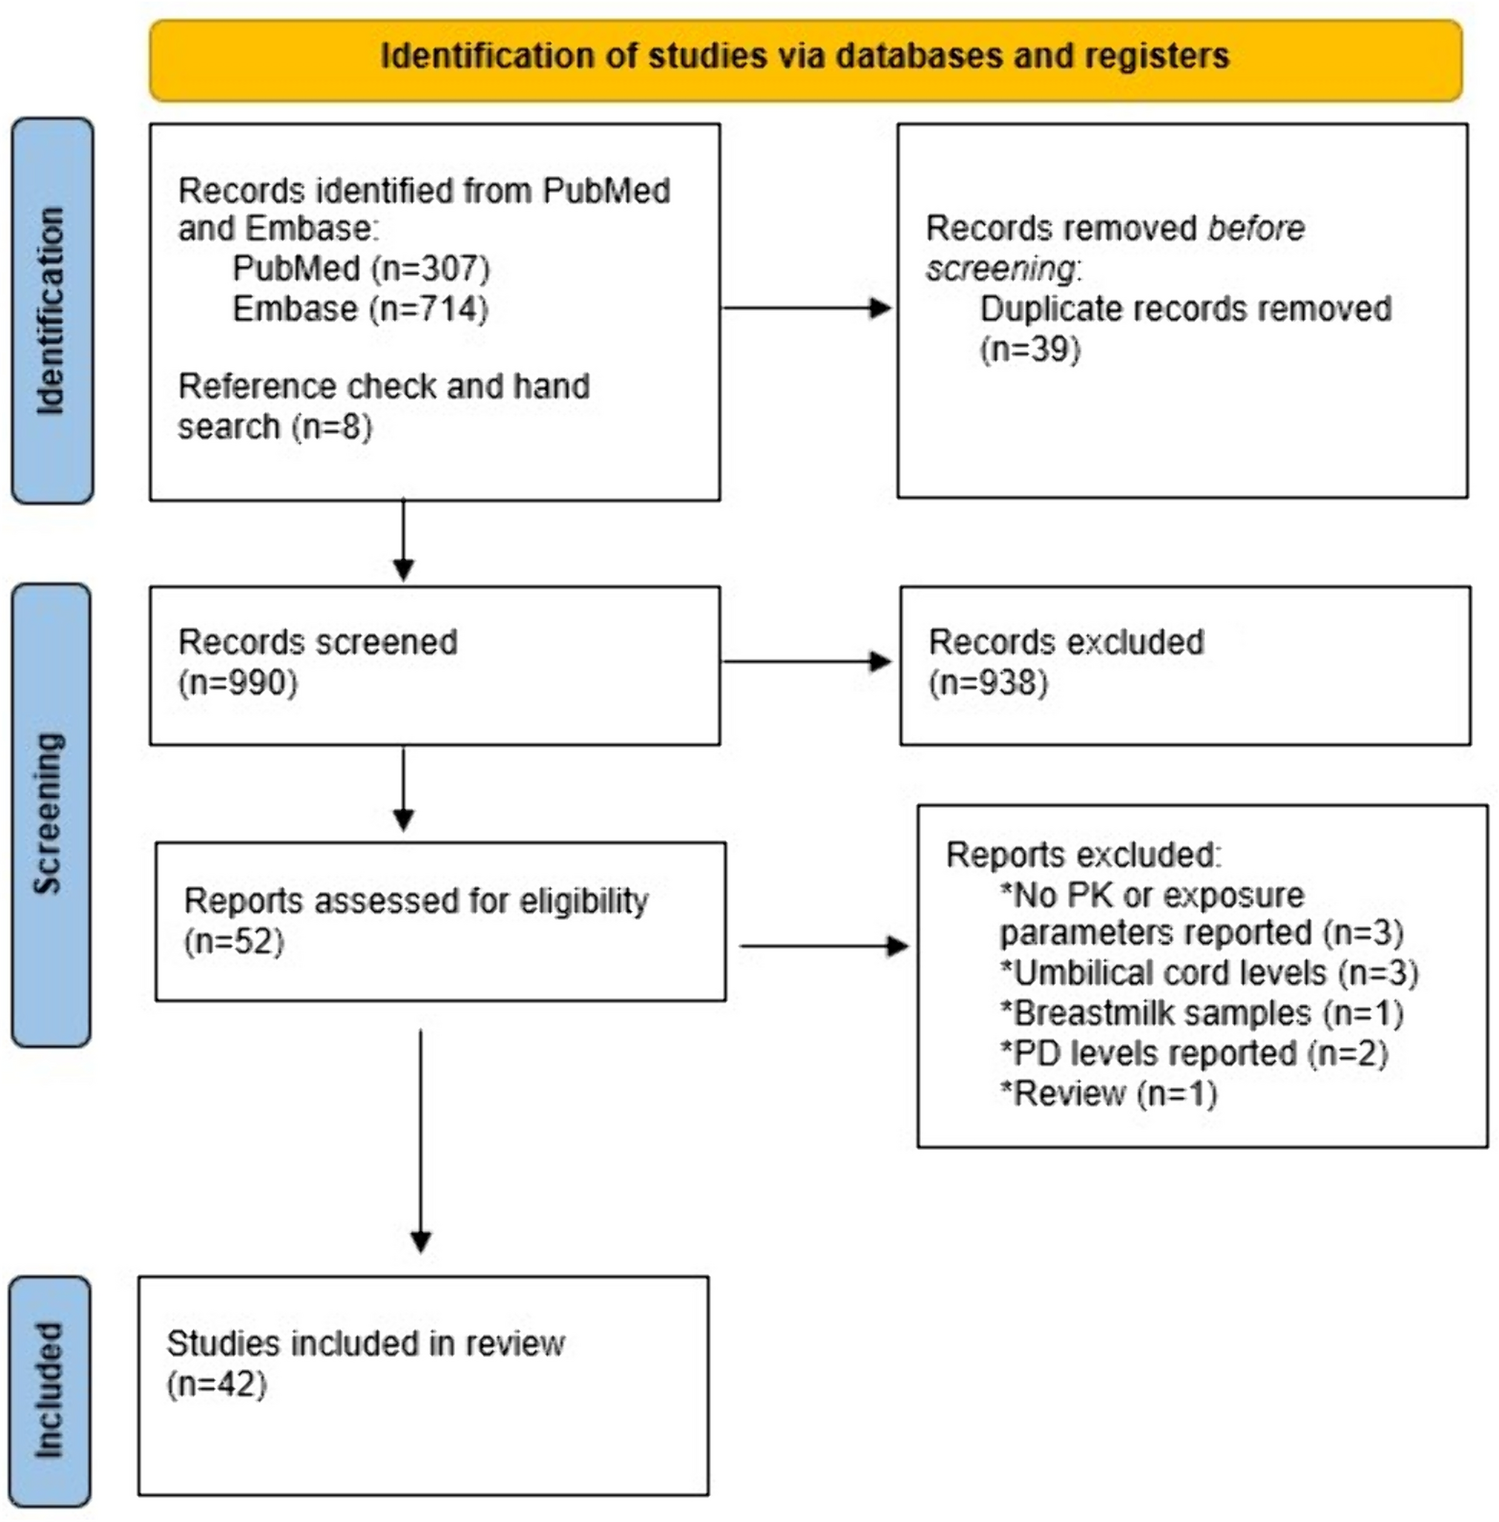
For the evaluation cohort, we included patients from the SID-GBS trial, in which patients with a poor prognosis were randomised for either a placebo or a second IVIg course [16]. Patients with a good prognosis only received a standard IVIg course (0.4 g/kg/day for 5 days) and were not randomised, but their follow-up and assessment of outcome parameters were equal to randomised patients. The randomised patients were not included in this analysis. Exclusion criteria are described in the SID-GBS study [16]. Additionally, patients were excluded when no serum sample was available after treatment, when dose and weight were missing, or when multiple IVIg courses were given (outside the study protocol). Out of 215 patients with a good prognosis in the SID cohort, 177 patients with GBS met the inclusion criteria for this study. All patients with GBS in the model-building cohort received the same IVIg product (Gammagard S/D®; Baxter, Vienna, Austria). The patients with CIDP were predominantly treated with an IVIg product from the same manufacturer (Kiovig/Gammagard liquid; Baxter) except for three patients taking Privigen® (CSL Behring, Marburg, Germany). The patients with GBS in the validation cohort received the preferred brand of the participating hospital, mostly Nanogam® (Sanquin, Amsterdam, the Netherlands), Privigen® or Kiovig®. This retrospective study was exempted from the Medical Research Involving Human Subjects Act (Dutch law, WMO) by the Institutional Review Board of Erasmus University Medical Center Rotterdam (reference number: MEC-2016-173).
Laboratory Analysis and Clinical Outcomes
Serum samples were aliquoted and stored at – 80 °C until use. Total IgG levels were determined by routine diagnostic turbidimetry, as described earlier [5, 12, 16]. All samples in the model-building cohort and the validation cohort were tested for IgG on the same platform in 2009 and between 2018 and 2019, respectively. Polymerase chain reaction was used in a subset of patients with GBS (n = 71) to determine the Fc Fragment of IgG Receptor and Transporter (FCGRT) variable number of tandem repeats (VNTR) for the IgG recycling neonatal Fc-Receptor (FcRn) [12, 20].
As clinical outcome measures, the Medical Research Council sum score (MRC-SS) and GBS disability score (GBS-DS) were assessed at every visit. The MRC-SS is a measure for limb weakness and ranges from zero (quadriplegic) to 60 (regular strength) [21]. The GBS-DS is the most frequently used outcome measure for GBS and ranges from zero (no disability) to 6 (death) [22].
PK Analyses
The PK model was developed using nonlinear mixed-effects modelling (NONMEM version 7.4.0; ICON Development Solutions, Ellicott City, MD, USA) and PsN version 4.2.0 [23, 24]. Models were fitted using first-order conditional estimation with interaction. Tools used for visual inspection and evaluation of the model were Pirana version 3.0.0 (Certara, Princeton, NJ, USA), R version 4.0.5 (R Foundation for Statistical Computing, Vienna, Austria), Rstudio version 1.4.1106, Xpose version 0.4.13 and Xpose4 version 4.7.1 [25, 26].
Base-Model Development
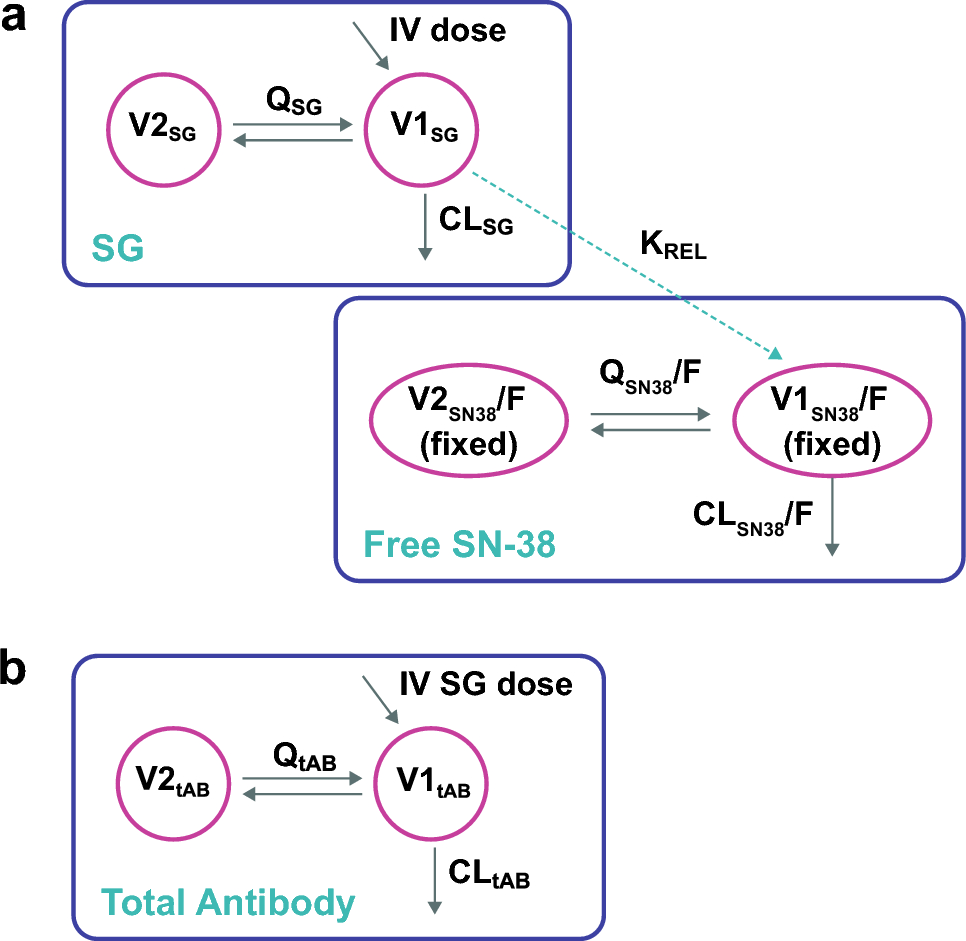
One-compartment and two-compartment distribution models were considered. To obtain estimates of the total IgG level, which is the sum of endogenous IgG and IVIg-derived IgG, we incorporated the endogenous IgG production as a baseline concentration (CBAS) in the model. Patients with CIDP have a higher steady-state baseline IgG level because of prolonged maintenance treatment. The typical value for CBAS and the effect of disease type were included in the base model according to the following equation:
$$\mathrm= _ }\times _}}^},$$
where θCBAS is the population parameter estimate for CBAS and θT is the population parameter estimate for disease type (TYPE = 1 for GBS, and TYPE = 0 for CIDP). Typical values for CL, inter-compartmental CL (Q), and volume of distribution were estimated. Inter-individual variability (IIV) was evaluated for each PK parameter using an exponential model. Residual variability was evaluated according to an additive and/or proportional error model. To account for the effect of variable body weight across size-dependent parameters, allometric scaling was used [27, 28]. Model selection was based on the objective function value (OFV) and significant models were checked for realistic parameter estimates, shrinkage values (< 20%), conditional number (< 1000), and visual improvement of goodness-of-fit plots [29].
Covariate Model
Available covariates were selected based on known or theoretical interactions with the pharmacokinetics of IVIg. The following covariates were evaluated: GBS-DS, MRC-SS, MP, dose, preceding diarrhea, sex, age, mechanical ventilation and VNTR (if available). Continuous variables were centred on the median and described using an exponential function. Categorical variables were described using a proportional function. The relationship between covariates and IIV was explored graphically, followed by a univariate analysis of covariates that were visually correlated with PK parameters. Significant covariates in the univariate analysis (p < 0.05, ∆OFV > 3.84) were analysed in a forward inclusion (p < 0.05, ∆OFV > 3.84), followed by a backward elimination procedure (p < 0.01, ∆OFV > 6.64) [30].
Internal Model Evaluation
The final model was internally evaluated using two procedures. First, a bootstrap method was applied, in which the dataset was resampled 1000 times [31]. The stability and performance of the final model were evaluated by comparing the estimates from the original dataset with the parameter estimates derived from the bootstrap. Second, the model was graphically evaluated with a visual predictive check (VPC) with 1000 simulated datasets and stratified on disease type.
External Model Evaluation
External evaluation of the final PK model was performed on an independent dataset containing 177 patients with GBS (SID-GBS) [16]. The simulated predictions obtained from the fixed model parameter estimates using the design of the validation dataset were compared with the observations in the validation cohort, and visualised with a VPC (n = 1000). Predictive performance of the model was evaluated by computing the prediction error and the root mean square error [32]. Predictive performance of the model was further evaluated using a normalised prediction distribution error (npde) analysis. This analysis was performed using 1000 iterations with the npde package (version 3.1) in R [33].
Simulations
The impacts of covariates and alternative treatment regimens on the IVIg concentrations were evaluated using simulations. Monte Carlo simulations (n = 1000) were performed using PK parameters obtained from the final model. The effect of significant covariates was visualised using the standard dosing regimen of 0.4 g/kg/day for 5 days and a bodyweight of 75 kg. Dosing regimens of 0.4 g/kg/day for 3 versus 6 days [34], and 1 g/kg/day for 2 days [35] were assessed for target attainment (∆IgG > 7.3 g/L).


留言 (0)