
記住我

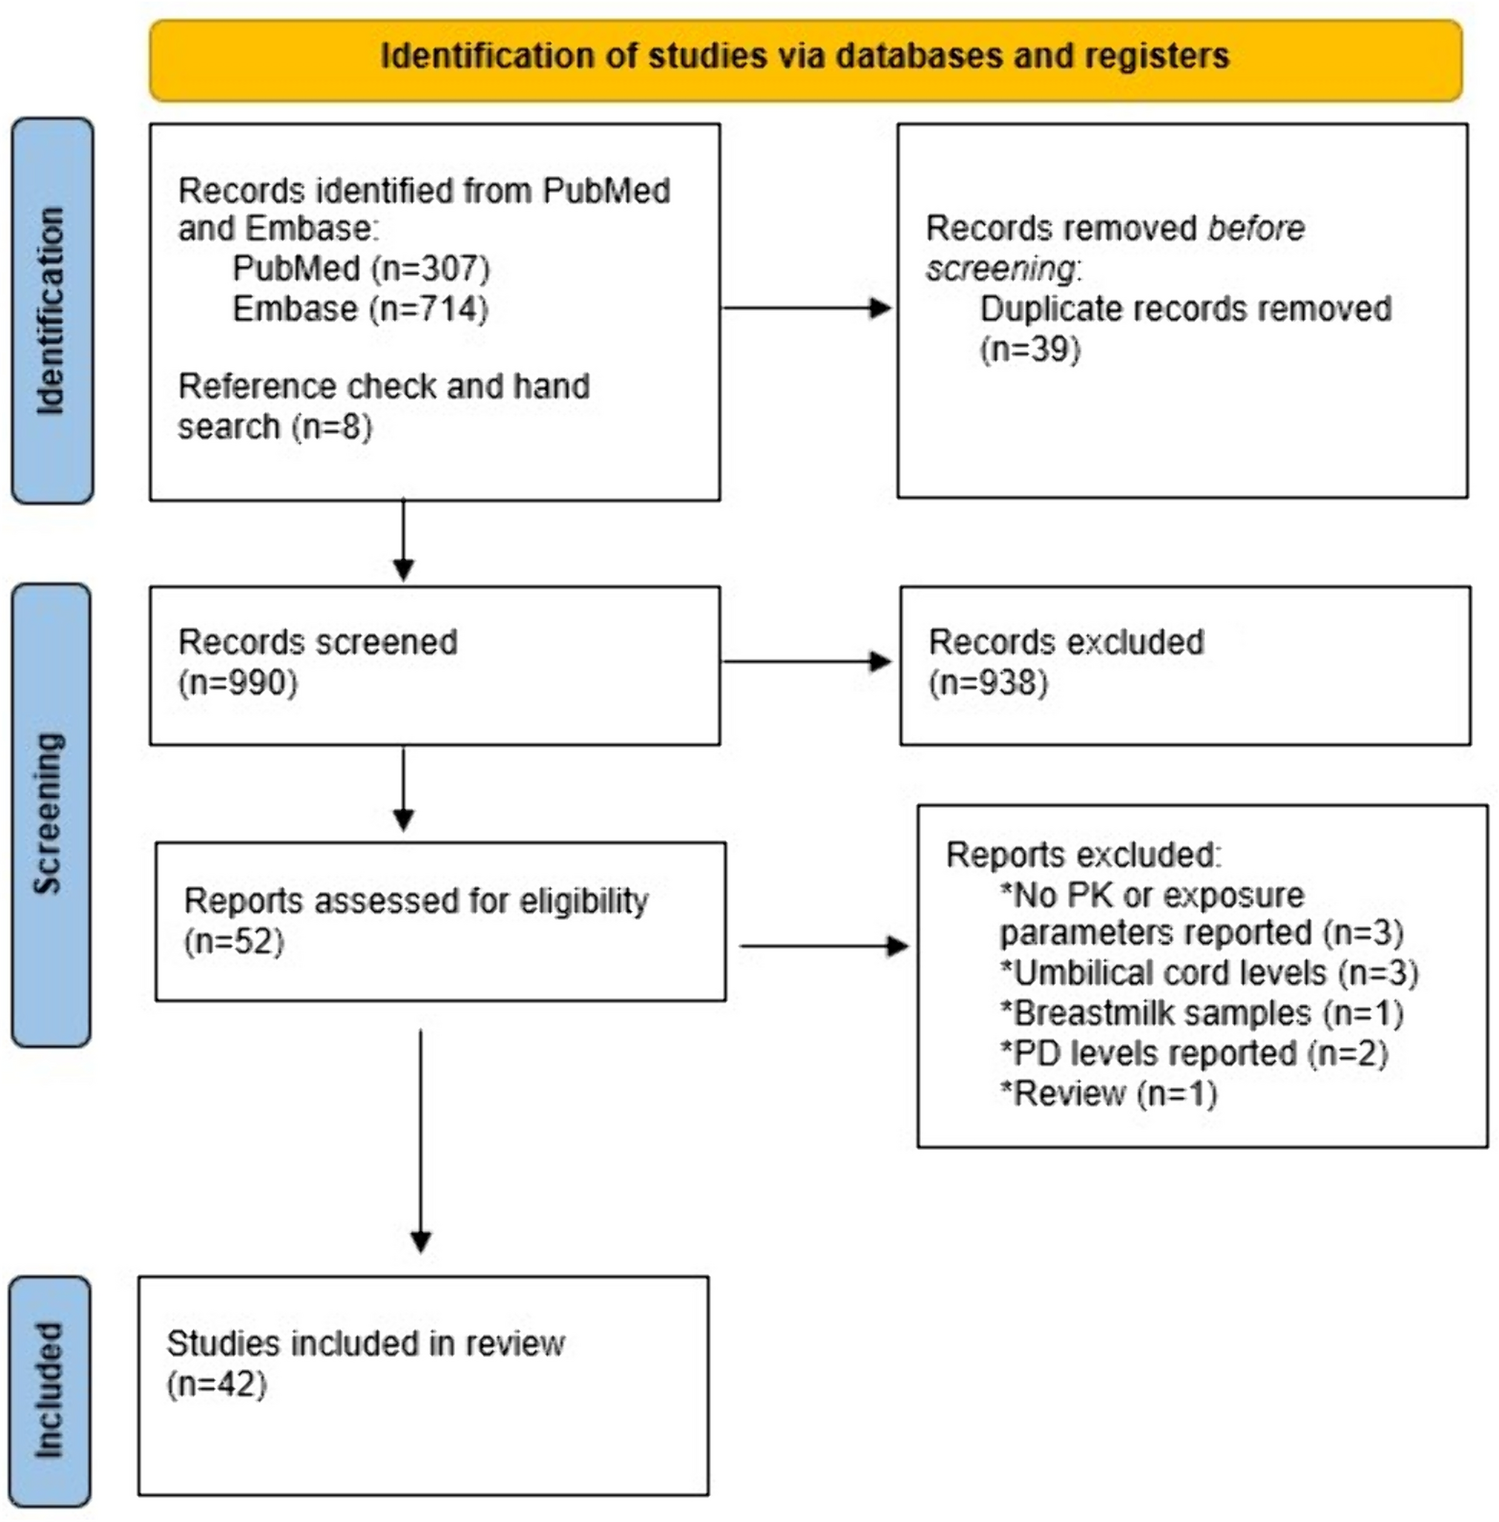


A total of 529 patients were included. Among these, 276 were from the IMMU-132-01 study (mTNBC, n = 24; mUC, n = 36; HR+/HER2– mBC, n = 32) and 253 were from the ASCENT study (all mTNBC). The summary of demographics and clinically relevant baseline characteristics tested as covariates including sex, age, race, body weight, prior treatment, number of prior lines of chemotherapy, Eastern Cooperative Oncology Group (ECOG) status, tumor type, uridine diphosphate glucuronosyltransferase 1A1 (UGT1A1) genotype, liver function, renal function, and Trop-2 expression is provided in Table S2 (see ESM). Most patients were female (78%) with a median age of 58 years (range 27–88) and median body weight of 70 kg (range 37–140). In IMMU-132-01, Trop-2 expression was characterized as weak, moderate, or strong staining by immunohistochemistry [15], whereas in ASCENT, Trop-2 expression was characterized as a numerical histochemical score (range 0–300) [16].
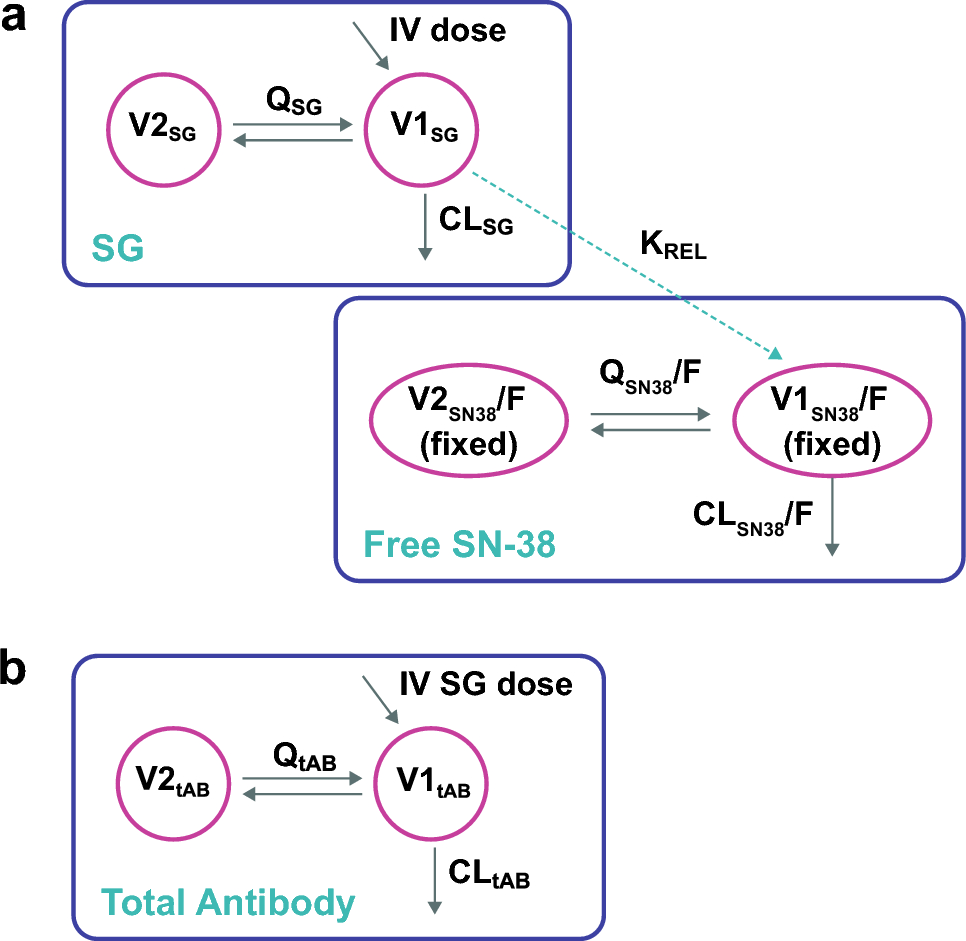
3.2 Final PopPK Model for SGThe pharmacokinetics of SG were best described by a two-compartment model with first-order linear elimination with estimated body weight-based allometric scaling exponents on clearance (CLSG), intercompartment clearance (QSG), central volume of distribution (V1SG), peripheral volume of distribution (V2SG) (Fig. 1a), and IIV on CLSG. Typical parameter estimates based on the final SG PopPK model and median and 95% CIs of pharmacokinetic parameters based on bootstrap analysis were in good agreement (Table 1). The typical parameter estimates for CLSG, V1SG, and V2SG were 0.133 L/h, 2.77 L, and 0.908 L, respectively; allometric exponents for effect of body weight on clearance and volume parameters were estimated to be 0.508 and 0.532, respectively. All parameters of the final SG model were estimated with good precision with percentage of relative standard error (%RSE) <20% and acceptable shrinkage for η on CLSG (26%).
Fig. 1
Final model schematic for SG, free SN-38, and tAB. CLSG clearance of SG, CLSN38/F apparent clearance of free SN-38, CLtAB clearance of tAB, IV intravenous, KREL first-order release rate constant for free SN-38, QSG intercompartmental clearance of SG, QSN38/F apparent intercompartmental clearance of free SN-38, QtAB intercompartmental clearance of tAB, SG sacituzumab govitecan, tAB total antibody, V1SG central volume of distribution of SG, V2SG peripheral volume of distribution of SG, V1SN38/F apparent central volume of distribution of free SN-38, V2SN38/F apparent peripheral volume of distribution of free SN-38, V1tAB central volume of distribution of tAB, V2tAB peripheral volume of distribution of tAB
Table 1 Parameter estimates and bootstrap analysis for the final model for SGThe effect of body weight-based scaling resulted in an approximately 5% increase in CLSG, QSG, V1SG, and V2SG with a 10% increase in body weight. Baseline albumin was a statistically significant covariate on CLSG with a 10% increase in baseline albumin corresponding to a 3% decrease in CLSG. The model included the effect of time after last dose on the residual unexplained variability (RUV). None of the other evaluated covariates (including markers of renal and hepatic function) had a statistically significant effect. Standard GOF plots for the final SG model (Fig. S1a, see ESM) showed weighted residuals evenly distributed around 0 with no trends over time or by concentration, indicating no meaningful bias in the model. The pcVPC plot (Fig. 2a) showed lack of model misspecification with good concordance between observed and simulated percentiles.
Fig. 2
Prediction-corrected visual predictive check showing observed and simulated data versus time after last dose for the final PopPK models of SG (a), free SN-38 (b), and tAB (c). CI confidence interval, PopPK population pharmacokinetics, SG sacituzumab govitecan, tAB total antibody
3.3 Final PopPK Model for Free SN-38The free SN-38 PopPK model was developed as a sequential model with free SN-38 being generated via a first-order release process from SG driven by individual model-predicted SG concentrations. The pharmacokinetics of free SN-38 were adequately described by a two-compartment model with estimated body weight-based allometric scaling exponent for apparent clearance (CLSN38/F) and intercompartmental clearance (QSN38/F), and apparent central and peripheral volumes of distribution (V1SN38/F and V2SN38/F, respectively) fixed to values reported in the literature (49 L and 2177 L, respectively) [19] to ensure identifiability of the model (Fig. 1a). IIV was included on first-order SG release rate (KREL) and CLSN38/F. A parameter estimating the covariance between individual KREL and CLSN38/F was included in the model. Typical parameter estimates based on the final free SN-38 model and median and 95% CI of pharmacokinetic parameters based on bootstrap analysis were in good agreement (Table 2). Parameters of the final free SN-38 model were estimated with good precision with %RSE <20%.
Table 2 Parameter estimates and bootstrap analysis for the final model for free SN-38The final model of free SN-38 included body weight-based allometric scaling exponents for CLSN38/F and QSN38/F, and effects of time after last dose and study on RUV. No statistically significant effect of other covariates on CLSN38/F was identified. As the M3 method was used for the final free SN-38 model, in addition to the standard GOF plots, diagnostic plots based on normalized prediction distribution error were also generated (Fig. S1b, see ESM). Normalized prediction distribution errors were evenly distributed around 0 and had no trends over time or by concentration, indicating no meaningful bias in the model. The pcVPC plot (Fig. 2b) showed that the final pharmacokinetic model for free SN-38 slightly underpredicted the 5th percentile of the observed free SN-38 concentrations during the distribution phase.
3.4 Final PopPK Model for tABThe pharmacokinetics of tAB were best described by a two-compartment model with first-order time-dependent elimination (Fig. 1b). The model included estimated body weight-based allometric scaling for CLtAB and QtAB and for V1tAB and V2tAB. IIV was estimated on CLtAB and V1tAB and a combined additive and proportional residual error model was utilized. Correlation of IIV on CLtAB and V1tAB as a covariance term was also included in the model. Typical parameter estimates based on the final tAB PopPK model were in good agreement with the median pharmacokinetic parameters based on bootstrap analysis (Table 3). Typical parameter estimates for CLtAB, V1tAB, and V2tAB were 0.016 L/h, 3.06 L, and 1.2 L, respectively. The model included a statistically significant effect of time on systemic CLtAB parametrized as a relative exponential onset model predicting a maximum reduction of the systemic CLtAB of 17% with a time to half-maximal reduction of approximately 48 days.
Table 3 Parameter estimates and bootstrap analysis for the final model for tABBased on the allometric scaling exponents for body weight, a 10% increase in body weight corresponded to a 3.6% increase in CLtAB and QtAB and 4.3% increase in V1tAB and V2tAB. Baseline serum albumin had a statistically significant impact on CLtAB with a 10% increase in baseline serum albumin leading to a 6.8% decrease in CLtAB. Other significant covariates included in the model were an effect for cancer type on CLtAB (13% lower CLtAB in patients with other tumor types including epithelial cancers, e.g., small-cell lung cancer, non-small-cell lung cancer, colorectal cancer, esophageal cancer, pancreatic ductal adenocarcinoma, etc. compared with those with mTNBC, mUC, and HR+/HER2– mBC), sex on V1tAB (12% higher V1tAB in males), and study on RUV (25% lower standard deviation of RUV in study 01 vs study 05). Standard GOF plots (Fig. S1c, see ESM) and pcVPC plots (Fig. 2c) showed no model misspecification and demonstrated that the final tAB PopPK model adequately characterized the observed concentrations.
3.5 Impact of Statistically Significant CovariatesSensitivity analyses were conducted to assess the impact of statistically significant covariates identified in the final models on predicted first-cycle exposure (Cmax, AUC) of SG, free SN-38, and tAB, and these results were visualized using tornado plots. For SG, both body weight and serum albumin had a limited impact on AUC and Cmax, with predicted relative exposures within the 80–125% range (Fig. 3a,b). Body weights of 49 kg (5th percentile) and 110 kg (95th percentile) are estimated to result in 16% lower and 25% higher AUC for SG, respectively, than the typical exposure for a body weight of 70 kg. Similarly for albumin, values of 29 g/L (5th percentile) and 45 g/L (95th percentile) are estimated to result in 9% lower and 6% higher AUC of SG, respectively, than the typical exposure for albumin of 38 g/L. For free SN-38, body weight was the only statistically significant covariate and had a limited impact on AUC and Cmax (Fig. S2a, b, see ESM). Body weights of 49 kg and 110 kg are estimated to result in 18% lower and 25% higher AUC for free SN-38, respectively, than the typical exposure for a body weight of 70 kg. For tAB, the combined effect of body weight on CL and the body weight-based SG dosing regimen resulted in slightly higher exposure in patients with higher body weight, with a body weight of 110 kg (95th percentile) associated with an approximately 30% higher AUC and Cmax than a typical patient with a body weight of 70 kg (Fig. S2c, d, see ESM). Other statistically significant covariates including baseline serum albumin, sex, tumor type, and time after first dose had a very limited impact on tAB AUC and Cmax, with predicted relative exposures within the 80–125% range.
Fig. 3
Impact of statistically significant covariates identified in the final model on predicted SG AUC (a) and Cmax (b). AUC and Cmax at the given covariate values were compared with those predicted for a typical patient with a body weight of 70 kg and baseline albumin of 38 g/L at the beginning of the study. Dots and error bars show the predicted relative exposure with 95% CI. ALB albumin, AUC area under the serum concentration-time curve, CI confidence interval, Cmax maximum (peak) serum drug concentration, SG sacituzumab govitecan
From the pharmacokinetic analysis dataset, no patients from IMMU-132-01 and four out 253 patients from ASCENT had treatment-emergent ADAs to SG. The reported ADA titer observed was low and varied from 10 to 30. Three patients with treatment-emergent ADAs were positive for neutralizing ADAs to SG.
3.6 Correlation of all Tested Covariates and ExposureAs an additional way to evaluate and visualize the covariate effects, the correlation between AUC or Cmax over the first treatment cycle and all covariates evaluated in the covariate assessment was visualized using forest plots for all three analytes with the respective final PopPK models. The covariates of mild or moderate renal impairment, mild hepatic impairment, age, sex, baseline albumin level, race, ECOG status, tumor type, UGT1A1 genotype, use of UGT1A1 inducers or inhibitors, or Trop-2 expression also did not have a clinically relevant correlation with SG AUC or Cmax (Fig. 4a, b). Analysis of the correlation between covariates and model-predicted free SN-38 and tAB exposure relative to a typical patient showed similar results (Figs. S3 and S4, see ESM).
Fig. 4
Relationships between continuous (a) and categorical (b) covariates to SG AUC or Cmax over the first treatment cycle relative to exposures in a typical patient with the reference covariate value. Gray band shows the 80–125% range. Dots and error bars show predicted exposure and 90% CI, respectively. Categories with less than five patients (three patients with ECOG score of 2, one patient with moderate hepatic impairment, three patients with severe renal impairment, and one patient with missing renal impairment level) were excluded from the plot. ALB albumin, ALP alkaline phosphatase, ALT alanine aminotransferase, AST aspartate aminotransferase, AUC area under the serum concentration-time curve, BILI total bilirubin, CI confidence interval, CLCr creatinine clearance, Cmax maximum (peak) serum drug concentration, CPI checkpoint inhibitor, ECOG Eastern Cooperative Oncology Group, HER2 human epidermal growth factor receptor 2, HR hormonal receptor, mBC metastatic breast cancer, mTNBC metastatic triple-negative breast cancer, SG sacituzumab govitecan, Trop-2 trophoblast cell-surface antigen-2, UC urothelial cancer, UGT1A1 uridine 5'-diphospho-glucuronosyltransferase 1A1, ULN upper limit of normal
留言 (0)