
記住我


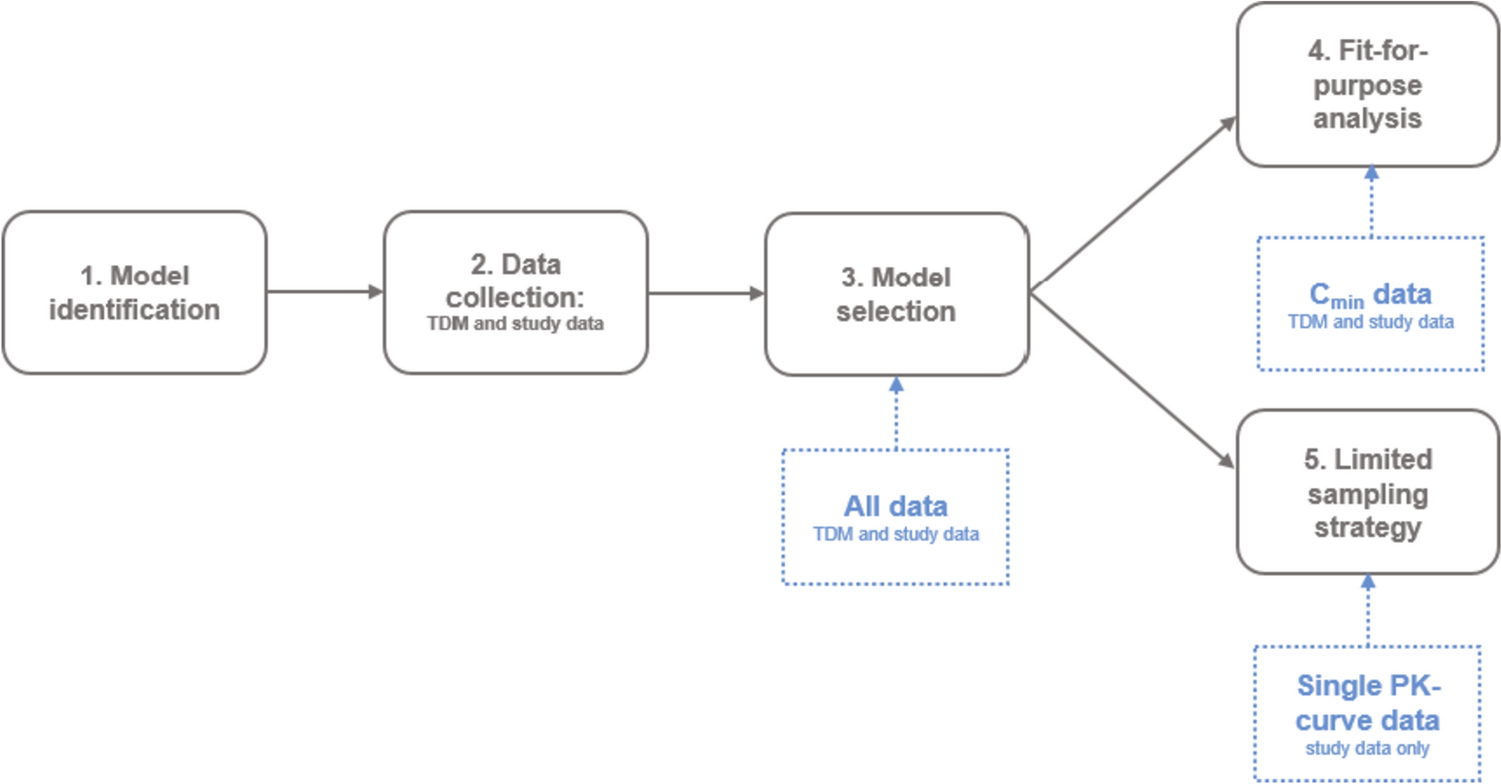
For this study, we used a systematic five-step approach, which is schematically depicted in Fig. 1.
Step 1: Identification of suitable population pharmacokinetic models for posaconazole, administered as solid oral tablet, available from the literature.
Step 2: Collection of data for the external evaluation cohort from routine clinical care (TDM data) and a previously performed prospective pharmacokinetic study (study data).
Step 3: Evaluation of the identified models and selection of the most suitable model using the data from the external evaluation cohort.
Step 4: Fit-for-purpose analysis using the final selected model.
Step 5: Limited sampling strategy evaluation using the final selected model.
Fig. 1
Schematic depiction of the study design. Blue rectangles indicate the data used for the indicated part of the study. Cmin trough concentration, PK pharmacokinetic, TDM therapeutic drug monitoring
2.1 Model IdentificationWe performed a structured literature search in PubMed to identify all available parametric population pharmacokinetic models of the solid oral tablet (and intravenous solution) of posaconazole in adult patients until April 2023. The following keywords were used as Medical Subject Heading (MeSH) terms and/or free text for the identification of potential models: ‘posaconazole’ and ‘pharmacokinetic*’. References in the identified articles were screened for any additional relevant publications. We then reviewed articles based on title and/or abstract and included models if they were developed using data from adult individuals receiving the solid oral tablet formulation of posaconazole. Models were excluded if they were non-parametric, based on intravenous data solely, or developed using data from pediatric patients only. Subsequently, we evaluated the remaining full-text articles on suitability before model implementation in the non-linear mixed-effects modeling package NONMEM, version 7.5 (Icon plc, Dublin, Ireland).
2.2 Data CollectionTo evaluate the identified models, we collected data for an external evaluation cohort. This external evaluation cohort comprised two sets of data.
For the first dataset, data were retrospectively collected from patients treated with posaconazole and undergoing TDM at the Radboud University Medical Center, Nijmegen, The Netherlands, between 1 December 2014 and 1 December 2021. This dataset is considered a comprehensive representation of a real-world clinical setting. Patients were eligible for inclusion if they were >18 years of age, received posaconazole as solid oral tablet or as intravenous formulation, and had at least one posaconazole plasma concentration measured as part of routine TDM. Both outpatient and clinical patients were included. Data were collected from patients’ medical records and included posaconazole dosing information (e.g., dose, frequency, route of administration), posaconazole TDM information (e.g., plasma concentration, timing of sample collection), patient characteristics (e.g., age, sex, weight, primary underlying disease), and covariate data as defined in the included models. The institutional Medical Ethics Committee waived the necessity to obtain informed consent from these patients.
The second dataset was retrieved from a previously performed prospective observational pharmacokinetic study in critically ill patients receiving posaconazole via intravenous administration. Details on this study, including ethical statement, have been published elsewhere [11, 12]. Contrary to the first dataset, the second dataset not only contained trough concentrations but also information from full pharmacokinetic curves.
All plasma concentrations in this study, both in the TDM and study datasets, were quantified in the same laboratory using a fully validated liquid chromatography-tandem mass spectroscopy (LC-MS/MS) assay. The lower and upper limits of quantification for posaconazole were 0.05 and 10 mg/L, respectively. Plasma concentrations below the limit of quantification were omitted for this analysis. All data in this study were pseudonymized.
For certain covariate data items, namely food status, hematocrit, and albumin and total protein concentrations, information was not widely available in our cohort. To evaluate models including the effect of food status [13,14,15], we assumed that all patients with a hematological malignancy in our cohort were treated under fasting conditions due to their disease state. For all other patients, we assumed posaconazole was administered with food. As albumin concentrations were only missing in non-critically ill patients, we assumed hypoalbuminemia was not present in these individuals. Hematocrit and total protein concentrations were not routinely measured in this cohort. Therefore, we extracted the mean and standard deviation from the values reported in the original publication for imputation in the model for those individuals where these data were missing [16]. We performed a sensitivity analysis by running models with values that were considered at the maximum of realistic to assess the impact of our assumptions on the prediction results. To account for between-occasion variability in pharmacokinetics, occasions in the dataset were defined as described for that specific model. If it was not clearly defined in the article, a new occasion was assumed at every plasma concentration on a different day.
2.3 Model SelectionThe identified models including significant covariates were implemented in NONMEM for external evaluation. We obtained model control streams either from the supplementary materials of the original publication or from the information available in the publication. Authors were contacted in the case of uncertainty in coding.
First, we performed the evaluations using the TDM and study dataset separately to assess whether the models would perform differently using these different sets of data. We then performed the model evaluations using the two external evaluation datasets combined. For this part of the analysis, all plasma concentrations were analyzed at the same time. Model evaluation was based on graphical goodness-of-fit and predictive performance [17, 18]. Based on these results, we selected one model to perform a fit-for-purpose analysis.
Graphical goodness-of-fit was assessed by visual inspection of prediction-corrected visual predictive checks (VPCs) [19], individual predicted concentration versus observed concentration plots, and normalized prediction distribution error (NPDE) plots. VPCs aided simulation-based evaluation of appropriateness of the model to describe the concentration-time curve in the external cohort. The NPDE plots visualized the distribution of errors compared with the standard normal distribution N(0,1) [20]. We assessed normality of the NPDE using distribution plots.
The predictive performance of the identified models was assessed by evaluating the models’ ability to predict the observed concentrations. We evaluated this by calculation of the mean percentage error (MPE) as a measure for bias. For this, Eq. 1 was used with N as the total number of observations, predi as the predicted concentration for an individual, and obsi as the observed concentration for an individual.
$$} \,\left(\%\right)= \frac\sum \left(\frac}}_-}}_}}}_}\right)\times 100\%.$$
(1)
The root mean squared error (RMSE) and the normalized relative root mean squared error (NRMSE) normalized to the mean of the observed values were calculated as measures for imprecision. For this, Eqs. 2 and 3 were used. We calculated confidence intervals (CIs) for MPE and NRMSE as proposed previously [18, 21].
$$\mathrm\,(}/}) =\sqrt\sum \left(}}_-}}_\right)}^,}$$
(2)
$$\mathrm\,\left(\mathrm\right)= \frac}} }}_\right)}\times 100\%.$$
(3)
Additionally, we calculated the fraction of percentage individual prediction errors (PEi) within ± 10% (P10), ± 20% (P20), and ± 30% (P30) to facilitate interpretation. Here, higher values for P10, P20, and P30 can thus be interpreted as favorable. The PEi was calculated using Eq. 4.
$$}}_\, \left(\%\right)= \frac}}_-}}_}}}_}\times 100\%.$$
(4)
2.4 Fit-for-Purpose AnalysisIn the a posteriori fit-for-purpose analysis, we assessed the model’s ability to predict a concentration based on the concentration(s) from one or more prior TDM instances using Bayesian forecasting. This analysis was performed with data from the individuals in the external evaluation dataset for whom at least two concentrations were available. For each occasion, we calculated the MPE and NRMSE using Eqs. 1–3. Thereby, this part of the analysis shows the trend in the model’s predictive performance with more prior concentration information becoming available as a posteriori input. Additionally, we evaluated whether predictions of concentrations cause (in)correct (no) dose increases. Four different outcomes were possible:
1.Dose correctly increased: observed and predicted concentrations were both below the target.
2.Dose correctly not increased: observed and predicted concentrations were both above the target.
3.Dose incorrectly increased: observed concentration was above the target, while the predicted concentration was below the target.
4.Dose incorrectly not increased: observed concentration was below the target, while the predicted concentration was above the target.
We used target concentrations of > 0.7 mg/L and > 1.0 mg/L for patients receiving posaconazole as prophylaxis and therapy, respectively [1]. In the absence of a clearly defined relationship between concentration and toxicity, no upper threshold value was used.
2.5 Limited Sampling Strategy EvaluationIn the limited sampling strategy evaluation, we assessed the models’ ability to predict the total drug exposure reflected by the area under the concentration-time curve (AUC) from a single (trough) concentration. This analysis was performed with data from individuals for whom a pharmacokinetic curve was available, i.e., individuals from the prospective study dataset. Here, we used a single pharmacokinetic curve per individual. This approach was chosen because all individuals in this study were critically ill, and it is expected that pharmacokinetics are variable within one individual over time. Using all concentrations from the pharmacokinetic curve, we assessed the AUC by means of post hoc estimation, and assumed this to be the true observed AUC. We then predicted the AUC using only one concentration and compared this with the true observed AUC by calculation of MPE and NRMSE as described earlier. Two approaches for assessing the predicted AUC from a single concentration were performed. First, we used the trough concentration, obtained predose, to calculate the predicted AUC. Hereby, we assessed whether a trough concentration correctly reflected the AUC and could be used as a surrogate for the total posaconazole exposure. Second, we used concentrations obtained at t = 2 (± 1), 4 (± 1), 6 (± 1), or 12 (± 2) h after dose to assess the model’s predictive performance using a single non-trough concentration. Hereby, we evaluated whether the model is suitable for use with non-specifically timed concentration measurements.
留言 (0)