
記住我

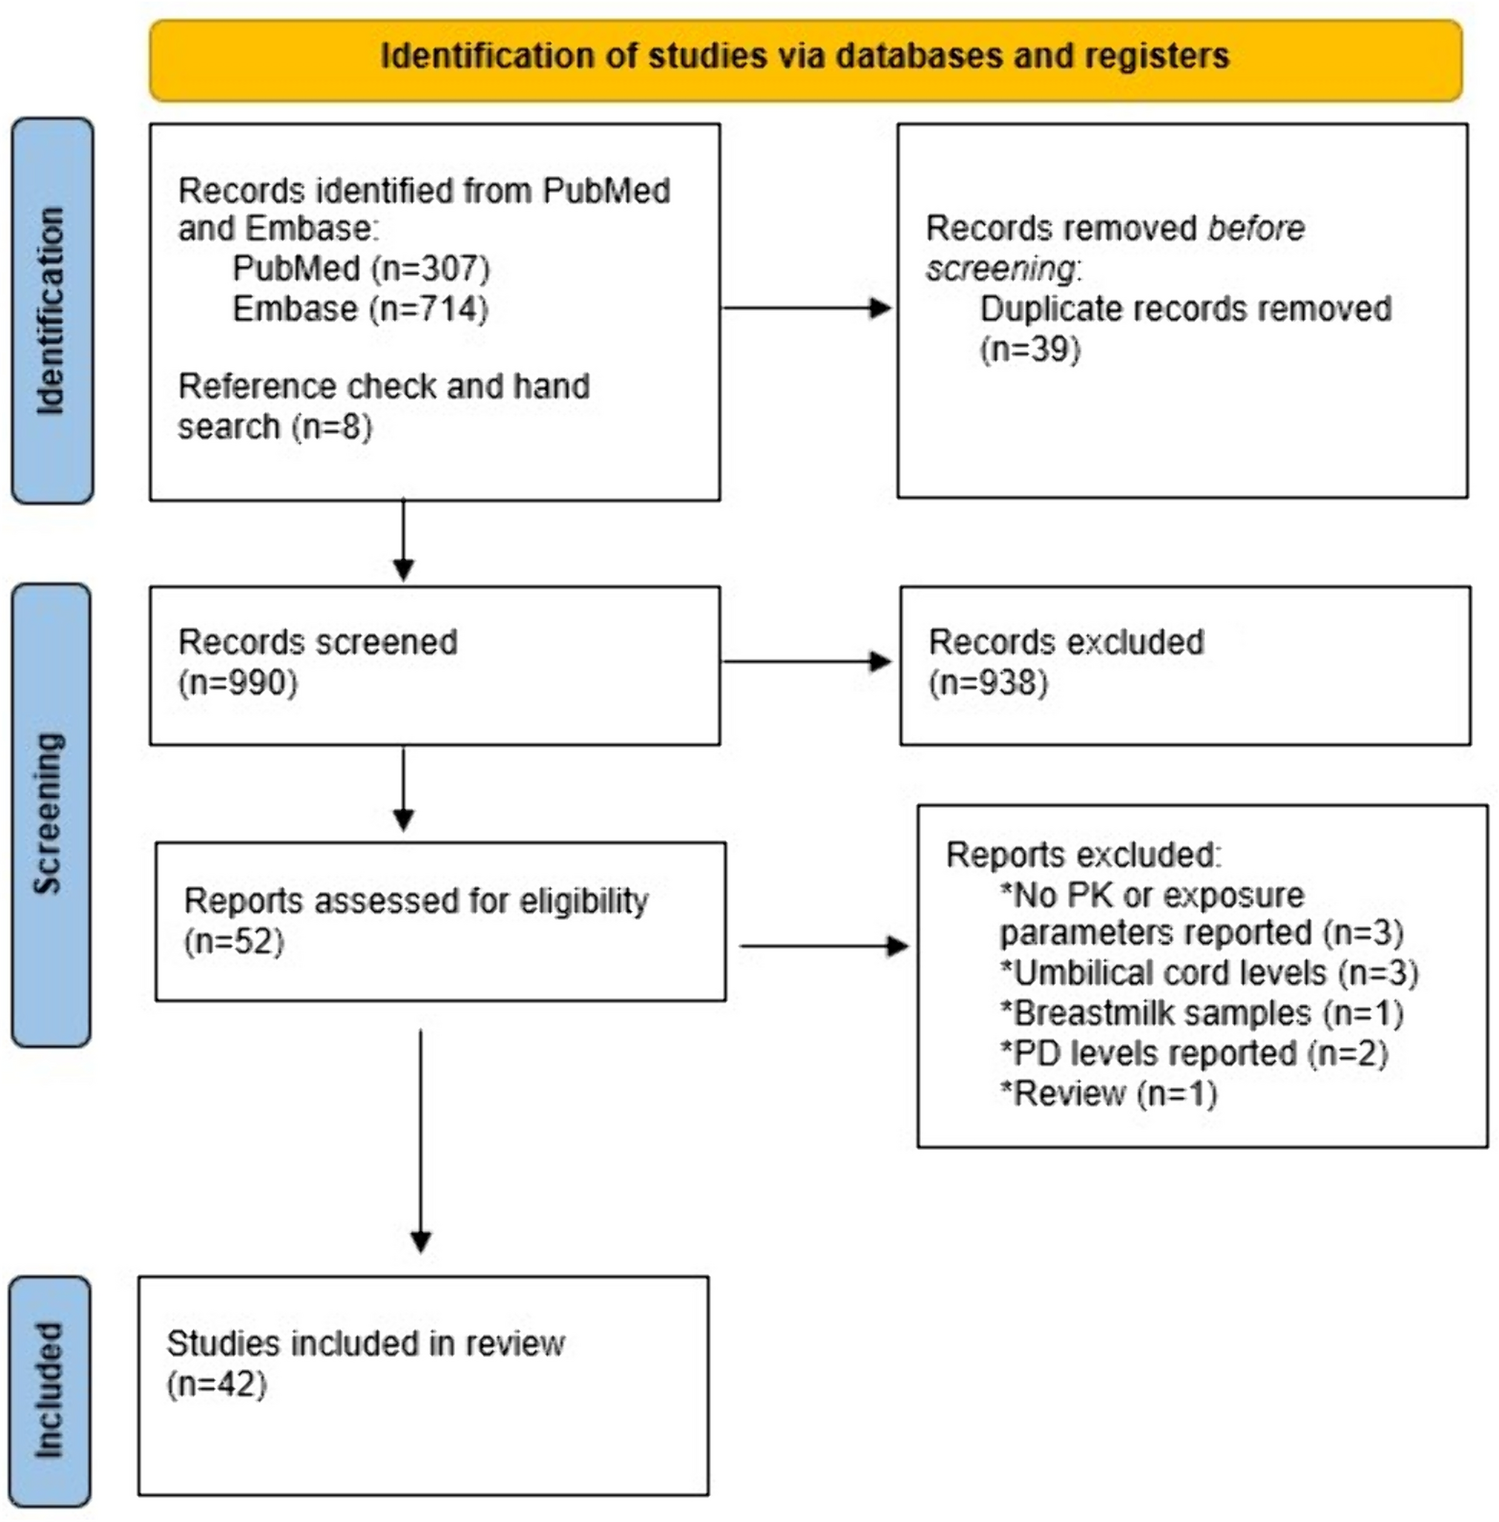


In total, 42 studies reporting on the PK of mAbs during pregnancy were included in this systematic review, of which nine studies reported data on two or three different mAbs. A total of eight studies for adalimumab (ADL), three for CZP, five for eculizumab (ECU), one for golimumab (GOL), 12 for IFX, two for natalizumab (NAT), one for canakinumab (CAN), one for omalizumab (OMA), five for tocilizumab (TCZ), eight for ustekinumab (UST), and five for vedolizumab (VDZ) were included. An overview of the patient populations and study characteristics is presented in Table 2, and an overview of results and dosing guidance is presented in Table 3.
3.2 Tumor Necrosis Factor (TNF)-α Inhibitors3.2.1 AdalimumabEight studies were included reporting serum concentrations of ADL in pregnant women [11, 29, 33,34,35,36,37,38]. Most PK information was available from two studies [29, 36] (Tables 2, 3, Fig. 2). Dosing was generally consistent between pre-pregnancy, pregnancy, and postpartum periods, and most participants received 40 mg subcutaneously every 2 weeks. Median steady-state concentrations measured during pregnancy were consistently lower when compared to those measured in the non-pregnant states (either pre-pregnancy or postpartum) [29, 36] (Fig. 2).
Fig. 2
The concentration of adalimumab (ADL) during different states of pregnancy. The concentration of ADL is expressed in µg/mL on the y-axis (median with corresponding IQR and range). The different states of pregnancy per study are shown on the x-axis. The different states of pregnancy are expressed as pre-pregnancy (T0), first trimester (T1), second trimester (T2), third trimester (T3), during delivery (T4), and postpartum (T5). FLAa stands for the study of Flanagan et al. (2020); SEO for Seow et al. (2017); LAB for Labetoulle et al. (2019); BOR for Bortlik et al. (2013); JULa for Julsgaard et al. (2013); JULb for Julsgaard et al. (2016); KANa for Kanis et al. (2018); and MAH for Mahadevan et al. (2013) [11, 29, 33,34,35,36,37,38]. IQR interquartile range
The first study found non-significant decreases of median ADL concentrations, as compared to the pre-pregnancy values, in all trimesters, at delivery, and postpartum of 45.2%, 50.0%, 44.2%, 35.6%, and 33.7%, respectively [36]. The second study also showed a non-significant decrease in median ADL concentrations in comparison with pre-pregnancy concentrations; first, second, third trimester, and postpartum concentrations showed decreases of 51.2%, 30.9%, 47.5%, and 58.0%, respectively [29]. Both studies used mixed effect modelling to conclude that, after accounting for covariates such as maternal body mass index (BMI), albumin, and C-reactive protein (CRP), ADL concentrations may remain consistent between trimesters one to three, but comparisons were not made to the non-pregnant states [29, 36]. Overall, median concentrations were not meaningfully different between the trimesters, and these authors agree with the assertion of consistency throughout pregnancy following a visual inspection of the individual plots and based on limited sample sizes to otherwise detect minor differences. The other six studies [11, 33,34,35, 37, 38] reported ADL concentrations at the first trimester, delivery, and/or non-pregnancy state (postpartum). When considering adapted dosing regimens based on the measured PK data, Flanagan et al. stated that routine therapeutic drug monitoring (TDM) or intrapartum dosing adjustment are not indicated [36]. Seow et al. advised that TDM in the second trimester may be useful in guiding dosing in the third trimester [29]. None of the other studies reported PK-based dosing guidance for ADL during pregnancy.
In summary, available evidence suggests that ADL serum concentrations may be unaffected or modestly decreased during pregnancy, and may remain relatively stable throughout the three trimesters.
3.2.2 Certolizumab PegolThree studies were included reporting serum concentrations of CZP in pregnant women [11, 39, 40] (Tables 2, 3, Fig. 3). Concentrations at delivery were within the range of concentrations observed from a previous population PK analysis [41] in non-pregnant individuals based on the reported number of days since the last dose, and were mostly within the proposed therapeutic range [41] when the sample was collected up to 28 days after the last dose [41]. Within-individual comparisons to the non-pregnant state were not possible except for one study in a single Japanese patient [40], where concentrations were similar (albeit slightly slower) in the third trimester compared to postpartum.
Fig. 3
The concentration of certolizumab pegol (CZP) during different states of pregnancy. The concentration of CZP is expressed in µg/mL on the y-axis (median with corresponding IQR and range). The different states of pregnancy per study are shown on the x-axis. The different states of pregnancy are expressed as third trimester (T3), during delivery (T4), and postpartum (T5). MOR stands for the study of Morita et al. (2018); MAH for Mahadevan et al. (2013); and MAR for Mariette et al. (2018) [11, 40, 76]. IQR interquartile range
In summary, there is not sufficient evidence to indicate that CZP serum concentrations may be meaningfully impacted by pregnancy.
3.2.3 GolimumabOne case report of Benoit et al. [42] reported that GOL was detectable in maternal plasma in one patient immediately after delivery (Tables 2, 3). The time since last dose was not reported to enable further interpretation.
3.2.4 InfliximabIn total, twelve studies were included in this systematic literature review reporting PK or exposure parameters of IFX in pregnant women [12, 14, 29, 33, 35, 36, 38, 43,44,45,46,47] (Tables 2, 3, Fig. 4). While IFX is typically dosed on an mg/kg basis, most studies specified a practice where the dose during pregnancy was not increased from the pre-pregnancy dose despite an increase in body weight.
Fig. 4
The concentration of infliximab (IFX) during different states of pregnancy. The concentration of IFX is expressed in µg/mL on the y-axis (median with corresponding IQR and range). The different states of pregnancy per study are shown on the x-axis. The different states of pregnancy are expressed as pre-pregnancy (T0), first trimester (T1), second trimester (T2), third trimester (T3), during delivery (T4), and postpartum (T5). The different colors indicate the stages of pregnancy. FLAa stands for the study of Flanagan et al. (2020); SEO for Seow et al. (2017); STE for Steenholdt et al. (2011); BOR for Bortlik et al. (2013); ELI for Eliesen et al. (2020); JULb for Julsgaard et al. (2016); KANa for Kanis et al. (2018); MAH for Mahadevan et al. (2013); VES for Vestergaard et al. (2017); KANb for Kane et al. (2009); and VAS for Vasilauskas et al. (2006) [11, 12, 14, 29, 33, 35, 36, 38, 43, 45, 47]. IQR interquartile range
In all studies reporting IFX serum concentrations in all six periods (pre-pregnancy, first, second, third trimester, at delivery and postpartum) [29, 36, 44], IFX serum concentrations generally increased during pregnancy compared to pre-pregnancy serum concentrations (Fig. 4). One of the studies [44] showed increases of 16.4% in the first trimester, 105.5% in the second trimester, and 78.1% in the third trimester. In another study [36], the serum concentrations increased by 11.4%, 26.6%, and 39.2% in the first, second, and third trimesters. The third study [29] showed the highest rise in concentration, with increases of 23.0%, 49.2%, and 204.2% in the first, second, and third trimesters. In two studies, only postpartum concentrations were described and could not be compared to concentrations in other periods [14, 43]. In three studies, IFX concentrations at postpartum were compared to pre-conceptional concentration, showing a decrease of 19.2% [44] or increases of 30.4% and 50.1% [29, 36]. Other studies are case reports [14, 45, 47].
Only one study reported exposure parameters; Grišić et al. [44] used a population PK model to determine clearance (CL) (0.608 L/d) and volume of distribution (Vd ) (18.2 L) of IFX, and reported an effect of −0.121 of second and third trimester state on CL [44]. However, the population PK model was constructed on only trough concentrations and only tested covariates (including possible effects of pregnancy) on CL; possible effects of pregnancy on Vd were not evaluated.
In light of a small significant increase in IFX serum concentrations during the second and third trimesters [36, 44], some commentaries on the use of TDM or the need for dosing adjustments have emerged. One study stated that antenatal dosing adjustments are not needed [36]. Another study adds that TDM can assist in regulating constant maternal IFX concentrations during pregnancy, in the hopes of minimizing IFX exposure for the fetus [44]. Other studies suggest discontinuation of treatments around the third trimester to minimize placental transfer [11, 33]. One study advised that IFX serum concentrations could be targeted to the lower end of the therapeutic range (e.g., 3 µg/mL) during the pre-pregnancy phase and postpartum phase, and measuring serum concentrations in the second trimester may help to decide whether to give a dose in the third trimester [29].
Overall, available evidence shows that IFX serum concentrations generally increase throughout pregnancy. Considerations for the use of TDM to maintain constant exposures throughout pregnancy are emerging.
3.3 Complement Inhibitor3.3.1 EculizumabFive studies were included reporting serum concentrations of ECU in pregnant women [48,49,
留言 (0)