
記住我


In the total cohort of 933 T2D subjects drawn from the four distinct prospective cohorts, 104 individuals experienced at least one CVE during the follow-up period. Given the matching by age, sex and BMI, these variables did not differ between CVE groups i.e. with and without CVEs. Additionally, there were no differences in smoking habits between the groups (Table 1).
Table 1 Clinical variables and incidence of cardiovascular events in the prospective T2D cohort (LIPOCAT)The proportion of T2D subjects receiving antihypertensive medication was significantly higher in those with a CVE than those without. Correspondingly, significant elevations in SBP were observed in the CVE group compared with the non-CVE subjects. The HbA1c levels were significantly higher in the CVE group, indicating suboptimal glycemic control. However, conventional total lipids did not differ between both groups, although total cholesterol was marginally elevated in the CVE group. No changes were observed in the serum concentrations of HDL- and LDL-cholesterol.
During the follow-up period among the CVE group, peripheral arterial disease was the most common event (29.8%), followed by heart failure (22.7%), stroke (21.2%), acute myocardial infarction, (18.3%), angina pectoris (17.3%), ischemic heart disease (16.3%) and coronary revascularization (15.4%). Cardiovascular mortality was 10.6% (Table 1).
Advanced lipoprotein and glycoprotein variablesThe advanced analysis of serum lipoproteins using the NMR approach revealed a significant increase in total triglycerides in the CVE group. This increase was mainly due to significant increases of IDL- and LDL-triglycerides and VLDL-triglycerides (p-value = 0.054). Despite total cholesterol not differing between groups, NMR analysis uncovered significant elevations in the VLDL-cholesterol and marginally in the IDL-cholesterol (p-value = 0.058) in the CVE group. Interestingly, the serum concentration of LDL-cholesterol did not differ between groups (Table 2).
Table 2 Advanced lipoprotein variables of the LIPOCAT studyThe triglyceride-to-cholesterol ratio calculated for each lipoprotein fraction revealed a significant increase only in the LDL, partly attributed to the relatively higher triglyceride content in the serum from subjects in the CVE group.
Regarding the particle size, our data showed that the circulating concentrations of larger HDL were significantly elevated in the CVE group (p-value = 0.007). Consistently, the small HDL-P-to-medium HDL-P ratio was concurrently decreased in the CVE group (p-value = 0.039). Medium VLDL was significantly increased in the CVE group. No significant differences were observed in other cardiovascular surrogates calculated from quantitative characteristics of lipoproteins, but the HDL-C-to-total triglycerides showed a trend (p-value = 0.063) towards being decreased in the CVE group compared with the non-CVE group.
Serum glycoproteins, especially Glyc A, are composite biomarkers of inflammation that can also be detected by [1H]-NMR. Median values of Glyc A and Glyc B were higher in T2D subjects with CVE compared with those without (Table 3).
Table 3 Advanced glycoprotein variables of the LIPOCAT studyContribution of advanced lipoprotein and glycoproteins characteristics to CVE predictionWe developed three models with the overall aim of examining whether the addition of advanced variables (i.e., Liposcale® and Glycoscale) that were differentially changed in the CVE group (i.e., IDL-TG, LDL-TG and diameter, and glycated proteins) (Model 3) could improve CVE prediction over traditional CVRFs such as BMI, age, sex, hypertension, dyslipidemia, smoking habit (Model 1), and traditional CVRFs together with the conventional lipid profile (Model 2) (Fig. 1; Table 4 ). We used random forests to construct the prediction models of CVE.
Fig 1.
Random forest analysis for CVE prediction. Model 1: a Random Forest model of cardiovascular risk factors (including sex, age, BMI, hypertension, dyslipidemia, smoking habit) and b Model 2: Random Forest of Model 1 + conventional lipid profile (i.e., total triglycerides, total cholesterol, HDL-C and LDL-C, remnant cholesterol calculated by EAS formula = Triglycerides (TG) * (VLDL-C/VLDL-TG). c Model 3: Random forest of Model 1 + Liposcale® + Glycoproteins variables and remnant cholesterol calculated by the Liposcale® formula = VLDL-C + IDL-C. Yellow dots = traditional cardiovascular risk factors. Orange dots = conventional lipid profile. Blue dots = Liposcale® + Glycoproteins variables
Model 1: Designed with traditional CVRFs, random forest analysis identified BMI, age and hypertension as the most important variables for making accurate predictions (scores higher than 75%) (Fig. 1a).
Model 2: We incorporated the conventional lipid profile (i.e., total cholesterol, TG, LDL-C, and HDL-C) and estimated cholesterol remnants (EAS formula) to analyze their added effect on CVE risk. Random forest analysis again identified BMI as the most important variable. This analysis also revealed that age, total cholesterol, LDL-C, HDL-C, remnant cholesterol, and total triglycerides scored within the top quartile (> 75%) on the variable importance scale for accurate CVE prediction (Fig. 1b).
Model 3: We incorporated the advanced characteristics of lipoproteins (Liposcale®) and glycoproteins (Glycoscale) into Model 1. In this model cholesterol remnants were calculated using the Liposcale® formula. BMI, age, Glyc A, Glyc B, and all lipids scored over 75% on the variable importance scale for accurate CVE prediction (Fig. 1c).
The AUROC score calculated in Model 3 was 1.5-fold higher (AUROC: 0.756) compared with Model 1 (0.501) (Δ value = 0.255). Likewise, the balanced accuracy value estimated using Model 1, which was strictly built using only traditional risk factors, was 0.492, much lower than Model 3, which had the addition of Liposcale® and Glycoscale variables (0.709). Supplementary Table 1 details false-positive and false-negative rates for each model. (Table 4).
Table 4 Performance Metrics of Predictive Models for Cardiovascular Events in the LIPOCAT studyInternal validation cohort analysisThe addition of Liposcale® and Glycoscale variables to the traditional base model increased the prediction accuracy for CVE, as revealed by the use of confusion matrices. Internal analysis by comparing all models revealed that predictability improved from 25% (Model 1) to 85% (Model 3). Moreover, the rate of false negatives was significantly reduced when adding the advanced variables to the traditional ones (Model 3, 15%) compared to using only the traditional CVRFs (Model 1, 75%). However, the relative rate of false positives increased when using the Model 3 (45%) compared to Model 1 (27%).
The comparison of ROC curves (Fig. 2a)and AUC values (Fig. 2c) supported the added value of using advanced variables to predict CVE in the LIPOCAT cohort. Interestingly, the AUC values calculated in Model 3 were significantly increased compared with those calculated using Model 1 (p-value = 0.004) and Model 2 (p-value = 0.002).
Fig 2.
Predictability accuracy and ROC curves in the LIPOCAT cohort. a. ROC curves. b. Confusion matrices. c. AUC curves. Model 1: Traditional CV risk factors (CVRF); Model 2: Traditional CVRF + conventional lipid variables, including remnant cholesterol EAS formula = triglycerides (TG) * (VLDL-C/VLDL-TG). Model 3: Traditional CVRF + Liposcale®, + Glycoscale variables, including remnant cholesterol Liposcale® formula = VLDL-C + IDL-C
To assess potential differences in predictive performance across cardiovascular event (CVE) types, we applied Model 3 (traditional CV risk factors, Liposcale®, and Glycoscale markers) to individual CVE subgroups. As shown in Table 5, the model demonstrated moderate to good discrimination across most event types, with (AUROC values ranging from 0.571 to 0.866).
Table 5 Predictive performance of Model 3 across different cardiovascular event subgroups in the LIPOCAT cohortTo further evaluate the predictive performance of our models, we conducted additional analyses incorporating family history of cardiovascular disease, glycoproteins (Glyc A and Glyc B), HbA1c levels, and SCORE2 alongside traditional cardiovascular risk factors (CVRF). The inclusion of family history of cardiovascular disease slightly reduced the false negative rate; however, it did not significantly improve the overall model performance, as reflected by unchanged AUC values (0.756, Supplementary Table 2 and Supplementary Fig. 1). Upon adding glycoproteins to the traditional CVRF model (Model 4, Supplementary Fig. 2), the AUC increased to 0.629, indicating improved predictive performance compared to the base model using CVRF alone (Model 1). However, this improvement was not statistically significant in comparison to the model that incorporated both Liposcale® and Glycoscale variables (Model 3). Incorporation of HbA1c into the traditional CVRF and Liposcale® parameters (Model 4, Supplementary Fig. 3) resulted in an increased AUC (0.682) compared to the base model using CVRF alone (Model 1). However, this improvement was less pronounced than that observed in Model 3, which included both Liposcale® and Glycoscale variables. Consequently, the addition of HbA1c did not surpass the predictive performance of the model incorporating glycoproteins, and the overall conclusions of the study remain unchanged. Integrating the SCORE2 risk score into the traditional CVRF model (Model 4, Supplementary Fig. 4) led to an AUC increase to 0.678, reflecting improved predictive performance over CVRF alone. The subsequent addition of the HbA1c variable in Model 5 resulted in a slight enhancement in discrimination, though this did not substantially alter the AUROC values compared to Model 4. Importantly, both models demonstrated inferior predictive accuracy relative to Model 3, which consistently yielded the highest performance. Overall, Model 3, which integrates traditional CVRF with Liposcale® and Glycoscale variables, consistently demonstrated the best performance for CVE prediction across all analyses.
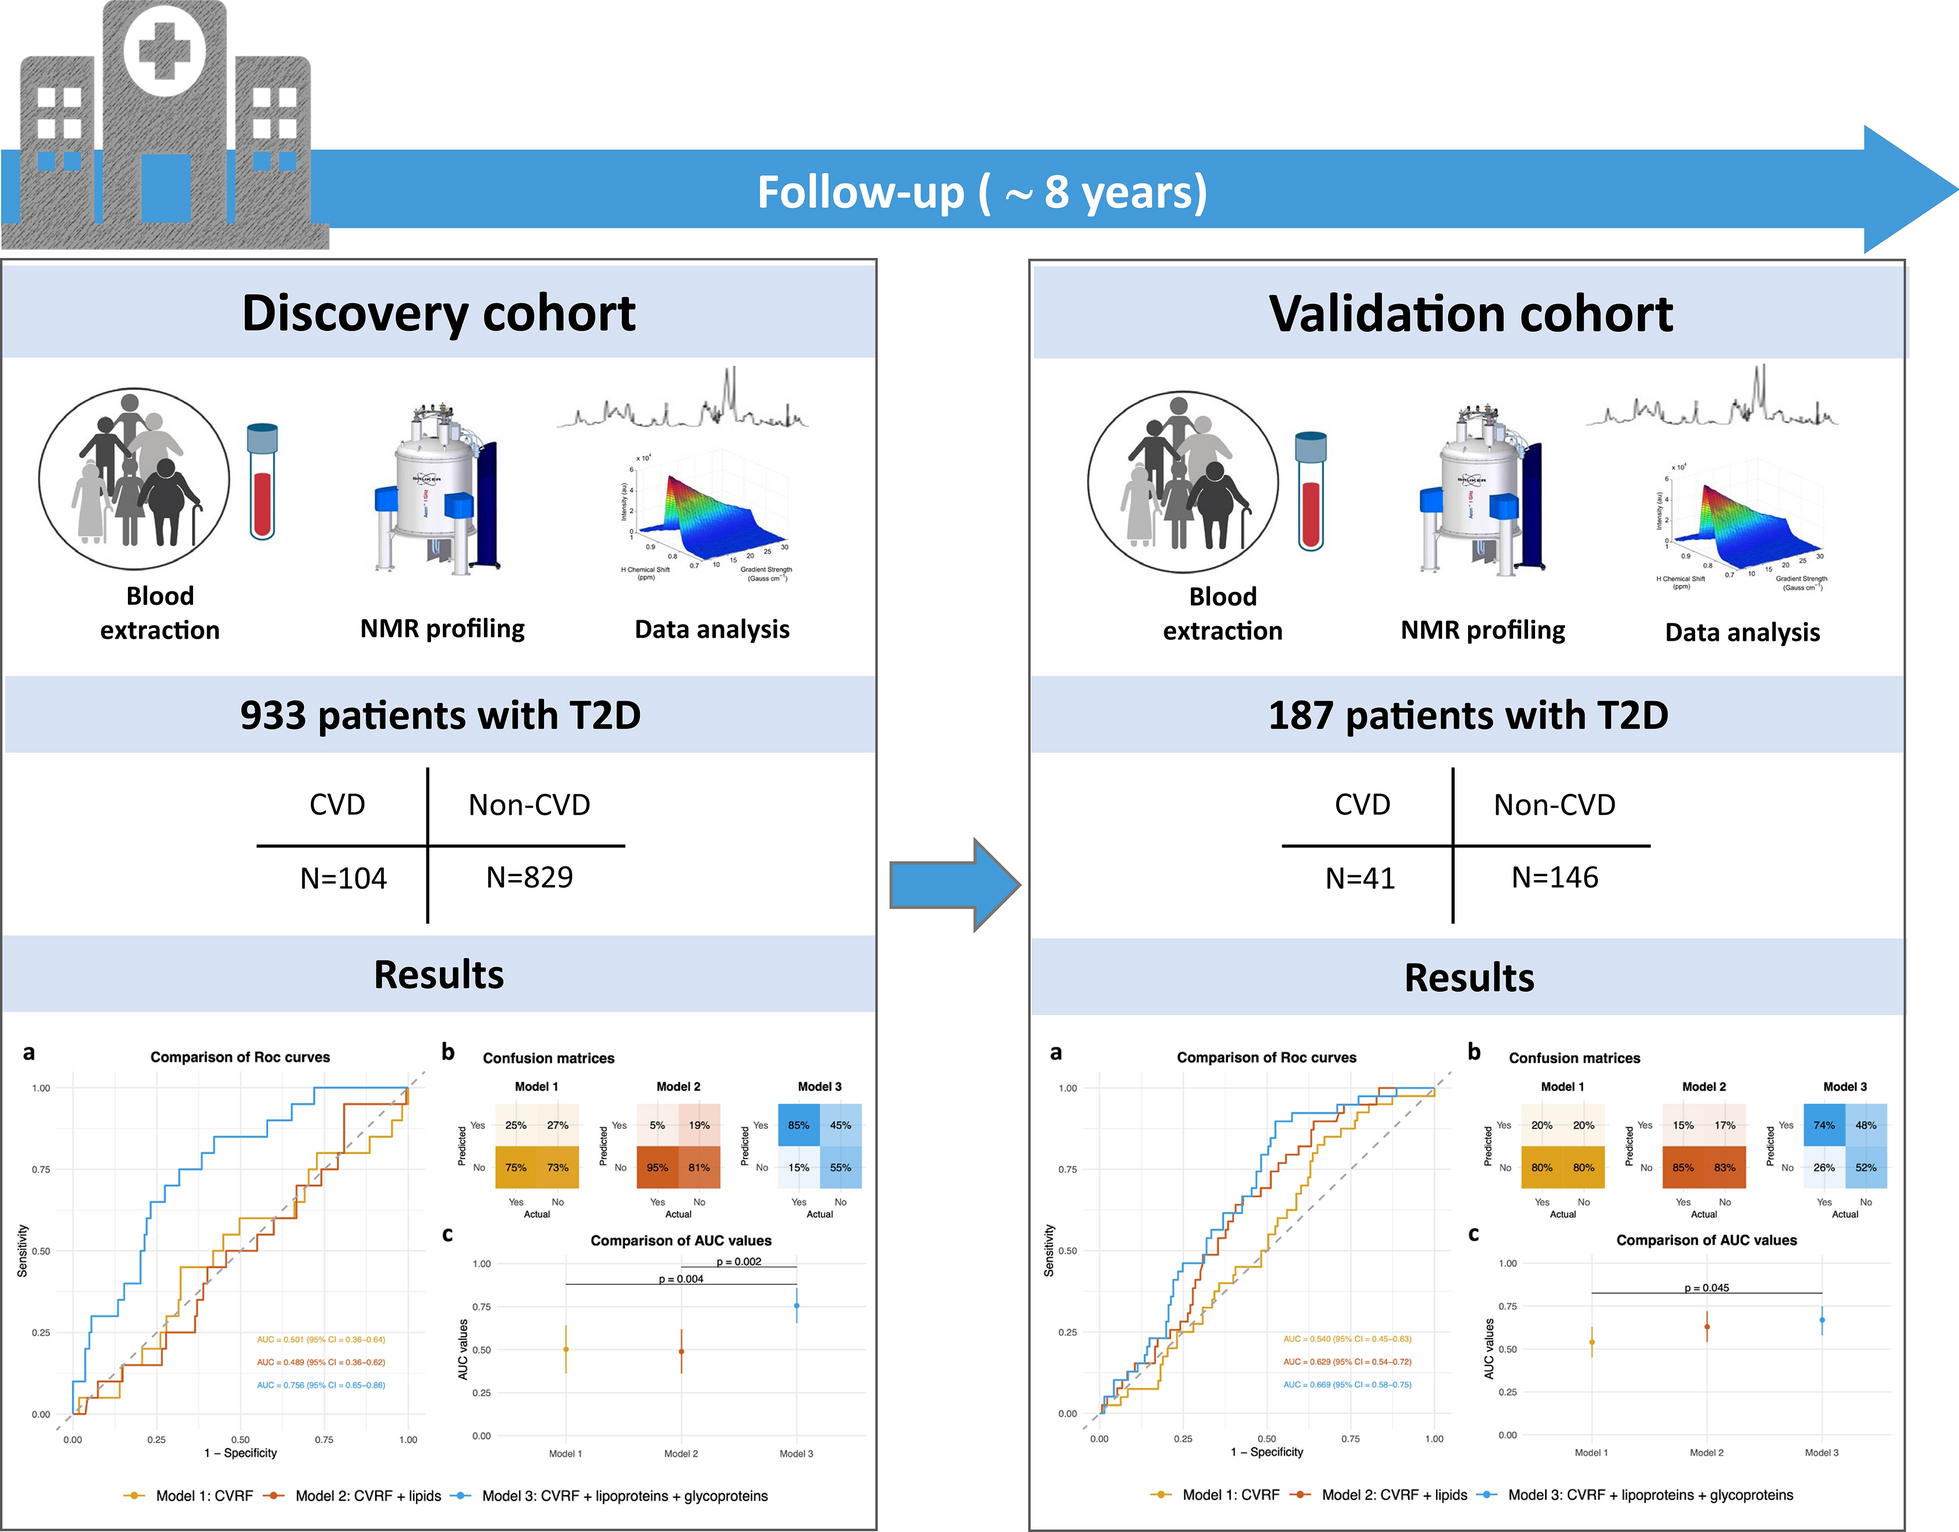
External validation cohort analysisTo validate the results from the LIPOCAT cohort, we tested the models and conducted an analysis using confusion matrices and calculated the AUROC values with an independent cohort comprising 187 subjects, of which 41 had a CVE. The clinical variables are detailed in Supplementary Table 3, while the Liposcale® and Glycoscale variables are provided in Supplementary Table 4. This validation process allowed us to assess the performance and generalizability of the models using a separate dataset.
Consistent with the LIPOCAT cohort, this validation cohort showed that the AUROC score values calculated when adding the Liposcale® and Glycoscale variables to traditional CVRFs were 1.2-fold higher (AUROC: 0.669) compared with the traditional base model (0.540) (Δ value = 0.129) (Fig. 3).
Fig. 3
Predictability accuracy and ROC curves in the validation cohort. a. ROC curves. b. confusion matrices. c. AUC curves. Model 1: Traditional CV risk factors; Model 2: Traditional CV risk factors + conventional lipid variables, including remnant cholesterol EAS formula = triglycerides (TG) * (VLDL-C/VLDL-TG). Model 3: Traditional CV risk factor + Liposcale®, + Glycoscale variables, including remnant cholesterol Liposcale® formula = VLDL-C + IDL-C
Our analysis also revealed that the balanced accuracy value estimated using the traditional base model, which was strictly built only using traditional CVRFs, was 0.499, much lower than that obtained by adding the Liposcale® and Glycoscale variables (0.631) (Table 6).
Table 6 Performance Metrics of Predictive Models for Cardiovascular Events in the validation cohortThe addition of Liposcale® and Glycoscale variables to the traditional base Model 1 also increased the prediction accuracy for CVE in the external validation cohort (Fig. 3a), similar to the internal validation analysis results (Fig. 2a). The estimated accuracy was greater when using Model 3 (74%) compared with Model 1 (20%). The false negatives were also reduced when adding the advanced to the traditional CVRFs (Model 3, 26%) compared with the matrix built solely on traditional factors (Model 1, 80%). However, the relative rate of false positives remained much higher for Model 3 (48%) compared with Model 1 (20%).
The comparison of ROC curves (Fig. 3b) and AUC values (Fig. 3c) supports the added value of using advanced variables to predict CVE in this validation cohort, fully consistent with the data obtained using the LIPOCAT cohort.
留言 (0)