Study design and population
This study was based on data from the KORA F4 study (2006–2008) and the KORA FF4 study (2013–2014), both follow-up examinations of the population-based KORA S4 study (1999–2001) conducted in Augsburg and two adjacent counties in Germany [10].
From the 3,080 participants of the KORA F4 study, we excluded participants who withdrew consent (n = 5), were not in the age range of 61–82 years (n = 1915), had clinically diagnosed or OGTT-diagnosed diabetes at F4 (n = 254) or had missing information on the diabetes status (n = 25) and/or had missing information on the prediabetes phenotyping variables (n = 14). After these exclusions, 867 participants remained for assignment to prediabetes clusters. Of note, the restriction to the age range between 61 and 82 years was necessary because data for 2-h insulin (OGTT), which is essential for the clustering, are only available in this subgroup. We additionally excluded participants with missing information on biomarkers of inflammation (n = 24) leaving 843 participants for complete-case analysis investigating the inflammatory load. All 843 participants had fasted for at least 8 h before blood sampling. Supplementary Fig. 1, Additional file 1 describes these exclusions in detail. For the prospective analyses on incident T2D, CKD and DSPN (mean follow-up time 6.5 ± 0.2 years), we further excluded participants who did not participate in FF4. CVD incidence and all-cause mortality were assessed until the end of 2016 (mean follow-up time 7.8 ± 1.9 years and 8.3 ± 1.7 years for incident CVD and all-cause mortality, respectively). Participants lost-to-follow-up were censored at the time of last information.
Assessment of variables for the cluster assignment
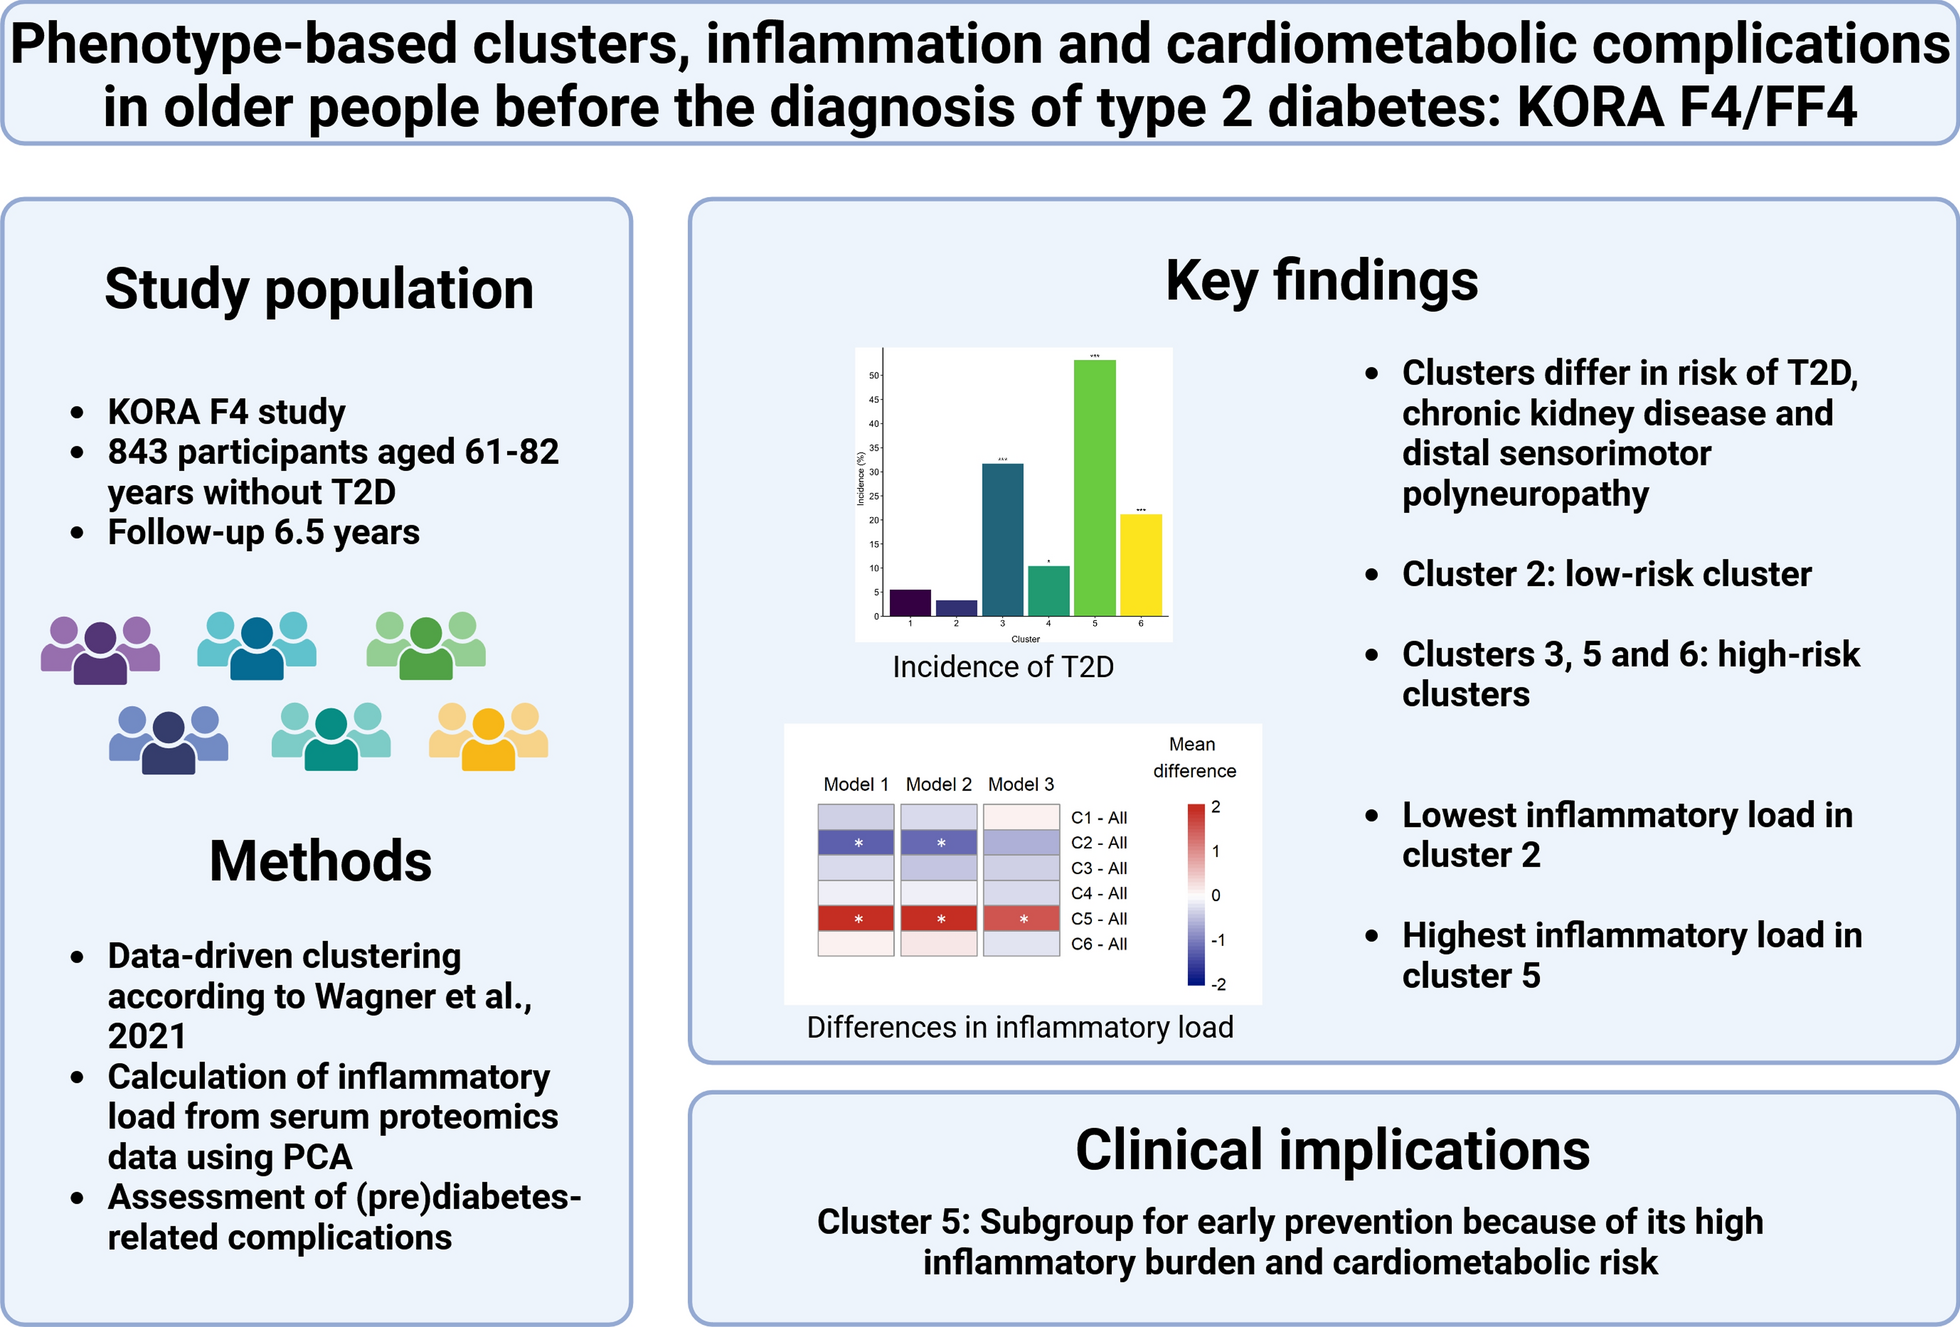
Cluster assignment was performed as described for the Whitehall II cohort [9; see also https://cluster.apps.dzd-ev.org/] based on the following variables in KORA F4: age, BMI, waist circumference, hip circumference, fasting glucose, 2-h glucose (OGTT), fasting insulin, 2-h insulin (OGTT), fasting triglycerides, fasting HDL-cholesterol, insulin secretion (Stumvoll) and insulin sensitivity (Matsuda). This led to the following six clusters: cluster 1, Low risk; cluster 2, Very low risk; cluster 3, Beta-cell failure; cluster 4, Low risk obese; cluster 5, High risk insulin-resistant fatty liver; cluster 6, High risk visceral fat nephropathy.
Anthropometric and metabolic variables were measured as described [11, 12]. Data from the OGTT were used to assess glucose tolerance categories (normal glucose tolerance [NGT], impaired fasting glucose [IFG], impaired glucose tolerance [IGT]) based on the 1999 World Health Organization diagnostic criteria [11]. Insulin secretion was assessed using Stumvoll’s first-phase insulin secretion index based on fasting and 2-h glucose and insulin levels [13]. Insulin sensitivity was quantified using the whole-body insulin sensitivity index (ISI(composite)) as described by Matsuda and DeFronzo [14].
Assessment of T2D, (pre)diabetes-related complications and mortality
Prevalent T2D at KORA F4 was defined based on a validated physician diagnosis or as newly diagnosed diabetes by OGTT (≥ 7.0 mmol/l fasting or ≥ 11.1 mmol/l 2-h glucose) in KORA F4. Incident T2D was defined based on a validated physician diagnosis between KORA F4 and FF4 or as newly diagnosed diabetes by OGTT (≥ 7.0 mmol/l fasting or ≥ 11.1 mmol/l 2-h glucose) in KORA FF4 [11].
Kidney function was assessed using the estimated glomerular filtration rate (eGFR, ml/min/1.73m2) which was calculated according to the Chronic Kidney Disease Epidemiology (CKD-EPI 2012) equation based on both serum creatinine and cystatin-C. An eGFR < 60 ml/min/1.73m2 was used to define prevalent and incident CKD at KORA F4 or FF4.
DSPN was assessed using the physical examination component of the Michigan Neuropathy Screening Instrument (MNSI) as described [15]. Prevalent and incident DSPN were defined using a cut-off at > 3 points based on the examinations at F4 and FF4.
Prevalent CVD included myocardial infarction (MI) and stroke at F4 based on self-reported information and data from the Augsburg MI registry if applicable. Incident CVD includes a combined endpoint of incident non-fatal and fatal MI including all coronary heart deaths as well as incident non-fatal and fatal stroke (ischaemic and haemorrhagic strokes without transient ischaemic attacks).
Vital status was determined using population registries, and death certificates were requested from the local health authorities to ascertain causes of death. In addition to the follow-up examination FF4 we used data from follow-up questionnaires sent to all reachable participants in 2008–2009 and in 2016 to obtain information on the occurrence of incident non-fatal MI and stroke. All incident events were validated by hospital discharge records, information from the treating physician or data from the Augsburg MI registry if coronary events occurred in the age range (≤ 74 years until 2009 and ≤ 84 years thereafter) and the area covered by the MI registry.
Biomarkers of subclinical inflammation
Biomarkers of subclinical inflammation were measured in fasting serum using proximity extension assay technology (Target 96 Inflammation panel, OLINK Proteomics, Uppsala, Sweden) in KORA F4 participants aged 61–82 years as described [16]. This proximity extension assay allows the measurement of 92 protein biomarkers including pro- and anti-inflammatory cytokines, chemokines, growth factors and factors involved in acute inflammatory and immune responses, angiogenesis, fibrosis and endothelial activation. These biomarkers are designated “biomarkers of inflammation” although some of them may also be considered metabolic biomarkers or biomarkers also reflecting other pathways. Biomarker levels are given as normalised protein expression (NPX) values, which are comparable in their distribution to log2-transformed protein concentrations. Out of the 92 measured proteins, 21 biomarkers were excluded due to quality control issues (≥ 25% of values below the limit of detection and/or inter-assay coefficient of variation > 20%) [16]. Remaining values below the limit of detection were retained in the data and not substituted. We examined each individual biomarker for outliers and set one implausibly low value of one participant for transforming growth factor beta-1 proprotein (TGFb1) to the next lowest available value of the protein.
In addition, we included hsCRP and tumour necrosis factor alpha (TNFα), which were measured separately. hsCRP was measured in EDTA plasma using high-sensitivity latex-enhanced nephelometric assay on a BN II analyzer (Dade Behring) and TNFα was measured in serum by ELISA [17]. hsCRP and TNFα levels were log2 transformed as their values were not normally distributed. Therefore, the final data set consisted of 73 biomarkers of subclinical inflammation, which were all transformed using z-standardisation.
Additional participant characteristics
Systolic and diastolic blood pressure were measured according to standardised protocols. Hypertension was defined as blood pressure of 140/90 mmHg or higher or by the use of antihypertensive medication given that participants were aware of being hypertensive [18]. Information on medication was collected by trained medical interviewers. Being physically active was defined as exercising in summer and winter for more than 1 h/week [19].
Statistical analysis
Cluster assignment was based on the aforementioned variables and performed using the same method as in the Whitehall II cohort [9]. Summary statistics are reported as means ± SD for continuous variables and percentages for categorical variables. Differences between the clusters were calculated using one-way ANOVA for continuous variables and chi-square test or Fisher’s exact test (used for cell sizes < 5) for categorical variables. Chi-square test or Fisher’s exact test were also used to assess differences in prevalent and/or incident outcomes (T2D, CKD, DSPN) among the clusters as appropriate, and for pairwise comparisons between clusters. Comparisons between clusters were performed with cluster 2 as the reference since this cluster had the lowest inflammatory load (see below for the calculation) compared to the other clusters.
We performed principal component analysis (PCA) with all 73 biomarkers of inflammation using the R package “FactoMineR” [20] to derive a score of “inflammatory load” for each participant. The “inflammatory load” was derived by combining levels of multiple biomarkers and indicates a state of subclinical inflammation (higher scores indicate a higher inflammation). After conducting the PCA, we assessed the stability of the first five principal components by bootstrapping of the PCA. Hereby, the Pearson correlation coefficient was calculated between the variable scores before bootstrapping (original sample) and each of the 1000 bootstrap samples individually. Boxplots were used to visualise the median correlation coefficient of all 1000 coefficients and their distribution. We then calculated the inflammatory load, i.e. the principal component score, of each participant from principal component 1. This approach was based on the analysis strategy of Morrisette-Thomas et al. [21]. Afterwards, we compared the inflammatory load and the individual levels of the multiple biomarkers of subclinical inflammation between the clusters using boxplots and pairwise comparisons between all clusters (15 comparisons) and between each cluster against all other clusters combined (6 comparisons). For the comparisons of the inflammatory load between the clusters, the following three models were used: Model 1, unadjusted; model 2, adjusted for age and sex; model 3, adjusted for age, sex, and BMI. Pairwise comparisons were performed using the R package “multcomp” [22]. In addition, Spearman’s rank correlation was applied to calculate the correlation between the inflammatory load and the clustering variables.
The associations of the six clusters with prevalent CKD, DSPN and CVD as well as with incident T2D, CKD and DSPN were assessed with logistic regression to obtain odds ratios (OR) and 95% confidence intervals (CI). The associations of clusters with incident CVD and all-cause mortality were assessed with Cox regression to obtain hazard ratios (HR) and 95% CI as the times of events were known during the follow-up period. Additionally, for incident CVD and all-cause mortality, which are time-to-event outcomes, we plotted the Kaplan–Meier survival curves stratified by cluster and used the log-rank test to assess differences between survival time. For both the logistic regression and Cox regression analyses four models were built. Model 1 was unadjusted, model 2 was adjusted for age and sex, model 3 was adjusted for age, sex and BMI and model 4 was adjusted for age, sex and inflammatory load.
Statistical analyses were performed using R version 4.3.1 and SAS statistical software (version 9.4; SAS Institute Inc., Cary, NC, USA). A p value of < 0.05 was used to indicate statistical significance. Benjamini–Hochberg adjusted p values were additionally calculated to account for multiple testing.


留言 (0)