
記住我


Data originate from the Swedish CArdioPulmonary bioImage Study (SCAPIS). The SCAPIS project, a nationwide collaboration including six Swedish universities and their affiliated university hospitals, aims to predict and prevent CVD and chronic obstructive pulmonary disease. The data collection phase in SCAPIS was carried out during 2013–18 and enrolled a total of 30,154 individuals aged 50–65. The cohort was randomly selected from the general population. The general design of SCAPIS and the baseline examinations have been previously described in detail [15, 16]. The SCAPIS study was approved by the regional ethics committee at Umeå University (Dnr 2010-228-31 M with amendment, the Swedish Ethical Review Authority, Umeå) and adheres to the declaration of Helsinki 1964 and its later revisions.
The local add-on microcirculatory examination and measurement of pulse wave velocity (PWV) were carried out at Linköping University Hospital, Linköping, Sweden, between January 2016 and June 2018. In total, microcirculation was measured in 3,809 study participants and 3,300 participants had valid microcirculatory measurements [9].
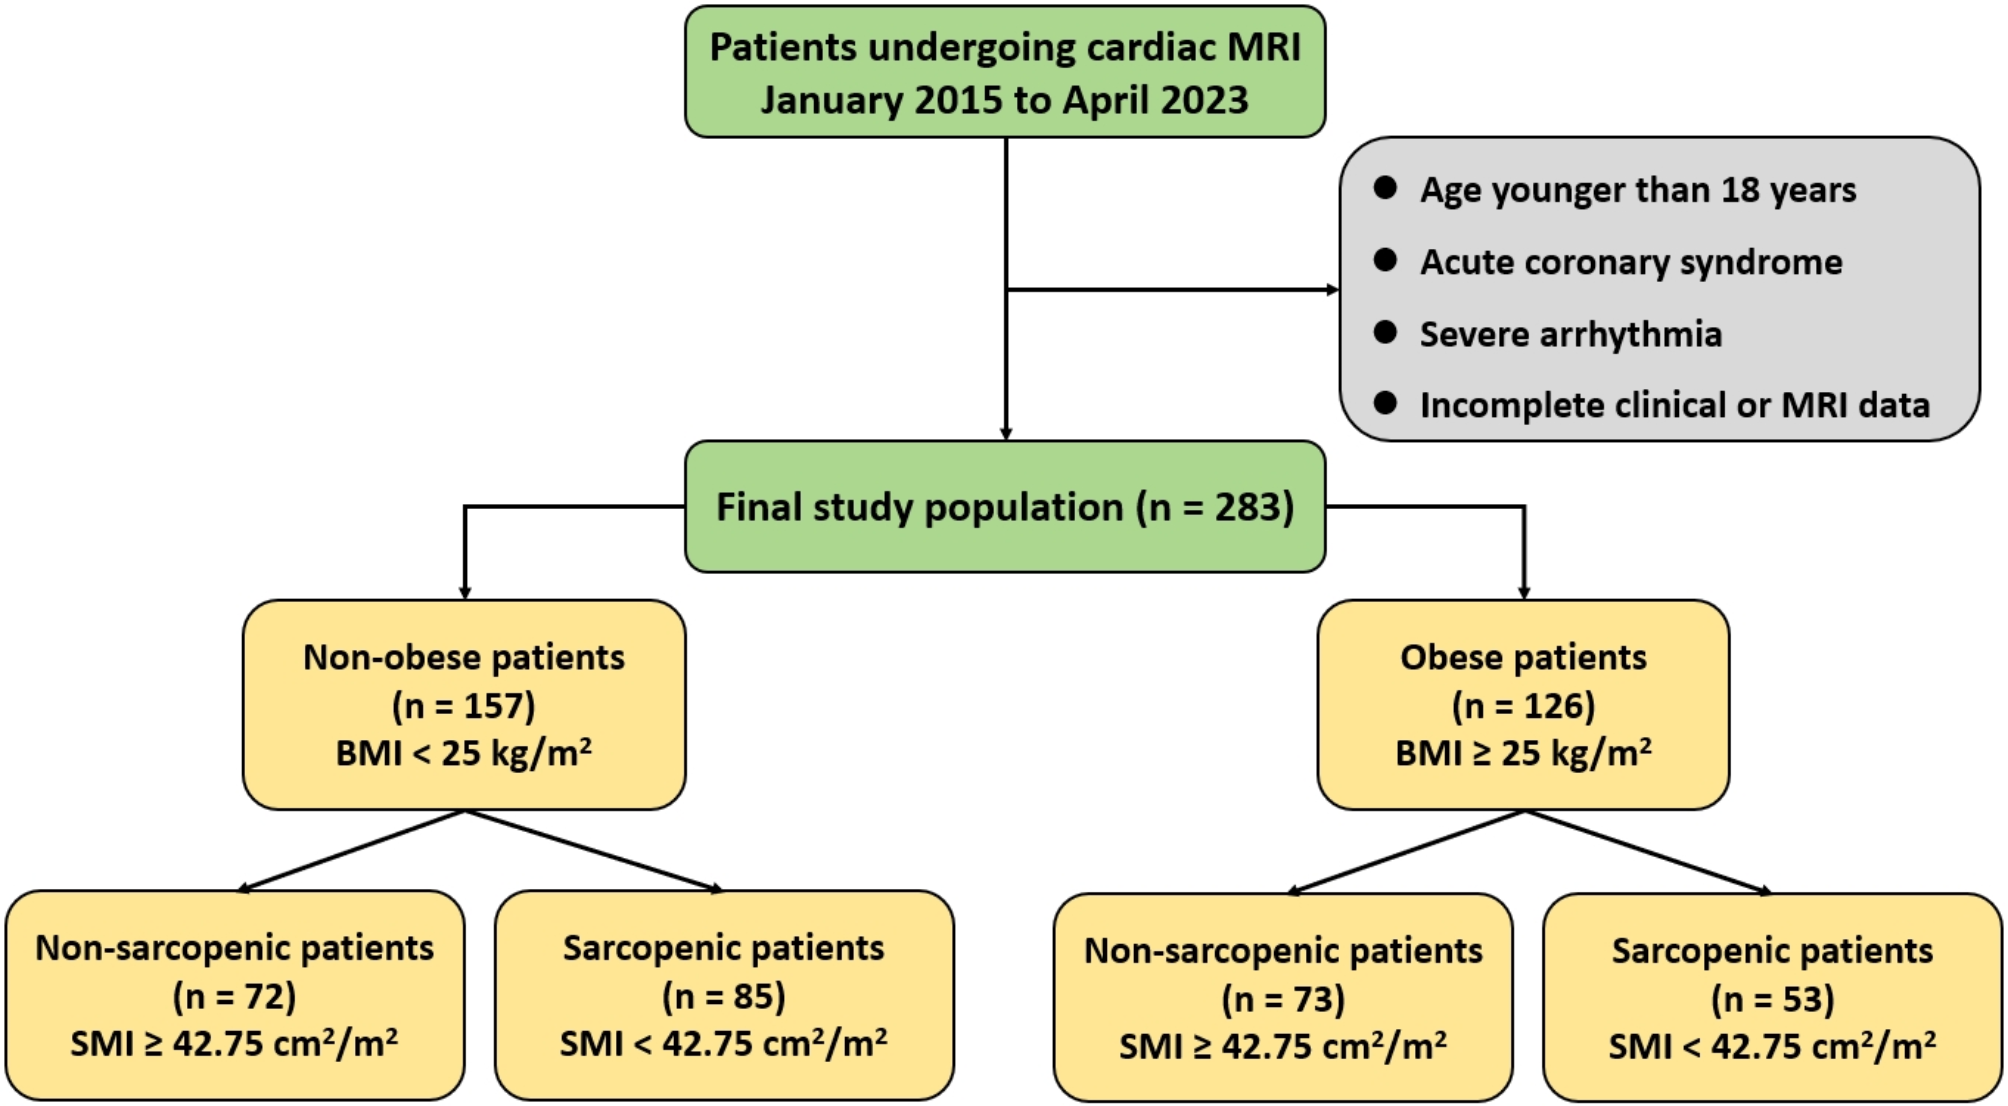
The study population selection process is illustrated in Fig. 1. The analyses of data from the local add-on studies were approved by the regional ethics committee in Linköping (Dnr 2018/156 − 31). Written informed consent was obtained from all participants.
Fig. 1
Flowchart of the study population selection process in SCAPIS Linköping
Glycaemic statusThe study population was categorised according to glycaemic status as normoglycaemic: glucose < 6.1 mmol/L and HbA1c < 42 mmol/mol (< 6.0%), prediabetes: impaired fasting glucose: 6.1–6.9 mmol/L and/or elevated HbA1c 42–47 mmol/mol (6.0-6.4%), and diabetes mellitus: fasting glucose ≥ 7.0 mmol/L and/or HbA1c ≥ 48 mmol/mol (≥ 6.5%) or previously known diabetes [17]. Prediabetes can be defined by either IGT, IFG or an elevated HbA1c level. In this study, we used both IFG and an elevated HbA1c value to define prediabetes [17].
Microcirculatory evaluationThe PeriFlux 6000 EPOS system (Perimed AB, Järfälla-Stockholm, Sweden) integrates diffuse reflectance spectroscopy (DRS) and laser doppler flowmetry (LDF) with an algorithm quantifying data about the microcirculation– e.g. oxygen saturation (%), tissue fraction of red blood cells (%) and speed resolved perfusion (%RBC × mm/s) [4, 18]. The microcirculatory evaluation protocol has been described in detail previously [9].
Briefly, microvascular function was assessed in forearm skin using an arterial occlusion and release protocol determining peak blood oxygen saturation (OxyP). After a 5-min arterial occlusion the local skin blood blood oxygen saturation is near zero. The release of the occlusion creates a microcirculatory response, referred to as post-occlusive reactive hyperaemia. This response is considered an overall measure of microcirculatory function [19], which depends on many mediators such as endothelium-derived hyperpolarizing factors and sensory nerves [20], and possibly on the ability of the endothelium to induce NO-dependent vasodilation [21]. Microcirculatory OxyP is presented at post-occlusive reactive hyperaemia and was calculated as the maximum value obtained after the release of the cuff. A probe was placed to the forearm skin and microvascular parameters were measured during 5-minute baseline, 5-minute brachial arterial occlusion at 250 mmHg, and 10-minute reperfusion, to assess vascular reactivity. To standardize the microcirculatory measurements, all subjects were asked to refrain from use of nicotine, alcohol, coffee, any medication (exceptions were made for medications for: diabetes, spasticity, epilepsy, Parkinson´s disease, chronic pain and for anticoagulants and contraceptives). Prior to the examination, participants were instructed to abstain from caffeine and a heavy meal for 3 h, nicotine for 4 h and alcohol for 12 h.
Pulse wave velocitySphygmocor Xcel (Atcor Medical, Australia) was used to measure pulse wave velocity. Blood pressure cuffs were placed on the left upper arm and right thigh (10–20 cm below the groin). The distance between the femoral pulse and the upper edge of the thigh cuff was subtracted from the distance between the carotid receptor and the upper edge of the thigh cuff and multiplied by 0.8. The PWV ≥ 10 m/s was used as the cut-off value for arterial stiffness.
Coronary artery calcificationCoronary artery calcification as a marker of coronary atherosclerosis [22] was assessed in non-contrast enhanced images from a state-of-the-art multi-slice computed tomography scanner (Siemens, Somatom Definition Flash, Siemens Healthineers, Erlangen, Germany). Imaging and analyses were performed using a calcium scoring protocol and the calcium content in each coronary artery was measured and summed in the Syngo Calcium scoring software (Siemens Healthineers) to produce a total coronary artery calcification score (CACS) according to Agatston which is an international standard [23, 24]. An Agatston score ≥ 100 was defined as having coronary artery calcification.
Statistical methodsOxyP was stratified by quartiles (Q1–Q4), with individuals with impaired microvascular function defined by the lowest quartile (OxyP Q1). In correlation analyses between OxyP vs. PWV and OxyP vs. CACS, Pearson’s and Spearman’s correlations were used. Variables with normal distribution (examined by Q-Q-plots) are presented with a mean value and standard deviation (SD). For comparing mean values between groups, we used ANOVA test for normally distributed- and a Kruskal-Wallis test for skewed variables.
It is not clear whether impaired microcirculation is caused by impaired glycaemic control or whether impaired microcirculation precedes increased blood glucose levels. Therefore, different analyses were used. Linear regression was used to examine the association between level of OxyP and glycaemic status, with OxyP being the outcome variable. Continuous variables were centered so that the intercept term in the regression equation became the expected value of the response variable when all predictors were set to their means. Centering makes the intercept more interpretable and aligns it with realistic situations, as compared to a model with non-centered variables where all continuous variables are expected to assume 0, which in this model is not biologically possible. Dummy variables were created for “smoke status” (Current and ex-smokers, never smokers for reference) and glycaemic classification (prediabetes and diabetes, normoglycaemia for reference). The intercept value, or outcome variable (beta-value), in the adjusted model is the mean value of OxyP when all categorical variables are = 0 (that is equal to their reference group) and all continuous variables are at a predicted mean value. Model 1 is adjusted for age and sex and in model 2, further possible confounders PWV, smoking status, BMI and systolic blood pressure were included in the analyses. Beta coefficients with 95% confidence intervals are given. The variance inflation factor was calculated for each independent variable in model 2 to detect signs of multicollinearity.
To evaluate whether OxyP differed between glycemic status groups, logistic regression analyses with glycaemic status as the outcome variable were performed. Binary comparisons between the three glycaemic groups and OxyP were carried out: Normoglycaemia compared to diabetes, normoglycaemia compared to prediabetes and prediabetes compared to diabetes. Results are presented as odds ratios (OR) and 95% CI. The full model was adjusted for age, sex, PWV, CACS, systolic blood pressure, smoking status, and BMI. In the analyses, OxyP, PWV and CACS values were dichotomised by OxyP Q1, increased pulse wave velocity ≥ 10 m/s and significantly increased CACS ≥ 100 in relation to glycaemic status.
留言 (0)