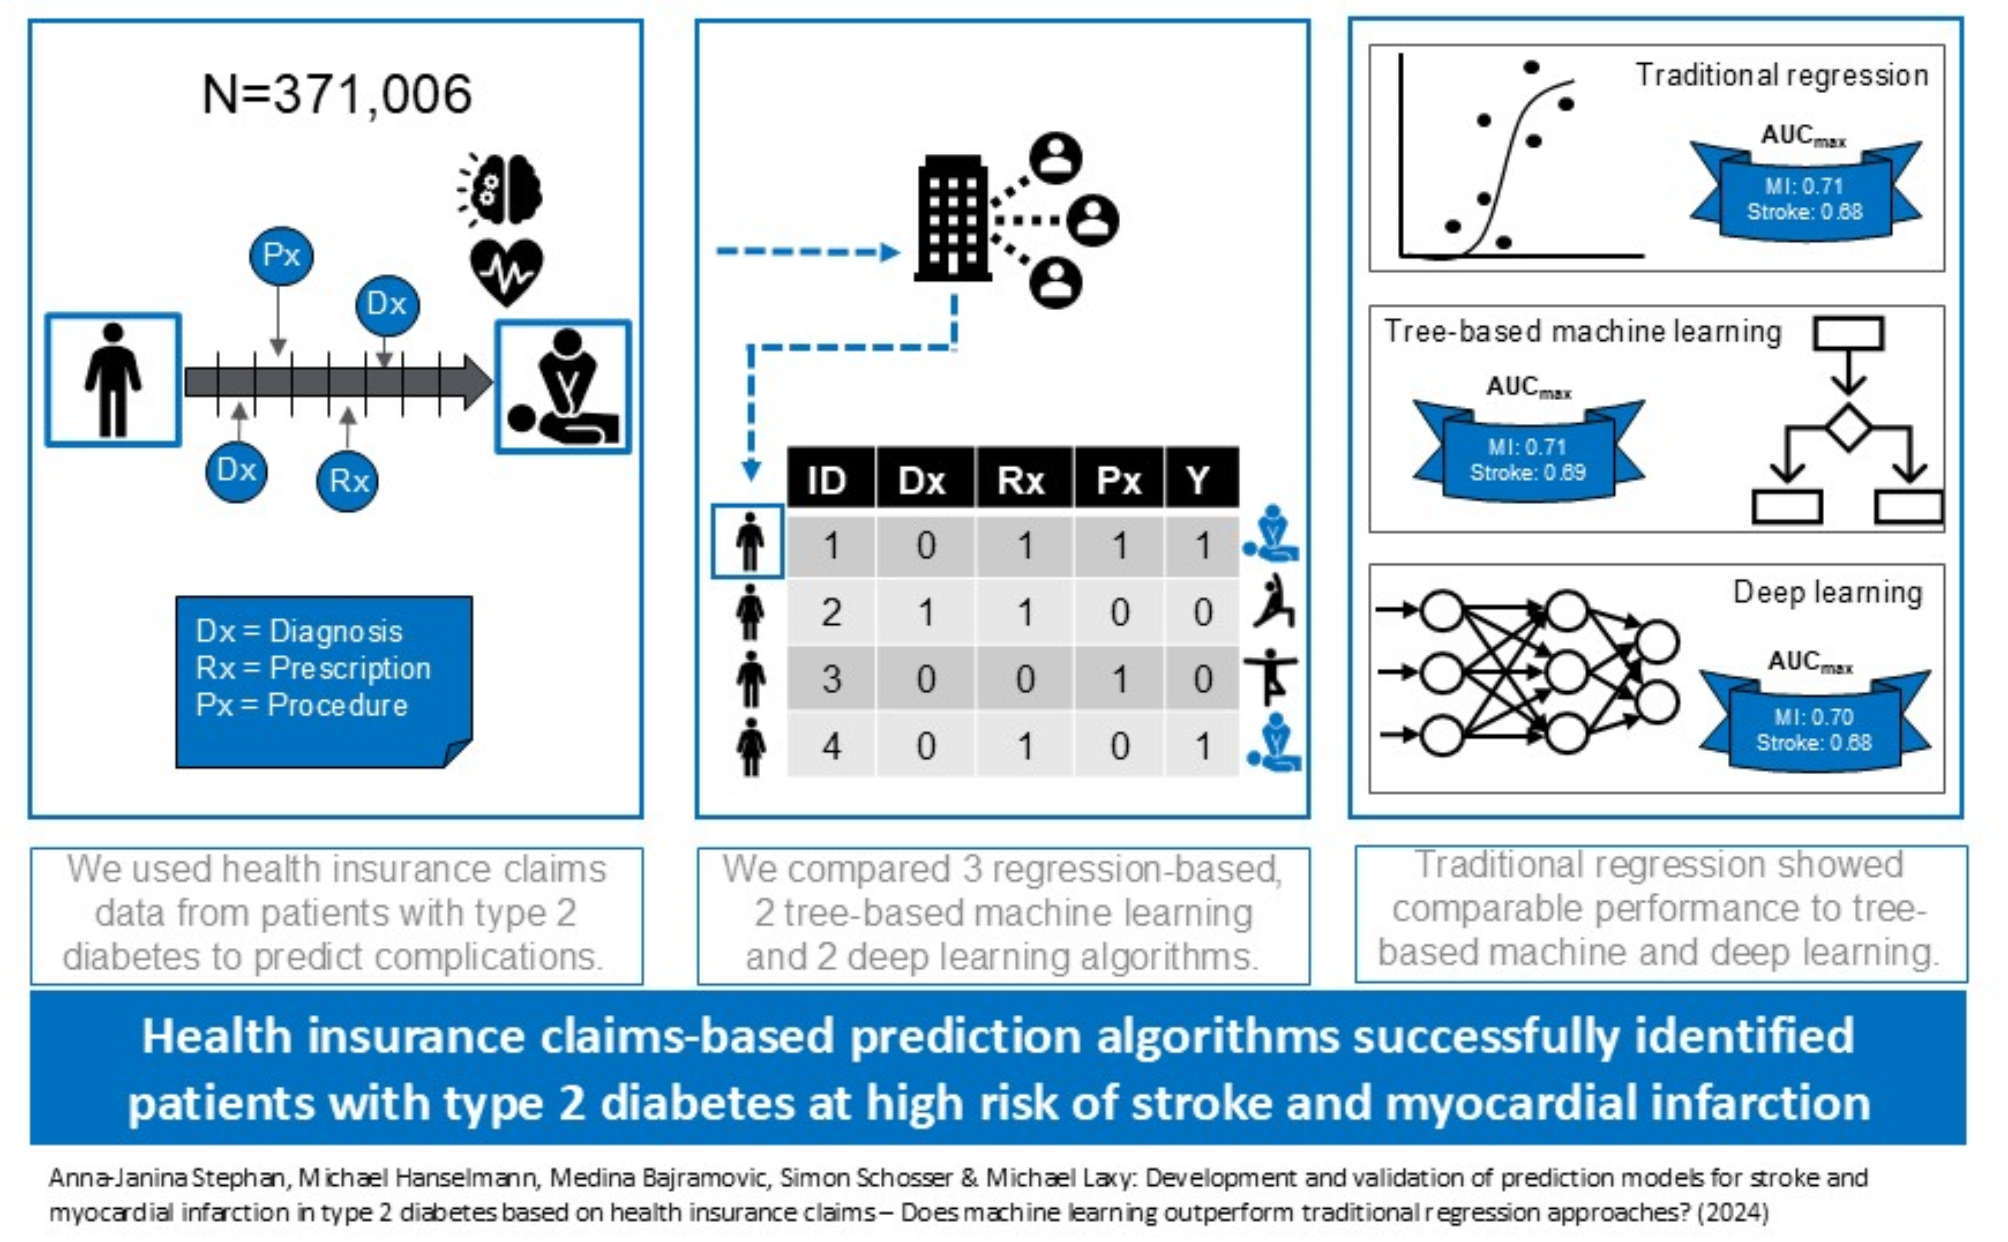
Using German SHI data, we showed that health insurance claims, which are in many countries the largest source of routinely collected real-world secondary healthcare data, can be used to develop and validate prediction models for stroke and MI in patients with type 2 diabetes. Notably, using a broad set of literature-derived features, we did not find noteworthy performance differences across a broad range of logistic, tree-based and deep learning methods, suggesting that when based on these types of features alone, simpler algorithms may be the preferred choice for the purpose of population-wide screening.
All models were well calibrated and clearly outperformed the respective null model in terms of discrimination, more than doubling AUPRCs and yielding AUROCs of 0.70–0.71 (MI) and 0.66–0.69 (stroke). This is within the AUROC range of other published and validated models of 0.68 [18], 0.69 [19], 0.76 [20], and 0.78 [20] for MI and between 0.64 [21] and 0.88 [22] for stroke [19,20,21,22,23,24,25,26,27,28]. Published models used various data sources (cohort data, combinations of claims and lab results) and methods. Previous claims-based models from South Korea [18, 24] and Taiwan [26] included anthropometric and laboratory parameters, information types unavailable in German and many other health systems’ claims. These models yielded AUROCs of 0.70 [24] and 0.72 [26] for 5- and 3-year stroke risk and 0.68 for 5-year MI risk [18]. Two had limited age ranges (40–64 years) and excluded > 20% of observations due to missing values. Notably, despite our data type restrictions and broader population, our models reached comparable AUROC performance. This is in line with one previous study which developed prediction models for major adverse cardiovascular events in type 2 diabetes solely based on U.S. private health insurance claims without anthropometric and laboratory information, with comparable AUROCs of 0.70–0.72 [29]. We are aware of one study [30] that validated the UKPDS-OM2 10-year risk equations for stroke (AUROC = 0.57) and MI (AUROC = 0.58) for Germany using epidemiological cohort data. The considerably longer target window and external validation potentially explain their poor performance.
Previous target windows ranged from 3 [26] to 10 [19] years. As prediction gets more difficult with increasing lead time (visible e.g. in Li et al. 2018, where the 3-year AUROC for stroke of 0.72 decreased to an 8-year AUROC of 0.67) [26], our models might actually perform slightly worse than some predecessors due to unavailability of laboratory or anthropometric information. Also, most validated models use time-to-event analyses combined with simpler regression-based methods as opposed to our simpler classification task with more complex ML/DL methods. We came across one unvalidated MI model [31], but no other internally or externally validated models for stroke or MI in diabetes patients that used more complex ML approaches, even though some efforts seem to be ongoing [32].
Most published models included smaller numbers of features (4 [27] to 24 [28]). However, data hungriness may be a minor practical issue for models which exclusively use readily available data.
It should be noted that the informative value of AUROCs is limited in situations with high outcome class imbalance, as high AUROCs may be driven by high specificity (i.e. good predictions of the negative majority class even in the absence of good predictions of the positive minority class). However, comparison of our models to the literature in terms of better suited performance metrics like AUPRC, PPV and sensitivity was hindered by the fact that previously published models rarely reported these metrics. One exception is the 5-year stroke risk models developed by Yang et al. 2007 [27], who reported a PPV of 0.116 and a sensitivity of 0.657 at their suggested performance threshold. At the optimized F1 value, our stroke model with the highest PPV of 0.094 (GB) reached a sensitivity of 0.212, while the stroke model with the highest sensitivity of 0.345 reached a PPV of 0.08. While cut-offs for our models could be chosen to reach higher PPVs, sensitivity at such cut-offs would be considerably lower and vice versa. Again, the model by Yang et al. incorporated laboratory information unavailable at population level in most health systems’ claims, including Germany and the U.S., and for most other published stroke and MI models, classification performance for the positive minority class remains unclear due to lack of reporting.
Apart from the fact that there are currently no low-cost alternatives with clearly superior performance on relevant metrics for population-based screening, the question remains if the performance of our models is sufficient to justify real-world application. This depends largely on the costs of implementation and consequences of misclassification, which may both be lower for high-level population risk screening than in many clinical settings which directly entail decisions on the use of costly and potentially risky mitigation strategies to avoid event occurrence. In a population-based screening setting, model signals might simply trigger a subsequent contact with the health care system to take more detailed anthropometric and laboratory measurements, which might then in turn allow for more targeted application of prediction models with higher positive predictive values at the cost of more granular data requirements.
All our modelling approaches yielded similar performance results, with Gradient Boosting only marginally outperforming other methods. Even though regularization, tree-based and deep-learning methods make fewer assumptions and adapt more flexibly to the data, in our application they did not seem to “tease out” more information than simpler logistic regression. Potentially SHI data do not contain complex predictive patterns from which adaptive methods could derive increased performance. Alternatively, the literature-based derivation of features, although yielding a well-defined and explainable basis for model development, may have reduced the richness and complexity of information available in the data. This further substantiates that complex ML/DL methods may be advantageous in some, but overhyped in other (data) contexts, highlighting the need to differentiate between preconditions that enable and impede such algorithms to outperform traditional regression [33]. For example, tree-based and deep learning approaches have previously been found to improve claims-based predictions for opioid overdose [34], but not for hospitalization following emergency department visits [35]. For diabetes onset, comparative studies using various data types show equivocal results: In some cases, logistic regression was equally good or better than, only marginally outperformed, or clearly outperformed by more complex methods, or only started outperforming simple logistic regression under specific conditions [36].
Regarding stroke and MI prediction in patients with type 2 diabetes, when using an extensive set of pre-selected literature-derived features, based on our results, we would recommend to either use the GB algorithm for potential future external validation efforts, or even stick to full or forward selection logistic methods for their higher simplicity and explainability and lower computational requirements. However, future projects might want to systematically compare the explanatory power of different sets of features derived from broader and more agnostic approaches than mere literature-based feature identification. For additional technical remarks, see Additional file 49.
All our models identified established risk factors such as age, sex, previous events, and medications indicating presence of specific risks or higher underlying type 2 diabetes severity. Variables such as gynecologist visits, which showed high (protective) importance in some models illustrate that importance does not equal causality [37]: Most probably, gynecologist visits themselves do not affect stroke or MI risk, but carry other relevant information such as identifying as female and higher health literacy (many gynecologist visits are conducted for preventative purposes).
Strengths and limitations of our modelling decisions should be considered when interpreting our results. These concern the (1) underlying data and eligibility criteria, (2) feature identification strategy, (3) feature engineering steps, (4) data splits, (5) modeling methods and (6) validation strategy.
Misclassification errors (for example regarding the differentiation between incident and prevalent diabetes) are possible, as diagnosis records reflect only the formally diagnosed subset of those affected by a disease, and records of diagnoses depend on additional preconditions such as symptoms and resulting contact with the health care system. Conditions which affect physician reimbursement may be over-, and less reimbursement-relevant conditions undercoded. Presence of such misclassification in the training data may have reduced the predictive ability of our models. Most importantly, causes of death are not captured if individuals died without healthcare system contact, thus entailing outcome misclassification of those deaths that were caused by acute MIs and strokes but cannot be identified as such. For stroke, death outside the healthcare system occurs in < 10% of cases [38]. Prehospital MI deaths amount to ~ 24% [39]. Our outcome classification thus represents a selection of healthier individuals (either survived the event or died in care).
Loss to follow-up due to death for other reasons than identifiable (i.e. inpatient) cause-specific (stroke or MI) deaths during the three-year target period was ignored (i.e. treated as “no MI event” / “no stroke event”, respectively), carrying the potential for bias due to competing risks for those individuals who died for reasons other than stroke or MI.
As we limited eligibility to adults < 80 years, extrapolation of predictions to older age remains questionable. Some previously published models included adults above this age cut-off [21,22,23, 26, 27], while others did not [19, 20, 24,25,26].
Claims data are prospectively collected with low risk of recall bias but higher risk of incorporation bias (recorded diagnoses may be affected by the physician’s knowledge of patient history) [12]. However, this risk is irrelevant for features and rather low for relatively “hard” endpoints such as MI or stroke.
Our literature-driven feature identification may have limited the potential for new feature discovery to improve prediction. An agnostic strategy could have attempted to create an exhaustive feature list from the available data. However, this would have entailed new challenges (increased multicollinearity, computational resource requirements, suboptimal events-per-variable ratios) and implicit decisions (e.g. dummy coding vs. count variables, derivation of chronological patient pathways, aggregation level for hierarchically structured code systems).
We decided to reduce data cleaning to a minimum, mirroring real-world application. Not imputing missing values limits our models to the > 98% of the target population with complete information.
There were trade-offs between possible lengths of observation, buffer and target periods. A longer observation period may have increased feature informativeness and thereby model performance. From an applied clinical perspective, longer target periods are desirable. Most validated models for stroke and MI use 5-year target windows [18, 20,21,22,23,24, 26, 27], which was impossible with our total of 5.75 available years. Future projects aiming at longer-term claims-based predictions might require time-to-event instead of dichotomous outcomes due increased censoring and competing events [12].
The ideal test set would have been out-of-time or drawn from an entirely different population [12], as mere out-of-sample internal validation can bias performance results upwards. Further external validation in independent samples (e.g. another insurance company or a later time period) is therefore desirable. External validation in claims from other healthcare systems would additionally require an assessment of data comparability in terms of content, structure, and underlying data generating processes (e.g. physician coding behaviors). Lastly, it should be noted that treatment innovations (e.g. newer GLP1 receptor agonists such as semaglutide or tirzepatide for type 2 diabetes) may affect a model’s predictive power over time. Therefore, the models presented here (as, in fact, any prediction model intended for real-world use) will need periodical re-validations to ensure their sustained performance, and updates of the underlying feature sets should be considered as needed.
After external validation, acceptance and (cost-)effectiveness of real-world model application should be evaluated. Meanwhile, legislatory developments are paving the ground for such real-world application. Ideally, this should combine risk prediction with targeted preventative interventions. These might comprise messages to high-risk insurees suggesting to seek care or participate in mitigation measures such as case or disease management programs, and physician alerts to check for derailed risk factors. It will be important to ensure both availability of such interventions and willingness of payers and providers to implement them.


留言 (0)