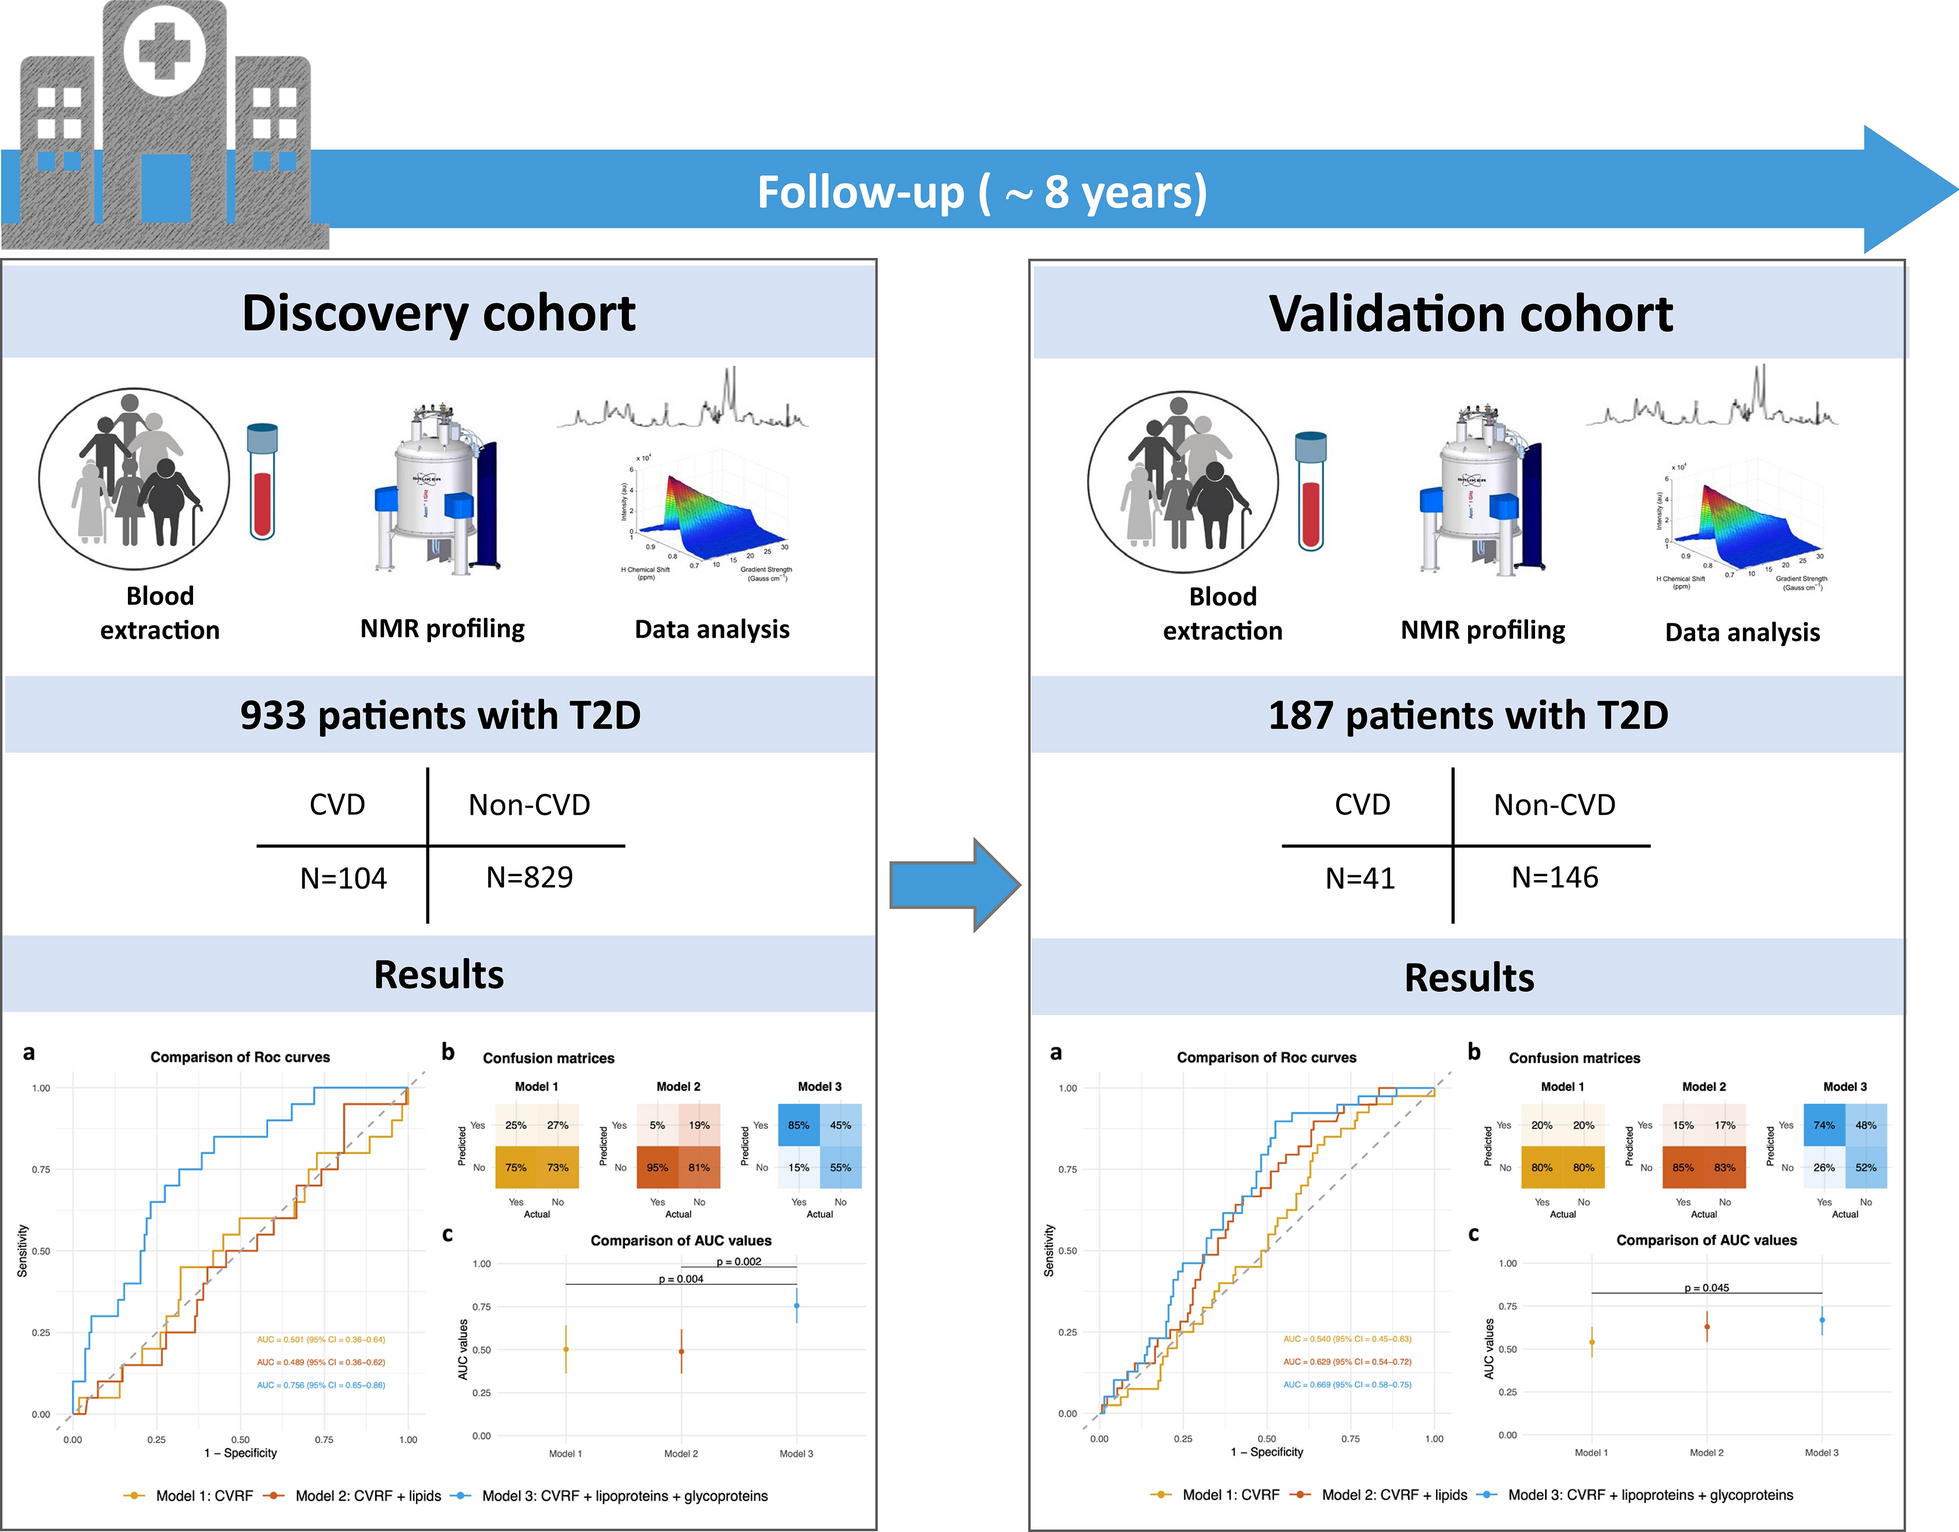
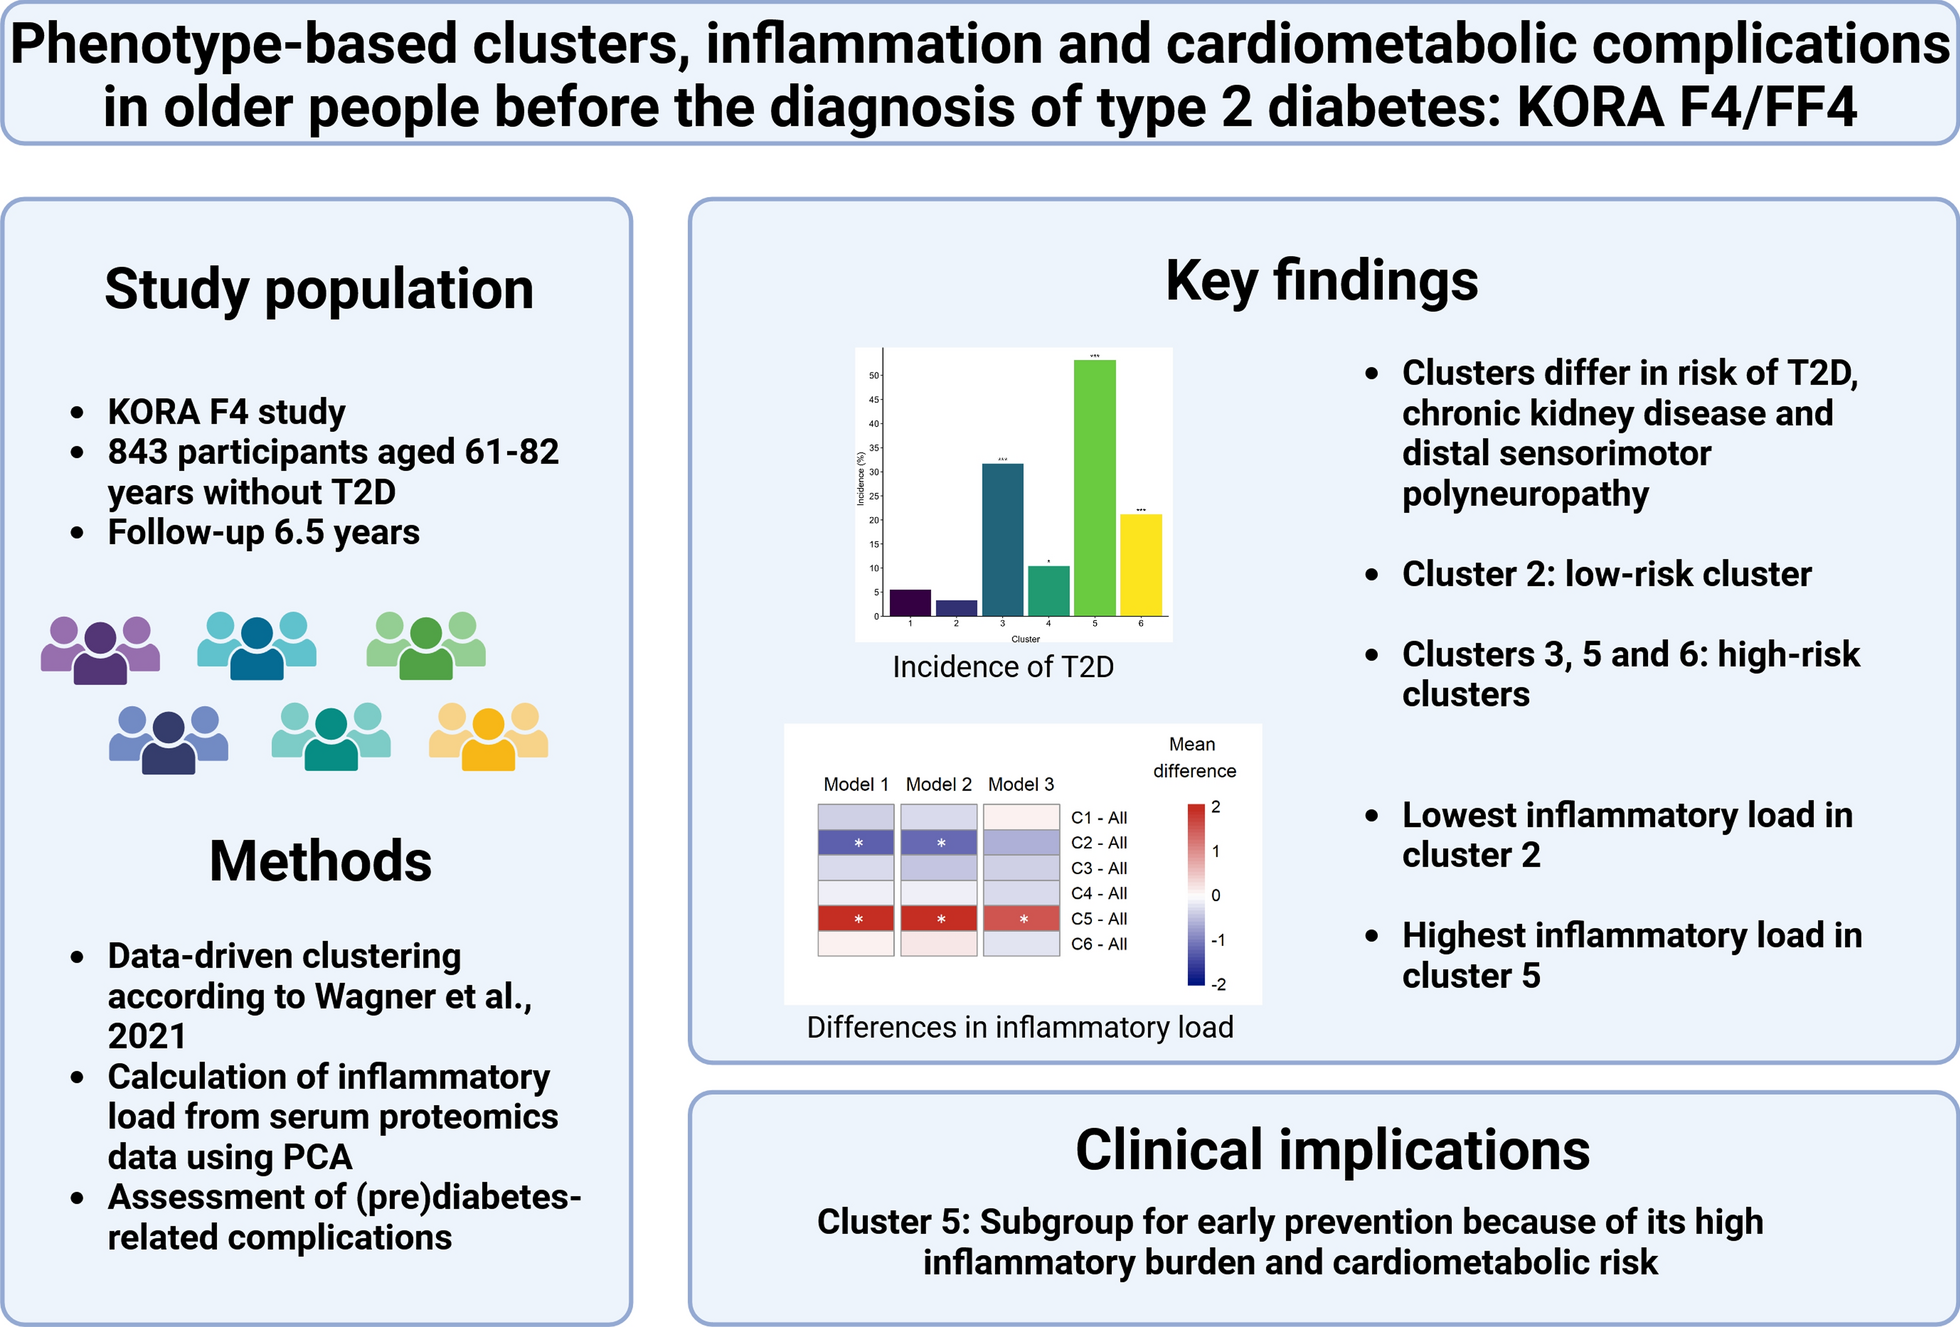
The outcomes of this large prospective cohort of persons with DM demonstrate the following: (i); five ML models, especially the LGBM, based on ten patients’ related features had acceptable performance in predicting CVEs in people with DM and CKD; (ii) the key factors in interpretation of CVEs model prediction were eGFR, age, and TyG index; (iii) lower eGFR, higher age and TyG index increased the interpretation of the model.
In the previous analysis related to The Silesia Diabetes-Heart Project [12], RUSBoost algorithm with multiple Logistic regression was utilised to predict the CVEs in persons with DM and found that using 12 selected features could correctly identify 74% high-risk persons and 62.4% low-risk ones with an AUC of 0.72. Meanwhile, unsupervised hierarchical clustering used in this study revealed distinct characteristics between high and low risk persons, indicating ML had the potential in risk stratification for persons with DM.
For persons with CKD, studies also demonstrated that ML had good predictive performance for predicting CVEs [11]. However, these studies focused either only on DM or CKD alone, and seldom studies were specifically designed to evaluate the role of ML in predicting CVEs in persons with DM and concomitant CKD. For example, Ren et al. [18] recently conducted a retrospective study to assess the risk of CVEs with a deep learning-based survival model (DeepSurv) in diabetic kidney disease and found DeepSurv model had a relatively high predictive performance with AUC of 0.780, but the duration of this study was relatively short with a median follow-up of 10.4 months. In contrast, the median follow-up period in our present study was greater than five years. Given that both DM and CKD are chronic conditions and their interaction worsens the outcome, a longer follow-up period helps to better assess the factors related to prognosis.
The performance of ML algorithms is based largely on the quality and quantity of available data. In this study, we first performed feature selection using three commonly used and classic methods to select feature variables for ML and the selected variables from the three methods were similar. This suggests that although the principles of the three feature selection methods differ, the results are robust. The common features from these methods include most of these parameters (namely, age, CAD, CRP, eGFR, gender, HbA1c, hypertension, heart failure, history of stroke and TyG index).
There are several ML models and algorithms, each has its own advantages [19]. For example, the LR model is easy to implement, performs well on low-dimensional data, and is very efficient for linear data. However, it does not achieve good accuracy when variables have complex relationships [20]. The RF model scales well with large datasets, achieves high accuracy with several decision trees, and is robust to noise, but it can suffer from overfitting if the model captures noise in the training data. Thus, leading to poor generalization on new data and a lack of interpretability; in contrast, the Support Vector Machine (SVM) model is more robust compared to the LR model, performs well in classifying semi-structured or unstructured data, and has less risk of overfitting, but it is not suitable for large datasets with many features or datasets with missing values [20]. Since each model is based on a different algorithm, their performance varies across different datasets. The best approach is to use cross-validation to determine which model performs best on the test data. In our study we constructed five ML models and evaluated their predictive performance. Among these, LGBM model had the best performance. LGBM is a gradient boosting framework based on decision tree algorithm with faster training speed, higher efficiency, and better accuracy than any other boosting algorithm, such as XGBM [21]. However, the performance of different ML models varies significantly, and the optimal ML model should be based on the quality and quantity of the study’s data as well as the optimised algorithms with optimal hyperparameters.
ML algorithms operate as ‘black boxes’, as such it may be unclear how they produce a certain decision output [22]. In recent years, the explainable ML model was proposed to make the black-box model to be of greater accuracy and high interpretable with different methods, among which SHAP is a commonly used tool [23]. SHAP is a game theoretic approach based upon Shapley values, which quantifies the contribution of each feature to the outcome of the ML model and explains how each feature contributes to the predicted probability and displays the final prediction based on the sum of the average prediction and all the SHAP values; therefore, SHAP is helpful not only to the local interpretation of the model, but also for global interpretation, thus making the model more explainable [24,25,26]. It’s worth noting that the feature importances obtained from LGBM and SHAP demonstrated some differences. For instance, the most important feature in the former is age, while in the latter, the most important feature is eGFR. This discrepancy might be related to the different algorithms used by the two methods: LGBM model uses the Gain or Split algorithm [27], whereas SHAP value is based on tree-based models [28]. However, overall, the feature importances calculated by the two methods are similar, indicating that these features contribute consistently across different algorithms. Additionally, whilst using SHAP to interpret the machine learning model, we discovered some unexpected findings. For example, elevated HbA1c levels are typically associated with poor glycemic control and an increased risk of CVEs [29]. However, our study found that lower SHAP values of HbA1c enhanced the model’s interpretability. A possible interpretation is that lower HbA1c levels indicate stricter glycemic control, which to some extent increases the risk of hypoglycemia and may also correspondingly elevate the risk of CVEs [30]. Therefore, when developing ML models in the future, incorporating hypoglycemic events and their severity may be a key feature in CVE prediction.
Most of prior ML studies of DM and CKD only provide features selection [18, 31,32,33], but seldom delve into the decision-making processes with an explainable method. Our present study displays the underlying process of prediction; how variables contribute to the decision as well as the relationships of interdependence and interaction between variables, making the ML model justifiable and transparent. Based on the SHAP value, the top three features in the present study were eGFR, age, and TyG and there was a dependent relationship among the three variables. Lower eGFR and higher age increased the interpretation of the model while higher eGFR and younger age decreased the interpretation, which are consistent with the conclusion from traditional prediction algorithm [34, 35].
In recent years, TyG index, a composite indicator composed of fasting triglyceride and fasting glucose, has been shown to be an alternative proxy of insulin resistance [36]. TyG index has also been demonstrated to be a reliable predictor of CVEs in both general population and people with DM [37, 38]. Besides, the predictive value of TyG index has been confirmed in people with CKD [39]. Our present study extends previous findings, indicating that TyG index was also an important marker of predicting CVEs in concomitant DM and CKD.
We constructed five ML models, but the predictive ability of the optimal model (LGBM) was only moderate with AUC 0.740. DM and CKD involve complex pathophysiological process and clinical characteristics are significantly heterogeneous among individuals while collecting all features is challenging; therefore, the features used for ML model may not be generalised to all individuals. Importantly, the predictive performance of our ML is multifactorial dependent. Besides clinical features, the algorithm differences among different ML models, model complexity, and hyperparameters used in the model altogether determine the final performance.
In this ‘real world’ clinical study we used non-traditional method, ML model to predict CVEs in persons with DM and CKD. This novel approach identified several features for predicting CVEs, some of which have been widely validated, while some new features and their clinical value warrants further investigation. For persons with DM and CKD, whether treatment strategies could be optimised based on the risk stratification with ML model and whether their prognosis could be improved deserve further study.
Limitations
Some limitations in the present study need to be addressed. First, the sample size of persons with CKD in this large cohort of persons with DM is relatively modest and the incidence of events is relatively low. These unbalanced data are challenging for ML. Although weights were introduced for correction in the ML parameter design, the characteristics of the cohort may limit the predictive performance. Second, the study granular lacks features related to cardiac structure and function, such as B-type natriuretic peptide, troponin, and left ventricular ejection fraction, which could add important variables for CVEs. However, the addition of these variables in routine clinical practice would be challenging, given the variability to which they are undertaken. Third, the significant heterogeneity in clinical characteristics among persons with DM and CKD reduces the predictive performance of ML. Fourth, we only constructed five commonly used ML models, and it is unclear whether other models may have better predictive performance. In addition, SHAP, as a method for interpreting the results of ML models, has its limitations. SHAP method itself does not assume feature independence, some approximation methods used to calculate SHAP values do rely on this assumption [40]; in most real-world applications, this assumption is unlikely to hold, and as such, SHAP-based explanations should be interpreted with caution. Additionally, interpreting SHAP values can be particularly challenging in high-dimensional datasets. Moreover, a significant limitation of SHAP analysis is that it does not quantify the importance of predictors in the context of real-world problems but rather their relevance to the model’s predictions [40]. SHAP values illustrate how features influence the model’s predictions for specific observations, rather than how those features contribute to the actual outcomes. Finally, this study lacks external validation, so it needs to be further confirmed whether the model can be generalised to new cohorts and therefore, results of the present study should be interpreted with caution as a proof-of-concept. Future research should be directed at incorporating or refining the current methodology and parameters of importance with routinely collected retinal fundus imaging data to ascertain whether such a model is superior to the currently described ML-based models. Indeed, our team has recently demonstrated the ability of a novel AI-based algorithm to detect cardiovascular autonomic neuropathy in DM utilising retinal fundus images [41]. The importance being that cardiovascular autonomic neuropathy is highly predictive of CVEs in DM [42].


留言 (0)