Sample preparation and extraction
After permission was obtained from the local authorities, the specimen of S. guineense was collected from the wild habitat of Dalle district, 47 km away from Hawassa, the regional capital city of the Sidama National Regional State, in February 2022. The formal identification of the plant material was done by Melaku Wondafrash, a seasoned plant taxonomist, given the voucher specimen identification number: NT061 and is deposited in publicly available National Herbarium (ETH), Addis Ababa University, Addis Ababa, Ethiopia [17]. After the bark of the plant dried and pounded, chloroform, ethyl acetate, water, acetone, and ethanol extracts all were prepared by dissolving 10 g of the air-dried bark fine powder separately in 100 mL of each solvent. All extractions were conducted in triplicate. After keeping in an orbital shaker (Buchi, Switzerland) for 8 h at room temperature, the extract was filtered using Whatman № 1 filter paper (Whatman LTD, England) and evaporated to dryness under vacuum at 45 ºC under reduced pressure using a rotary evaporator (Buchi, 3000 series, Switzerland). Finally, the dried extracts were stored in a sealed plastic container at 4 ºC until used for the experiments.
Phytochemical analysisTotal phenolic content
The total phenolic content (TPC) was estimated by the Folin-Ciocalteu method with slight modifications [18]. A 0.1 mL of the extract (1 mg/mL) was mixed with 1 mL of diluted Folin-Ciocalteu reagent. The mixture was left for 5 min and then 1mL of sodium carbonate (7.5 g/100mL solution) was added. After incubating at 25 ºC for 90 min, the absorbance of the resulting blue color was measured at 765 nm using a UV-visible spectrophotometer (Spectronic 20, UK). The TPC was expressed in terms of milligram gallic acid equivalent per gram of dried extract (mgGAE/g) using a gallic acid calibration curve (y = 0.024x – 0.014, R2 = 0.996), and the results were calculated using the equation:
Where; C = TPC (mgGAE/g), c = the concentration established from the gallic acid calibration curve (μg/mL), V = volume of extract solution in milliliter, m = weight of dried extract in gram.
Total flavonoid content
The total flavonoid content (TFC) was determined as described by Ayoola et al. [19]. , with minor modifications. The quantification was based on the formation of the yellow color of the flavonoid-aluminum complex. Briefly, a volume of 2 mL of 2% aluminum chloride was mixed with the same volume of the extracts (1 mg/mL). Then Absorbance reading at 415 nm was carried out after 1 h of incubation at room temperature against a blank sample (2 mL of sample solution and 2 mL of ethanol without aluminum chloride). The total flavonoid content was determined using a standard curve of quercetin and values were calculated as milligrams of quercetin equivalent per gram of dried extract (mgQE/g) based on the quercetin calibration curve (y = 0.011x + 0.132, R2 = 0.97) and the results were calculated using the equation:
$$\:\varvec=\frac\varvec\varvec}}$$
Where; C = TFC (mgQE/g), c = the concentration established from the quercetin calibration curve (μg/mL), V = the volume of extract solution in milliliter, m = the weight of the dried extract in gram.
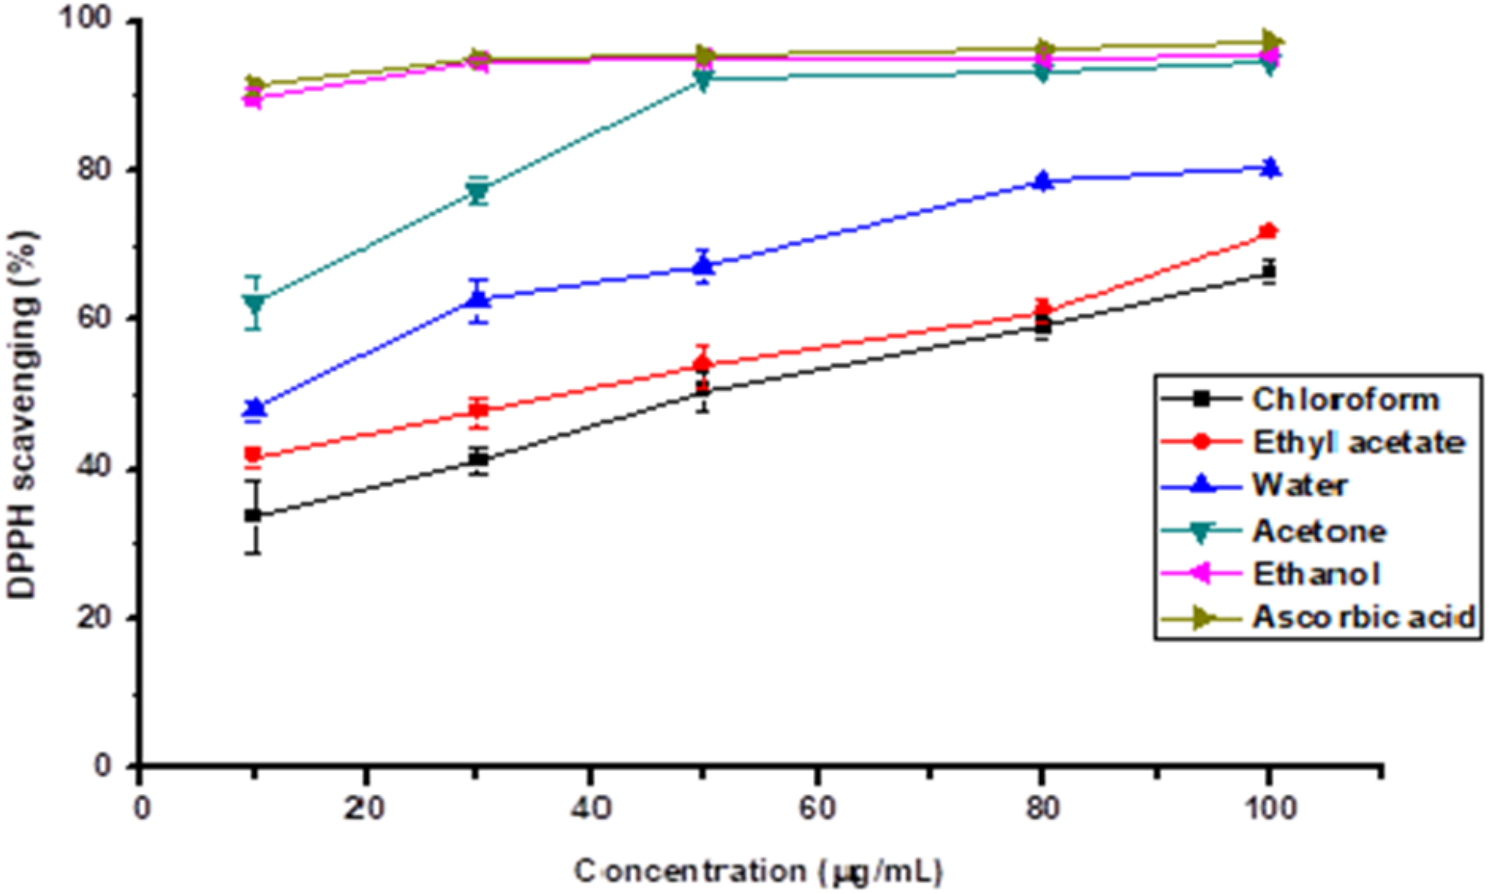
DPPH scavenging activity
The DPPH scavenging activity of the extracts and references was determined as described by Engida et al. [18], . Various concentrations ranging from 10 up to 100 μg/mL) of the extracts and commercial antioxidant (ascorbic acid) were taken in different test tubes. The volume of 2 mL of freshly prepared DPPH solution (0.06% w/v) prepared in ethanol was added to each of the test tubes containing 1 mL of the extract. The extract mixtures and the reference standards (ascorbic acid and BHT) were vortexed and left to stand at room temperature in the dark for 30 min. The absorbance of the resulting solution was then measured at 517 nm. Ethanol was used as a blank. The ability to scavenge the DPPH radical was calculated as:
$$}\,}\,\left( } \right)\,}\,\left[ }\, - \,}} \right)}\,}} \right]\,}\,}$$
Where Ac is the absorbance of the control and As is the absorbance in the presence of a sample of the extract.
The IC50 value is defined as the effective concentration (μg/mL) of extracts that scavenges the DPPH radical by 50%. All the tests were performed in triplicate and the graph was plotted with the average of three observations. Using the dose-response curve the IC50 values of the commercial antioxidant and crude extracts were calculated.
Ferric-reducing antioxidant power (FRAP)
The presence of antioxidants in the extract causes the reduction of the yellow ferric/ferric cyanide complex to the ferrous form which can be monitored by measuring the formation of Perl’s Prussian blue at 700 nm and was determined as described in Abebie et al. [20]. , .
Different concentrations (0.5 mg/mL and 1 mg/mL) of the bark extract of S. guineense in ethanol were mixed with 2.5 mL potassium phosphate buffer (0.2 M, PH 6.6) and 2.5 mL of 1% potassium ferricyanide. Then, the mixture was incubated at 50 0C for 20 min, and then 2.5 mL of 10% trichloroacetic acid was added to the mixture. Finally, 2.5 mL of the supernatant solution was mixed with 2.5 mL of distilled water and 0.5 mL FeCl3 (0.1%). Absorbance was measured to determine the amount of ferrous cyanide (Prussian blue) at 700 nm against a black in a UV/vis spectrophotometer. An increase in the absorbance of the reaction indicates the reducing power of the samples. The reducing power was expressed as milligram ascorbic acid equivalents per g of the extract (mg AAE/g) using the following equation (y = 0.0049x + 0.231, R2 = 0.98) based on the ascorbic acid calibration curve.
Total antioxidant using phosphomolybdenum assay
The total antioxidant capacity (TAC) was evaluated as described earlier [18] with slight modifications. The solution of different concentrations of 0.3 mL (5 and 10 mg/mL) in ethanol was prepared in different test tubes. The reagent solution was prepared by mixing 10 mL of 0.6 M sulphuric acid, 10 mL of 28 mM sodium phosphate, and 10 mL of 4 mM ammonium molybdate into a beaker, and 3 mL reagent solution was added to all the tubes. A volume of 0.3 mL of ethanol served as a blank. All the tubes were incubated at 95 0C for 90 min. The tubes were measured at 695 nm using UV-visible spectrophotometers. The TAC was expressed as a milligram of Butylated hydroxytoluene equivalent per gram of the dried extract (mg BHTE/g) based on the calibration curve (y = 0.01x + 0.15, R2 = 0.99).
The test microorganisms
Gram-negative bacteria (Escherichia coli (ATCC-25922), Salmonella typhimurium (ATCC-14028), Klebsiella pneumoniae (ATCC-13883), Pseudomonas aeruginosa (ATCC-43495)) and Gram-positive bacteria Staphylococcus aureus (ATCC-25923) were obtained from former Southern Nations, Nationalities and Peoples’ Region (SNNPR) Health Bureau Public Health Institute, Hawassa, Ethiopia in September 2022. Each microbial culture was maintained by sub-culturing on the appropriate nutrient medium and stored at 4 ºC until use [21].
The growth media preparation
The medium was prepared according to the manufacturer’s instructions. Briefly, 38 g Mueller Hinton Agar was added to a flask containing 1000 ml of distilled water and gently heated until the medium was completely dissolved. The medium was sterilized by autoclaving at 121 °C for 15 min. After cooling to about 50 ºC, approximately 15 ml of the sterilized medium was aseptically poured into 90 mm diameter sterilized Petri dishes and allowed to cool. The sterility of the prepared media was checked by incubation of blindly selected plates at 37 °C for 24 h. All chemicals, reagents, standards, and media used for the experiments were purchased from Sigma-Aldrich (St. Louise, MO, USA).
The disc diffusion assay
The disc diffusion susceptibility test was carried out as described earlier [21]. Briefly, the discs of a 6 mm diameter were prepared from Whatman № 1 filter paper using a cleaned paper puncher and were sterilized by autoclaving and dried in an oven at 120 ºC. Then, the discs were placed in a container and stored at 4 ºC until further use.
To determine the inhibition zone, the sterile discs were soaked aseptically by applying 10 μL of the crude extract at concentrations of 100 mg/mL using a sterile micropipette and then allowed to dry at room temperature for 15 min. Plates with gentamycin (10 μg) served as the positive control and discs with distilled water without the plant extracts were used as a negative control. After inoculation, for each test bacteria, the previously soaked disc with the plant extracts was placed at the center of each of the inoculated plates. The antibacterial activities of the plant extract were evaluated by measuring the diameter of the inhibition zone in each of the plates at the end of the incubation period. The diameter of the inhibition zone including the diameter of the disc was measured using sliding digital micro caliper [21].
The preparation of bacterial inoculum
The disk diffusion method was performed according to the standard procedures stated in [21]. Three to five colonies from pure cultures of each of the selected microbe species were transferred with the help of a sterile wire loop into a separately labeled test tube containing 5 mL of nutrient broth and incubated to grow at a temperature of 37 0C for 2 h. The turbidity of the actively growing broth culture was adjusted by adding sterile nutrient broth to obtain turbidity that was comparable to the 0.5 McFarland turbidity standards [22]. The microbial suspension prepared was used to inoculate the sterile MHA plates by streaking with a sterile cotton swab all over the plate. Streaking was repeated by rotating the plate approximately 60 degrees each time to ensure an even distribution of the inoculum. All of the tests were conducted in triplicate and the averages of the three measurements were used to present the results. All the plates were incubated at 37 0C for 24 h.
Determination of minimum inhibitory concentration
The minimum inhibitory concentration (MIC) was determined using the broth dilution test tube method as described earlier [21]. A total of 100 μL of pure nutrient broth was added to each test tube. The total of 10μL stock solution of 100 mg/mL extract dissolved in distilled water was subjected to two-fold serial dilutions ranging between 50 mg/mL to 1.6 mg/mL. Again, 10μL of 0.5 McFarland bacterial suspensions were added to each test tube containing 100 μL pure nutrient and 10 μL plant extracts and then the tubes were incubated at 37 0C for 24 h. After 24 h incubation, the solution was further inoculated in agar plates and incubated. The MIC was taken as the highest dilution of the extract which inhibited the growth of the bacteria. The lowest concentrations of the extracts that inhibited the bacterial growth after 24 h of incubation at 37 0C were recorded as the MIC.
Statistical analysis
The data were subjected to analysis of variance (ANOVA) using SPSS version 20 (IBM SPSS Inc. Chicago, USA). Linear regression analysis was used to calculate the EC50 value. Duncan’s multiple range tests were used to assess mean separation and the statistical significance was considered at a level of P < 0.05.

留言 (0)