Participants
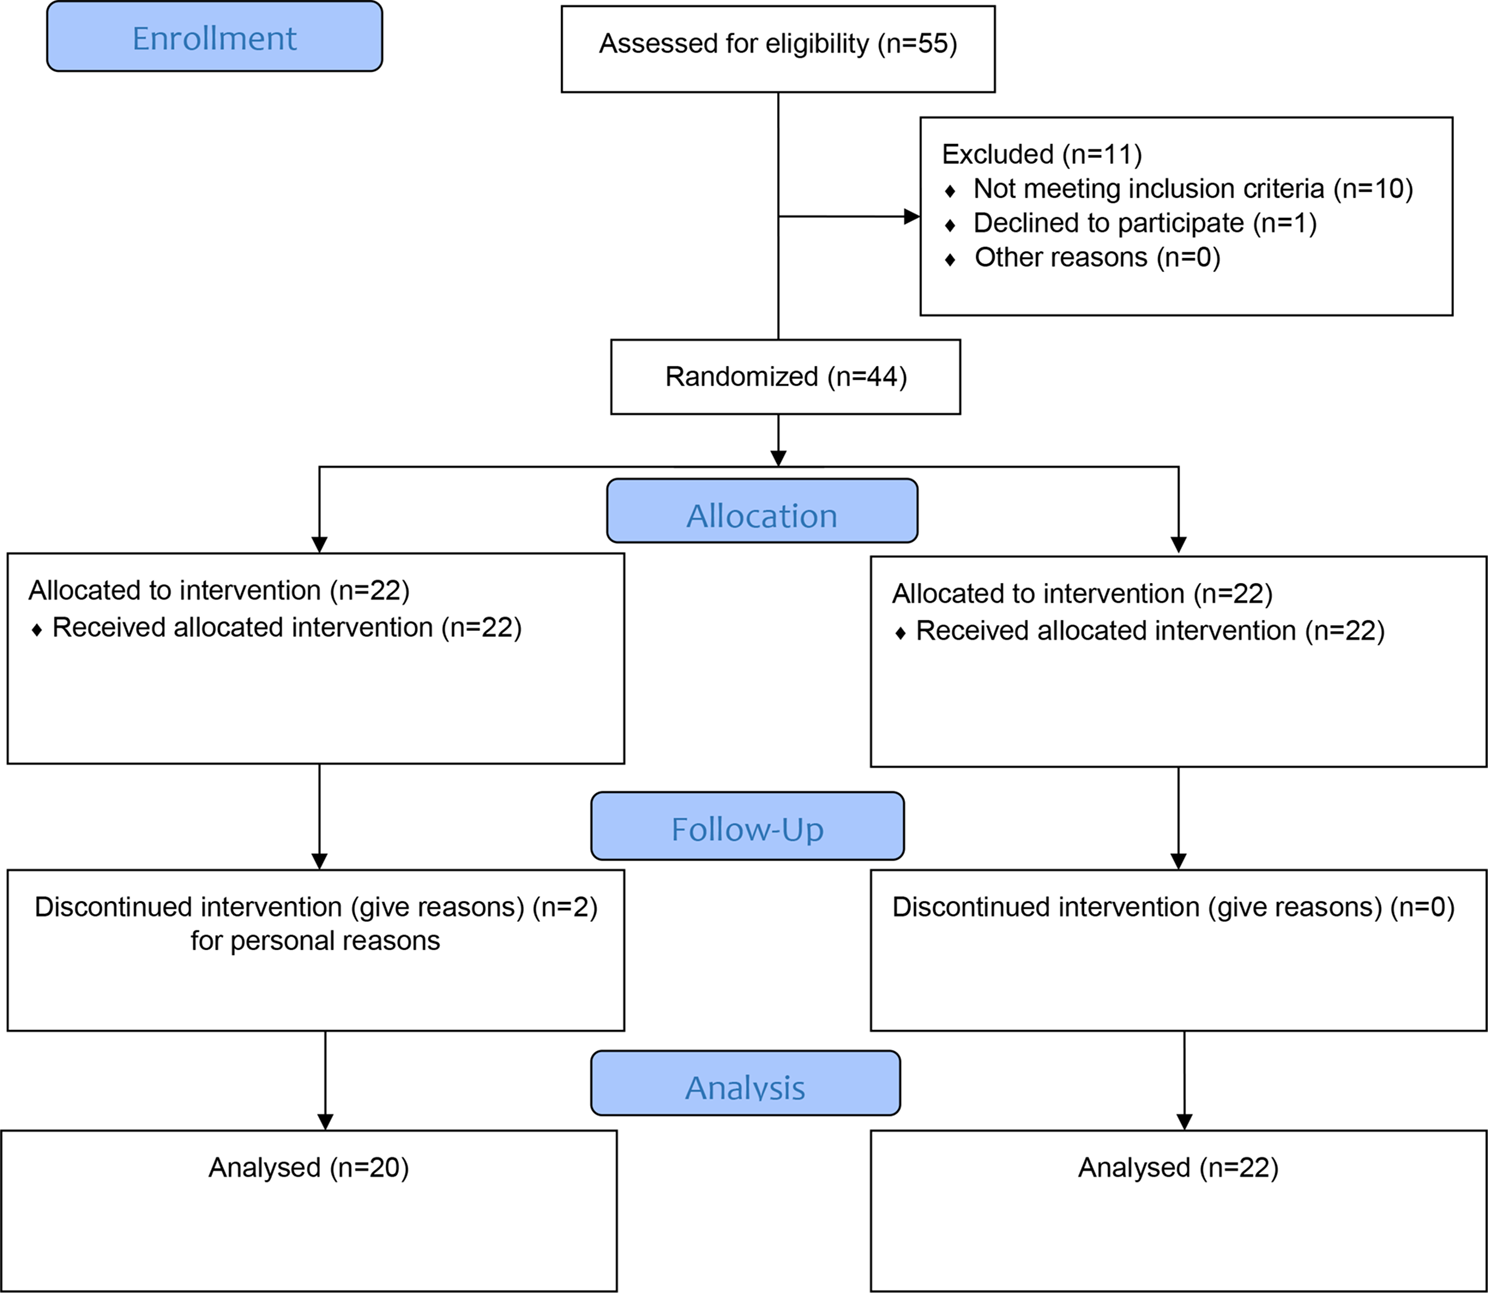
This randomized, double-blinded, placebo-controlled clinical trial was done on 44 patients with non-alcoholic fatty liver disease, aged 18–55 years old. This research was conducted at Velayat Hospital of Qazvin University of Medical Sciences, Qazvin, Iran. Patients were selected from people who referred to the gastroenterology department of the hospital, and with the opinion of a clinical consultant (gastroenterologist). The method of diagnosing patients in this study was liver ultrasound along with the rejection of other causes of liver diseases, which is a common method in the clinical diagnosis of NAFLD. Before the ultrasound, patients were asked to fast for several hours to enhance the accuracy of the images. All participants underwent liver ultrasound performed by a trained radiologist using a high-resolution ultrasound machine. The presence of hepatic steatosis was identified based on characteristic ultrasound features, including increased echogenicity of the liver parenchyma compared to the renal cortex, poor visualization of the intrahepatic vessels, and attenuation of the ultrasound beam. Other potential causes of liver enzyme elevation, such as viral hepatitis, alcohol-related liver disease, autoimmune hepatitis, Wilson’s disease, hemochromatosis, and alpha-1 antitrypsin deficiency were excluded from the study. Forty-four patients with NAFLD, including both genders, with a Body Mass Index (BMI) of less than 30 kg/\(\:^\) and moderate physical activity entered the study after receiving a full explanation about the project and completing the consent form. Patients with acute illnesses like cardiovascular, pulmonary, and kidney disease, diabetes, cancer, hemochromatosis, Wilsons disease, hepatitis B and C, and another liver disease, as well as pregnancy and lactation, and those who have been taking dietary supplements in the last three months, were not included in the study. Also, changes in medication, diet, physical activity, or lifestyle during the study, alcohol consumption, history of any type of allergy, use of drugs affecting the liver, dissatisfaction with participating in the survey, and any reported side effects of the supplement were exclusion criteria. The protocol of the study after being approved by the ethics committee of Qazvin University of Medical Sciences, Qazvin, Iran (ethic code: IR.QUMS.REC.1400.362), was registered in the Iranian Registry of Clinical Trials website by the IRCT20141025019669N21 code and followed the principles of the Declaration of Helsinki.
Study design and procedure
At the beginning of the study, information related to demographic characteristics and clinical conditions, including medical history and medications, was collected using a questionnaire. Also, weight, height, and BMI were measured using suitable tools. For each person, weight was measured using a Seca scale (Seca, Hamburg, Germany) with an accuracy of 0.1 kg and height was measured using a tape measure (0.1 cm accuracy). Moreover, the BMI was obtained by dividing weight by height squared (in meters) [18]. Eligible patients by using randomized block methods, were randomly divided into two groups of intervention (EA)(n = 22) and placebo (n = 22). Individuals in each intervention and placebo group received an Ellagic acid capsule (180 mg) and a placebo capsule containing wheat flour for two months daily, respectively. Each capsule contained 180 mg of Ellagic acid, with the remaining volume filled with wheat flour. Prescribing this daily dosage is based on research and prior clinical experience, which have shown no associated side effects [17]. The shape, color, and size of the placebo were exactly the same as the supplement capsules. The reason wheat flour was used as a placebo is due to its neutral taste and appearance, making it effective for blinding in clinical trials. It should be noted that the effective selective dose for EA supplementation was taken from Ghadimi M et al. [17]. The supplement was prepared by a pharmaceutical company (Supplement Spot Company), and the School of Pharmacy, Tabriz University of Medical Sciences, made the placebo. Also, in this double-blind study, the patients, researchers, and specialist physicians were blind to supplements and placebo. To maintain blinding, an independent individual, not involved in the study, was responsible for packaging the capsules for groups A and B. At the beginning and end of the study, to control confounding factors such as diet and physical activity, a 3-day dietary recall questionnaire was taken through an interview, and subjects with moderate physical activity levels were enrolled. Analysis of the food recall questionnaire was done using the Nutritionist IV program (San Bruno, CA), modified for Iranian food composition was used for estimating participants’ dietary intake. Also, the amount of physical activity was evaluated through the International Physical Activity Questionnaire (IPAQ). Using available guidelines, IPAQ data were converted to metabolic equivalent-minutes/week [19]. To control the patients in terms of supplement consumption and prevent the samples from falling, they were followed up every seven days through phone calls. Evaluation of the EA capsule consumption was done by determining the number of remaining capsules at the end of the study, and patients who consumed less than 10% of the supplement were excluded from the study.
Laboratory methods
At the beginning and end of the study, 10 cc of venous blood samples were taken, and after serum separation, glycemic indices, lipid profile, liver enzymes, and inflammatory factors were measured in the plasma of participants by using a special kit and ELISA method. The samples were immediately stored at -80\(\:℃\) for further laboratory assessments. FBS concentration was determined by the enzymatic method using an Abbott Model Aclyon 300, Abbott Park, IL Autoanalyzer with Pars-Azmoon kit (Tehran, Iran). Plasma insulin was measured by using a chemiluminescent immunoassay method (LIAISON analyzer [310360] Diasorin S.P.A., Verecelli, Italy). IR was calculated according to the following formula: HOMA-IR = [fasting insulin (U/ml) × FBS (mg/dl)]/405 [20]. TC levels were measured by the enzymatic spectrophotometric method using an Autoanalyzer (Abbott, Model Alcyon 300, Abbott Park, Illinois) with Pars-Azmoon Kit (Tehran, Iran). TG and HDL were determined by the enzyme colorimetric method using an automatic analyzer (Abbott, Model Alcyon 300, Abbott Park, Illinois) with Pars-Azmoon Kit. LDL was calculated by Friedewald formula: LDL-C (mg/dl) = TC −(HDL-C + TG/5) [21]. Serum concentrations of AST, ALT, ALP, and GGT were measured by spectrophotometric method with a quantitative detection kit (Pars-Azmoon kit, Tehran, Iran). Serum level of TAC was measured by a spectrophotometric method using Randox TAS (Laboratories, Crumlin, UK), by an Autoanalyzer (Abbott, Model Alcyon 300, Abbott Park, Illinois). Serum MDA levels were measured by thiobarbituric acid method. Inflammatory factor CRP concentration was measured by immune turbid metric assay (Pars-Azmoon kit, Tehran, Iran).
Sample size and statistical analysis
To calculate the sample size, the TG level factor was used before and after the administration of EA supplement in the study of Ghadimi et al. [17]. Therefore, if the mean and standard deviation of the TG before and after the supplementation was 159.9\(\:\pm\:\)13.04 and 141.57\(\:\pm\:\)10.75, it was calculated as 15 people for each group, and 22 people were considered in each group due to the possibility of dropping out.
N= [(Z1−α/2 + Z1−β) 2 (SD12 + SD22)] /∆2.
Statistical analyses were conducted using SPSS version 20. All data were presented as mean\(\:\pm\:\)SD, and the normality of data distribution was evaluated by the Kolmogorov-Smirnov test. The statistical method of the paired t-test was used to compare the mean variables in each group, and the independent sample t-test method was used to compare the variables between the two groups. In this research, p\(\:<\)0.05 was considered statistically.

留言 (0)