Reagents
3-(4,5-Dimethylthiazol-2-yl)-2,5-Diphenyltetrazolium Bromide (MTT) (Sigma, USA), 4’,6-diamidino-2-phenylindole (DAPI) (Molecular Probes, Thermo Fisher Scientific Inc, US), Fluorescein diacetate (FDA) (SolarBio®, China), Hoechst 33,258 (SolarBio®, China), Acridine Orange (AO) (SolarBio®, China), Annexin V-FITC (BD Biosciences, San Diego, CA, USA), 2′,7′-Dichlorodihydrofluorescein diacetate (DCFDA) (Sigma, USA), Rhodamine 123 (Rho123) (SolarBio®, China), Propidium iodide (PI) (SolarBio®, China), the GF-1 Total RNA Extraction kit (Vivantis, Malaysia), ImProm-II™ Reverse Transcription System (Promega, USA), Taq polymerase (Vivantis, Malaysia), and VISafe green gel stain (Vivantis, Malaysia).
Cell lines and test compound
KON oral cancer cells and MRC-5 normal fibroblast cells were kindly provided by Assistant Professor Dr. Sukannika Tubtimsri, Division of Pharmaceutical Technology, Faculty of Pharmaceutical Sciences, Burapha University. All cell lines were routinely cultured in DMEM media supplemented with 10% fetal bovine serum (FBS), 1% penicillin/streptomycin, and 1% amphotericin B in T-25 and T-75 culture flasks. Cells were subcultured every 3 days. Prior to the experiment, the cells were checked to ensure that the percentage of viable cells was at least 95%.
MTT reduction assay
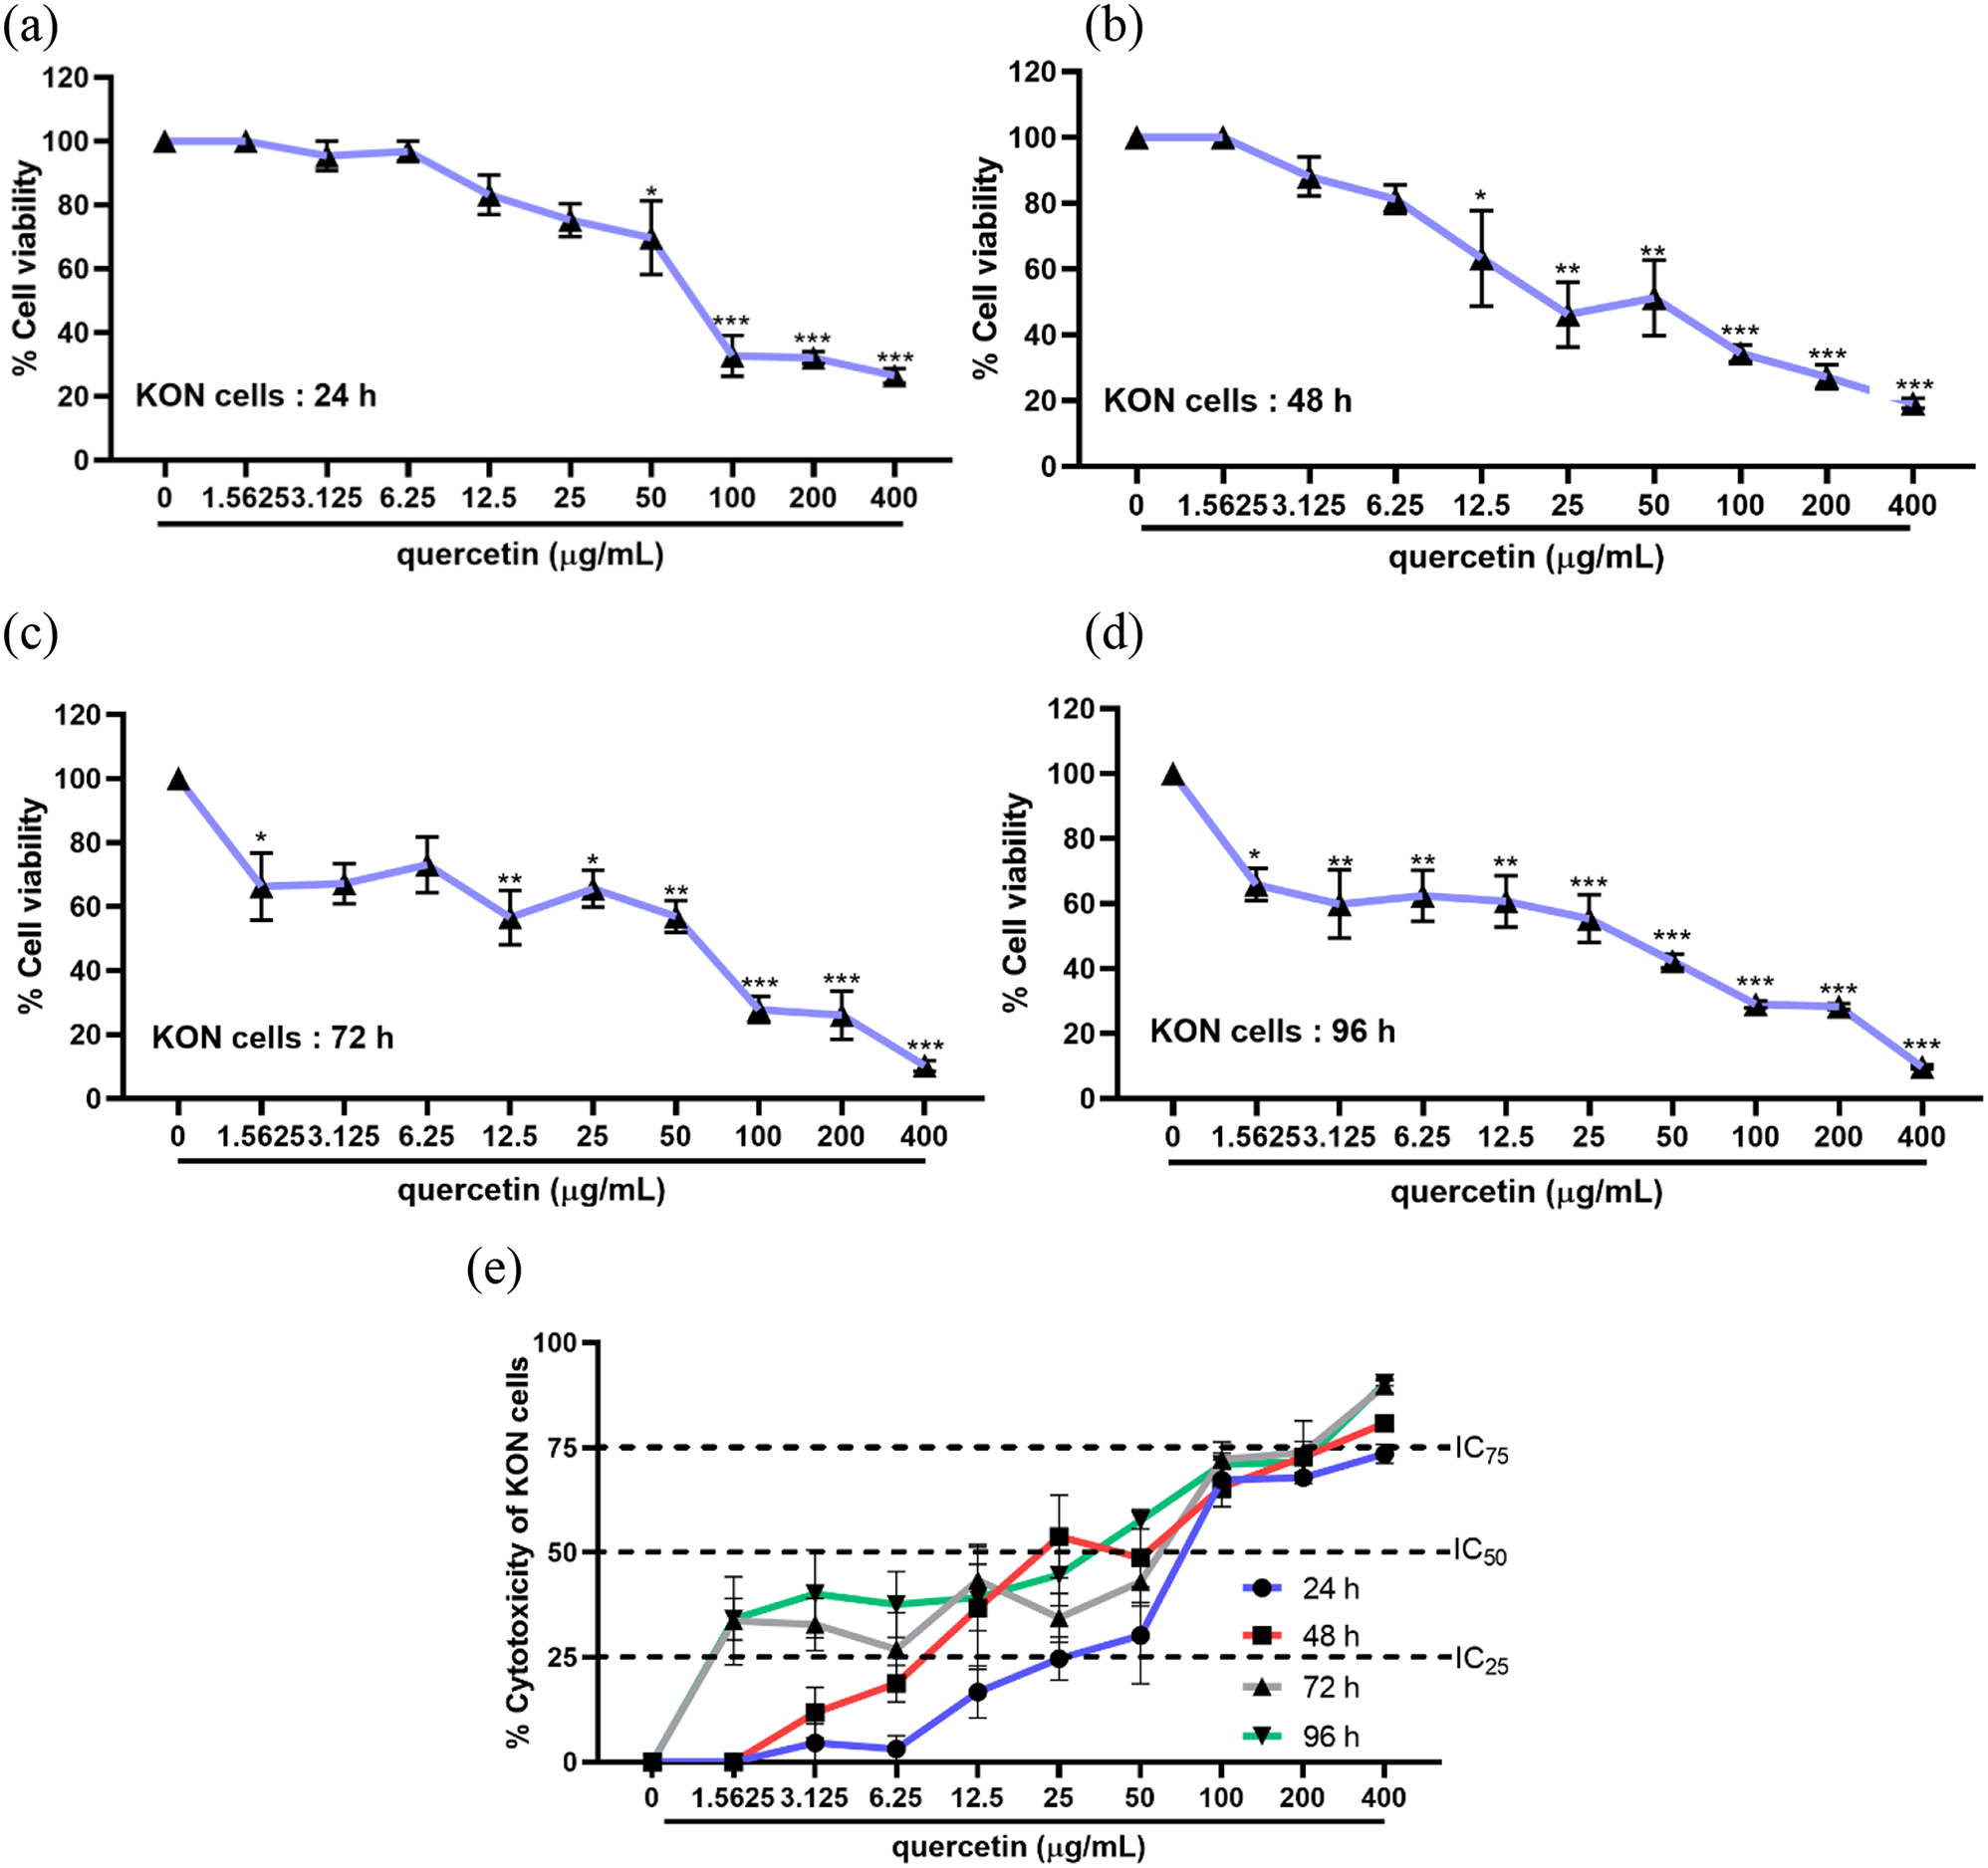
The MTT reduction colorimetric test, which is based on the conversion of MTT solution into purple formazan crystals by mitochondrial dehydrogenase in living cells, is suitable for monitoring the drug sensitivity of established cell lines. After enabling the cells to adhere to the 96-well dish overnight, 10,000 KON cells per well were seeded into each well using 100 µL of DMEM medium. Quercetin at varying concentrations (1.5625, 3.125, 6.25, 12.5, 25, 50, 100, 200, and 400 µg/mL) was applied in triplicate to each well. The cells were then incubated for a further 24, 48, 72, and 96 h at 37 °C in an incubator with 5% CO2. Each well received 5 mg/mL of MTT in phosphate buffer saline (PBS) solution after incubation. In an incubator with 5% CO2, plates were incubated for three hours. In a dark room, the formazan crystals were continuously shaken for five minutes while being dissolved in 100 µL of DMSO. At 570 nm, the absorbance value was measured using a microplate reader (FLUOstar Omega, Germany). The following equation was used to determine the percentage of viable cells: Cell viability is equal to (ODsample-ODblank/ODcontrol-ODblank × 100%), where ODblank is the optical density of a well blank that has been filled with 100 µl of DMSO, ODcontrol is the optical density of the cells that have not been treated, and ODsample is the optical density of the wells that have been loaded with quercetin. The concentration needed to elicit the death effect in 25% and 50% of KON cells (IC25, IC50) was calculated using graph plots of the dose response curve at each time using GraphPad Prism software (San Diego, CA, USA). Control cells (untreated cells) were considered 100% viable cells.
Morphological observation by bright field microscope
KON cells were seeded onto 6-well plates at 37 °C in 5% CO2 in an incubator at a density of 5 × 10⁴ cells/well. Each well’s supernatant was aspirated. For a full day, KON cells were subjected to quercetin serial dilution concentrations of 25, 50, 100, and 200 µg/mL. An objective light microscope with 20x magnification (Olympus, Japan) was used to record morphological alterations. Nuclear condensation, nuclear shrinkage, and apoptotic bodies were observed as the hallmarks of dying cells.
Nucleus and cytomorphological analysis by DAPI and FDA double staining
KON cells were pipetted onto sterile glass coverslips in a 6-well plate at a density of 5 × 10⁴ cells/well in DMEM medium. For a full day, quercetin at concentrations of 25, 50, 100, and 200 µg/mL was added to the KON cells. Two rounds of 1X phosphate buffer saline (PBS) were used to wash the cells. After 15 min, one milliliter of 4% paraformaldehyde (PF) was applied to the fixed cells, and 0.2% Triton-X-100 was used to permeabilize them. For 30 min in a dark room, the cells were stained with 2.5 µg/mL DAPI and 0.5% FDA. After washing the cells in 1X PBS, the coverslips were glued onto the slides. Using an inverted fluorescent microscope (ELIPSR Ts2, Nikon, Japan) with 20x objective magnification, the morphology of the KON cells was examined.
Nucleus and cytoplasm analysis by Hoechst 33,258 & AO double staining
KON cells were seeded onto sterile glass coverslips in a 6-well plate at a density of 5 × 10⁴ cells/well and incubated for 24 h at 37 °C with 5% CO2. Quercetin at concentrations of 25, 50, 100, and 200 µg/mL was applied to the KON cells. Two rounds of 1X PBS solution washing were performed on the KON cells, which were then permeabilized with 0.2% Triton-X-100 after being fixed for 15 min in 4% paraformaldehyde (PF). For 30 min in the dark, cells were stained with 5 µL of Hoechst 33,258 and 5 µL of AO. After the surplus color was removed from the cells using PBS, the coverslips were cemented onto the slides. Using an inverted fluorescent microscope (ELIPSR Ts2, Nikon, Japan) with 10x and 20x objective magnification, the cytomorphological features inside the KON cells were examined.
Annexin V/Fluorescein-5-isothiocyanate (FITC) staining
In a 6-well plate, sterile glass coverslips were used to seed KON cells at a density of 5 × 10⁴ cells per well. Quercetin (25, 50, 100, 200, and 400 µg/mL) was applied to the cells for a full day. Annexin V-FITC was used to stain the non-fixed cells on sterile coverslips. The probe-labeled cells were then incubated for a further 15 min at 25 °C in a dark environment. After washing the cells with PBS to remove excess probe, they were examined using a fluorescent microscope (ECLIPSR Ts2, Nikon, Tokyo, Japan). Three independent experiments were used to count the number of apoptotic cells. Using an inverted fluorescent microscope (ELIPSR Ts2, Nikon, Japan) with 10x and 20x objective magnification, the cytomorphological features inside the KON cells were examined.
Determination of intracellular reactive oxygen species (ROS)
KON cells were planted at a density of 5 × 10⁴ cells/well in a 6-well plate for 24 h in order to measure the generation of ROS. Quercetin (25, 50, 100, and 200 µg/mL) was applied to the KON cells for a full day. After staining the KON cells with 25 µM DCFDA in PBS solution for 45 min at 37 °C, two 1X PBS buffer washes were performed on the KON cells. Using a fluorescent microscope (ECLIPSR Ts2, Nikon, Tokyo, Japan), the levels of ROS production inside the KON cells were measured.
Identification of reactive oxygen species (ROS) formation using oxidized DCFDA
The application of flow cytometry was used to quantify quercetin’s effects on the production of ROS. In a 6-well plate, KON cells were grown for 24 h at a density of 5 × 10⁴ cells per well. Next, various concentrations of quercetin (25, 50, 100, 200, and 400 µg/mL) were added to the KON cells. Following re-suspension in PBS solution, the cell pellets were collected. A 40-minute dark incubation period was observed for the KON cells exposed to 25 µM DCFDA. These cells were then resuspended in 500 µL of PBS solution after being centrifuged for two minutes at 2,000 g. Beckman Coulter, Inc.’s CytoFLEX flow cytometer was used to measure the amounts of ROS production. Around 485–495 nm, the DCF fluorescence intensity was recorded, and between 525 and 530 nm, the green channel was used to detect the fluorescence emission.
Assessment of mitochondrial membrane potential (ΔΨ m)
Rhodamine 123 (Rho123) was used in flow cytometry to measure the integrity of the mitochondrial membrane potential. KON cells were planted in 6-well plates and left for 24 h. Quercetin at 25, 50, 100, 200, and 400 µg/mL was applied to the KON cells for a full day. The cell pellets were trypsinized using a 0.25% trypsin-EDTA solution following the incubation period. Subsequently, 500 µL of PBS solution containing 10 µM Rho123 was used to resuspend the cell pellets. The cell pellets underwent a 20-minute incubation period in a dark environment. Following a 2-minute centrifugation at 2,000 g, the cell pellets were resuspended in 500 µL of PBS solution. The loss of mitochondrial membrane potential was ascertained by measuring the fluorescence intensity of Rho123 using a CytoFLEX flow cytometer (Beckman Coulter, Inc.).
Determination of cell death using annexin V-FITC/PI staining with flow cytometry
Flow cytometry was utilized to ascertain the impact of quercetin on the apoptosis of KON oral cancer cells. In a 6-well plate, KON cells were grown for 24 h at a density of 5 × 10⁴ cells per well. Quercetin ranging from 50, 100, 200, and 400 µg/mL was applied to the KON cells for a full day of treatment. Trypsin-EDTA solution containing 0.25% was used to collect the cell pellets. Reconstituted cell pellets were mixed with 100 µL binding buffer containing 5 µL of Annexin V-FITC, and then allowed to incubate in a dark room for 20 min. After adding 500 µl of room-temperature PBS solution containing 10 µg/mL of dissolved PI, a flow cytometer was used for analysis. Using the CytoFLEX flow cytometer (Beckman Coulter, Inc.), data from 10,000 cells/sample were gathered and examined, and apoptosis in the KON cells was measured with CytExpert software.
Determination of cell cycle distribution by PI with flow cytometer
To quantify the amount of DNA in the nuclei that had been propidium iodide (PI) stained. KON cells were grown in 6-well plates for 24 h at a density of 5 × 10⁴ cells/well. Quercetin at concentrations of 50, 100, 200, and 400 µg/mL was applied to the KON cells for a full day. Following this therapy, a 0.25% trypsin-EDTA solution was used to trypsinize the cell pellets. Centrifugation was used to harvest the cell pellets, which were then washed with 1 milliliter of cold PBS solution. For twenty-four hours, the cell pellets were preserved in ice-cold ethanol at 4 °C. Following that, two PBS solutions were used to wash the cells. RNase A and PI were applied to the cells for thirty minutes. Twenty thousand cells per sample were used to gather the data. Using a CytoFLEX flow cytometer (Beckman Coulter, Inc.), cell cycle distribution analysis was carried out. CytExpert software was used to calculate the percentages of the KON cells in the Sub G, G0-G1, S, and G2-M phases.
Wound healing assay
A density of 100,000 cells per well was used to seed KON cells in 6-well plates. A 200 µL yellow pipette tip was used to generate a straight line wound on a monolayer of cells after 24 h. Washing with a 1X PBS solution eliminated the debris cells. For 24, 48, and 72 h, the cells were exposed to quercetin at concentrations of 25, 50, 100, and 200 µg/mL. As a negative control, untreated cells were employed. Using an inverted microscope (Olympus, Tokyo, Japan), the wound scratch images were captured at various intervals (0, 24, 48, and 72 h). ImageJ software (version 1.47, NIH, USA) was used to measure the width of the wound scrape.
Colony-forming activity assay
To evaluate the anti-proliferative effect on sizable KON cell colonies, for 24 h, KON cells were plated in a 6-well plate with 2,500 cells per well, and 50, 100, and 200 µg/mL of quercetin were applied to the cells for a full day. The following day, each well’s media was aspirated. For seven days, cells were cultivated further, and then, all cultural media were removed from the wells. Three times, 1X PBS solution was used to wash the cells. For fifteen minutes, cells were fixed in acetic acid (3): methanol (7). For thirty minutes, cells were stained with 0.5% crystal violet. Using an Olympus (Tokyo, Japan) 4x objective magnification inverted microscope, five fields/well were randomly selected to capture the cells. The information was shown as a proportion of new colonies.
Transwell migration assay
To calculate quercetin’s anti-migration effect on KON cells, 500 µL of serum-free media was used to resuspend KON cells at a density of 1,000 cells per well. For 48 h, KON cells were pipetted into the transwell migration system’s top chambers with or without quercetin at 50, 100, and 200 µg/mL, and 500 µl of DMEM supplemented with 10% FBS was entirely filled into the lower transwell of the 24-well plate insert. Using a cotton brush, the KON cells in the transwell chamber were removed following incubation and were fixed for 15 min at room temperature using ice-cold methanol. A volume of 500 µL of 0.5% crystal violet was used to stain the KON cells. Five randomly chosen fields were examined using an inverted microscope (Olympus, Japan) with a 10x objective magnification to count the number of KON cells that traveled to the lower compartment. The NIH image analysis program was utilized to tally and assess every insert. The percentage of cells that migrated in the treated cells as opposed to untreated cells is represented by the symbol % in the data, which is the proportion of moved cells.
Matrigel-coated invasion assay
Serum-free DMEM medium was used to dilute the Matrigel matrix. The top surface of the invasion chamber, which was placed on a 24-well plate, was covered with BD Matrigel Matrix. KON cells were trypsinized with a 0.25% Trypsin/EDTA solution prior to being resuspended in a serum-free DMEM medium. Pipetted into the upper chamber of the invasion chamber (pore size: 8 µM; Corning, Cambridge, MA) were cells at a density of 1,500 cells/well, either with or without quercetin (50, 100, and 200 µg/mL) for 48 h. Within the lower compartment was a 500 µL DMEM medium supplemented with 10% FBS as a chemoattractant. Non-invading cells were removed from the upper surface of the invasion chamber using a cotton swab. The cells that invaded the lower compartment of the invasion membrane were preserved for 15 min in ice-cold methanol (AMRESCO, USA). Cells were stained with 0.5% crystal violet for 30 min. The upper chambers were cleaned three times using the 1X PBS. Five randomly selected fields/well were subjected to an invasion cell count using an inverted microscope (Olympus, Japan) with a 10x objective magnification. The percentage of cell invasion was calculated as follows: number of invaded cells in treated cells divided by the number of invasive cells in untreated cells, multiplied by 100%.
Transepithelial electrical resistance (TEER) measurements
TEER values, which also define the barrier’s integrity, provide a quantitative assessment of the cellular absorption of quercetin in a cell monolayer. For 24 h, 50,000 KON cells were cultivated in a 6-well dish. Cells were treated to quercetin at 24, 48, and 72 h in DMEM medium at doses of 25, 50, 100, 200, and 400 µg/mL. A Millicell® ERS-2 Voltohmmeter (Merck KGaA, Darmstadt, Germany) was used to calculate the TEER readings, from which the TEER values were obtained by averaging the ohm values from three different experiments.
Toxicity assessment
A 96-well plate was seeded with MRC-5 cells at a density of 10,000 cells per well. Quercetin was added to the cells at 1.5625, 3.125, 6.25, 12.5, 25, 50, 100, 200, and 400 µg/mL for 24, 48, 72, and 96 h. The assessment of MRC-5 cell viability was conducted by measuring the activity of mitochondrial dehydrogenase in live cells. The MTT cell viability assay was used to measure cell viability. A microplate reader (FLUOstar Omega, Germany) set to read at 570 nm was used to determine the absorbance values. Using the GraphPad Prism program version 8.0, the percentage of cell cytotoxicity was determined, and a cell cytotoxicity graph was created.
Quantification of the selectivity index
A straightforward ratio of IC50 determined for both healthy and cancer cells is commonly used in the literature to represent the selectivity index; values greater than 1 indicate desired selectivity against cancer cells. Our research demonstrates that the starting numbers of both the primitive and the total cells have a significant impact on the IC50 values. For the same reason, such a determined selectivity index will show considerable variability and is a very imperfect statistic. The results of particular activity against distinct sublines can be affected by using per-cell EC50 values in the selectivity index computation, as we demonstrate below. Comparing quercetin’s selectivity index (SI) values, the formula used to obtain the SI for quercetin was SI = (IC50 for the MRC-5 normal fibroblast cell line)/(IC50 for the corresponding KON oral malignant cell line). Quercetin that is more effective against tumor cells than harmful against normal cells is indicated by a favorable SI > 1.0. SI values higher than 2 are regarded as having great selectivity.
Reverse transcription polymerase chain reaction (RT-PCR)
For twenty-four hours, KON cells were planted at a density of 50,000 cells per well onto 24-well plates. Quercetin was applied to the KON cells at 50, 100 and 200 µg/mL over a full day. Using the GF-1 Total RNA Extraction kit, all of the total RNA was extracted. The ImProm-II™ Reverse Transcription System converted RNA to cDNA. Taq polymerase was utilized to amplify the PCR results using specific primers and utilizing the cDNA as the template. The PCR thermal FlexCycler2 (Life Science, Germany) was used to run the experiments. The PCR cycle started with a one-minute initial denaturation at 95 °C. Thereafter, there were thirty cycles of denaturation at 95 °C for one minute, 45 s of annealing (depending on the primer), one minute of extension at 72 °C, and a final extension at 72 °C for ten minutes. For twenty minutes, 1.5% agarose gel electrophoresis was used to run the PCR products. VISafe green gel stain was used to color the gels, and the gel document (Alliance Q9 Advanced, UVITEC, Cambridge, UK) was employed to determine the densities of the DNA bands. The Macrogen DNA Sequencing Service, located in Thailand, handled the primer sequencing. The primer sequences that were utilized in this investigation are shown below:
BCL-2 Forward: 5’-CTG CAC CTG ACG CCC TTC ACC-3’, BCL-2 Reverse: 5’-CAC ATG ACC CCA CCG AAC TCA AAG A-3’; BCL-XL Forward: 5’-GAT CCC CAT GGC AGC AGT AAA GCA AG-3’, BCL-XL Reverse: 5’-CCC CAT CCC GGA AGA GTT CAT TCA CT-3’; GAPDH Forward: 5’-AGG GCT GCT TTT AAC TCT GGT-3’, GAPDH Reverse: 5’-CCC CAC TTG ATT TTG GAG GGA-3’; BAX Forward: 5’-CCC TTT TGC TTC AGG GTT TC-3’, BAX Reverse: 5’-TGT TAC TGT CCA GTT CGT CC-3’; MMP-9 Forward: 5’-TCG AAG GCG ACC TCA AGT G-3’, MMP-9 Reverse: 5’-TTC GGT GTA GCT TTG GAT CCA-3’; MMP-2 Forward: 5’-ACC GTC GCC CAT CAT CAA-3’. MMP-2 Reverse: 5’-TTG CAC TGC CAA CTC TTT GTC T-3’; TIMP-1 Forward: 5’-CGC AGC GAG GAG GTT TCT CAT-3’, TIMP-1 Reverse: 5’-GGC AGT GAT GTG CAA ATT TCC-3’.
Statistical analysis
The GraphPad Prism program Ver. 8.0 (GraphPad™ 8.0, San Diego, California) was used to create the graphs. One-way ANOVA and Tukey’s Honestly Significant Difference (HSD) post hoc test were used to determine the statistical analysis from three independent studies. For statistical significance, a p-value of less than 0.05 was used.

留言 (0)