This study aims to investigate the association between dietary patterns explaining the maximum variability of high- and low-quality fats, sugars, and fibre at both 2 and 8 years of age, and cardiometabolic markers at age 8 years, using a hypothesis driven statistical approach.
Study design and population
We used data from the randomized controlled multicentre EU CHOP study. The primary aim of EU CHOP was to investigate whether infant and follow-on formula with a lower (1.77 and 2.2 g protein/100 kcal, respectively) protein content during the first year of life reduces later obesity risk, compared to conventional infant and follow-on formula with higher (2.9 and 4.4 g protein/100 kcal, respectively) protein content [13]. The study was conducted in five European countries: Germany, Belgium, Italy, Poland and Spain, with infants recruited from birth up to a maximum of 8 weeks [median (IQR) age: 14 d (3–30 d)] between October 2002 and July 2004. Inclusion criteria were being born apparently healthy at term from a singleton pregnancy, with normal weight for gestational age, and born to mothers without health problems or taking medications that could influence intrauterine growth. Detailed information about the study is available elsewhere [13]. For the current analysis, we used data from children who participated in the 2-year visit and those who attended the 8-year visit, with dietary records available for both groups. Cross-sectional analyses included data from children who performed anthropometry, had dietary intake information and blood pressure or blood sample analyses. Prospective analyses included children who attended both visits (at 2 and 8 years) and had dietary records, along with either blood pressure measurements or blood sample analyses.
Health outcome measuresAnthropometry
Anthropometric measurements were taken in duplicate by trained nutritionists following standard operating procedures based on the manual by Lohman et al. [14]. All measurements were taken with participants wearing only underwear. Weight (kg) was measured using a SECA 702/703 digital scale (precision ± 10 g) and height was measured with a digital stadiometer SECA 242 (precision ± 1 mm). Waist circumference was measured at the midpoint between the iliac crest and the lower rib in a standing position after exhalation, according to WHO references [15]. All study centres used the same equipment for these measurements. Body Mass Index (BMI) was calculated as weight (kg)/height (m2). BMI z-scores were calculated using WHO references [15].
Blood pressure
At the 8-years visit, blood pressure was measured using an oscillometric technique with the Digital tensiometer Dinamap ProCare 100/200 (GE Medical Systems, Freiburg, Germany). Measurements were taken in duplicate at least 20 min after the child arrived at the study centre. The measurements were performed on the left arm, while the child remained seated with the arm resting comfortably and using an appropriately sized cuff. Both measurements were separated by a slot time of 5 min, and the average of the two readings was used for statistical analysis. Systolic (SBP) and diastolic blood pressure (DBP) were standardized as percentiles based on body height using references from the American Academy of Pediatrics [16].
Blood sample analyses
Fasted venous blood samples were collected by trained nurses when the child were 8 years old. Serum samples were stored at -80 ºC and transported in dry ice to the central laboratory. Glucose, high-density lipoprotein cholesterol (HDL cholesterol) and triglyceride levels were analysed at the respective local study laboratories using routine methods [17]. Insulin levels (µIU/ml) were quantified using immunoradiometric assays. Fasting insulin and glucose levels were used to calculate insulin resistance (HOMA-IR) using the Homeostasis Model Assessment of Insulin resistance [18, 19]. Serum insulin levels were measured using an immunoradiometric assay (DiaSource, Nivelles, Belgium) following the manufacturer’s instructions. HDL cholesterol ≤ 10th percentile, and triglycerides and HOMA-IR ≥ 90th percentile, based on the age- and sex-specific references from the IDEFICS study [20, 21], were considered altered.
Cardiometabolic risk score
To assess the children’s cardiometabolic risk, we computed a continuous cardiometabolic risk score variable (Cmet Risk) following the method proposed by Eisenmann et al. [22]. This score was calculated as the sum of standardized variables: waist circumference, SBP, DBP, triglycerides, HOMA-IR and HDL cholesterol internal z-scores, this last one multiplied by -1 (as HDL cholesterol is inversely related to cardiometabolic risk). A higher score in this Cmet Risk indicates a less favourable cardiometabolic profile.
Predictors of health outcome measuresAssessment of dietary intake
Dietary intake was assessed using three-day estimated and weighed food diaries completed by the child’s parent or caregiver at ages 2, 3, 4, 5, 6, and 8. For these analyses we used the initial and final intakes (2 and 8 years). Parents were instructed on how to record all food and beverages consumed over two weekdays and one weekend day. Energy and macronutrient intakes were estimated using a database derived from the German BLS II.3 [23]. Food items and recipes not available in the database were incorporated at each study center based on information from manufacturers, other databases, or ingredient lists. Detailed information on standard operating procedures for assessing dietary intake has been previously published [24, 25]. A total of 7444 individual foods and beverages were categorized into 105 groups, which were subsequently reduced to 27 major food groups based on similarities in their nutrient profile and processing levels. Additional information on this process of combining food groups has been previously published [2].
Covariates
Sociodemographic and other characteristics, including sex (male vs. female), country of origin (Germany, Belgium, Italy, Poland, and Spain), maternal education level (high, medium or low), maternal smoking during pregnancy at any time (yes vs. no), maternal BMI, feeding group during the first year of life (lower protein vs. higher protein formula or exclusive breastfeeding for at least 3 months), mean energy intake at 8 years (kcal/day) and BMI z-score at 8 years (not included in BMI outcome measures nor in the cardiometabolic risk score variable) were included as covariates. All categorical variables with more than two levels were converted into dummy variables.
Statistical analyses
Descriptive data were reported as median and interquartile range (IQR) for continuous variables and as frequency and percentage for categorical variables. Normal distribution of variables was assessed visually, and non-normally distributed variables (triglycerides, HDL cholesterol and HOMA-IR) were transformed into a logarithmic scale [20, 21].
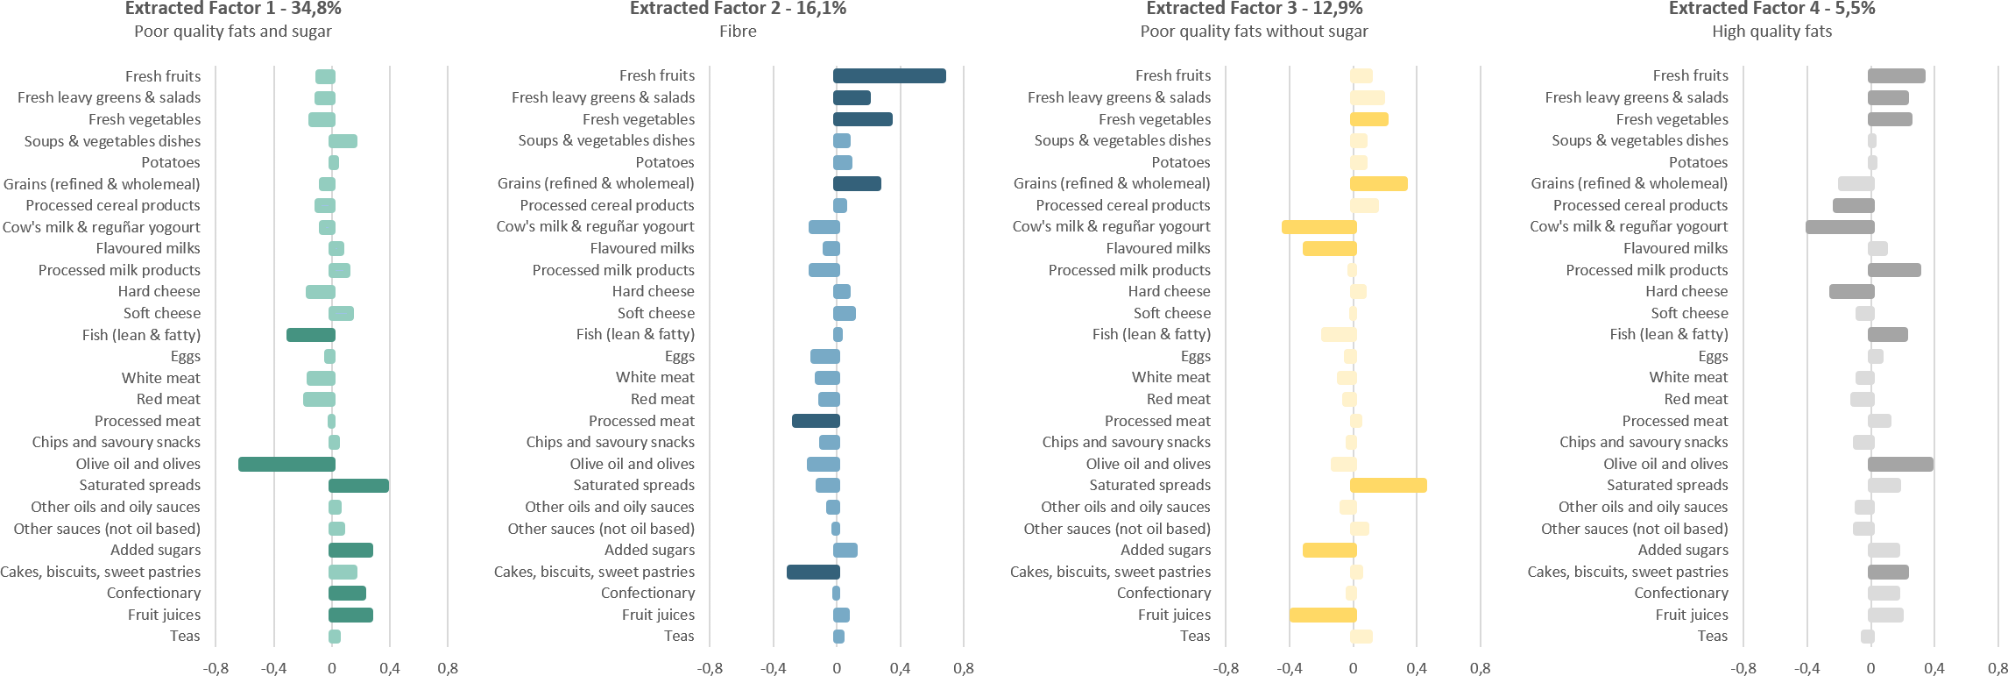
Major factors were extracted using RRR analyses, as previously described by Hoffmann et al. [26]. The 27 food groups (g/day) were considered as predictor variables, and low-quality fats, healthy fats, fibre and total sugars (g/total daily energy intake [kcal]) were selected as response variables based on evidence of a relationship with metabolic and cardiovascular problems both in childhood and adulthood. Low-quality fats were defined as fats from meat, eggs, milk, saturated spreads, processed products, cakes and confectionary; healthy fats were defined as fats from olive oil, nuts and fish.
Four extracted factors were obtained in accordance with the number of response variables included. Factor loadings were also obtained to quantify the contribution of each food group to the extracted factors. Food groups with a factor loading of 0.2 or higher were considered as significant for interpreting and labelling the extracted factor.
In a first step we explored the extracted factors obtained at all ages (2 to 8 years) to confirm the consistency of the patterns. The extracted factors obtained at 4 years were the most independent of each other and explained the greatest variability in intake. To track predictor scores for exactly the same extracted factor from 2 to 8 years, we use the scoring coefficients produced by the 4-year analysis for both 2 and 8 years. In this way, adherence to the 4 extracted factors was fully comparable at both 2 and 8 years of age. Each participant received a z-score quantifying their adherence to each extracted factor at both 2 and 8 years.
Since the quality of the diet for each participant depended on combinations of four different factor z-scores, we grouped the subjects using cluster analyses. This approach allows for a simplified and clearer interpretation of diet quality in each participant, following the methodology proposed by Shang, X [27]. This clustering procedure used Ward’s method with squared Euclidean distances in a hierarchical cluster analysis to categorize subjects into two distinct clusters, each representing a dietary pattern group (DP).
Differences between dietary patterns (DP) and nutrient intakes adjusted for energy were analysed using the Mann–Whitney U test. Linear regression models were applied to assess the association between these two DP groups, identified through cluster analyses, and the main outcome measures (BMI z-score, triglycerides, HDL cholesterol, HOMA-IR, systolic and diastolic blood pressure and Cmet Risk score) at 8 years of age. Two regression models were constructed: the first model included DP groups at age 8 years, and the second model included DP groups at age 2 years. Additionally, children were classified into groups based on their consistency in remaining within the same dietary pattern (DP) cluster across different time points.
The association of persistent dietary patterns with cardiometabolic health markers was analysed using linear regression model.
Logistic regression analyses were conducted to examine the relationship between classification into different dietary pattern groups and the presence of altered values in triglycerides, HDL cholesterol and HOMA-IR at ages 2 and 8 years, in both cross-sectional and prospective analyses.
In all the linear and logistic regression models, dietary pattern group was introduced as the main predictor using the enter method, while other covariates were included using the step forward method. All models were adjusted for the following possible confounders: sex, country of origin, maternal education level, maternal smoking during pregnancy, maternal BMI, feeding during the first year of life, mean energy intake at 8 years and BMI z-score at 8 years (not included as covariate in models with BMI or cardiovascular risk score as outcome).
Statistical significance was accepted at the level p < 0.05. The statistical analyses were performed using SPSS (Statistical Package for the Social Sciences) version 29.0 (IBM Corp., Armonk, NY, USA) and SAS version 9.4 (SAS Institute Inc., Cary, NC, USA).


留言 (0)