Study design and population
We used data from the Danish Health Examination Survey (DANHES) 2007–2008 [14]. DANHES was conducted in 13 of 98 municipalities in Denmark, where all citizens aged ≥ 18 years were invited to complete a questionnaire concerning social factors, lifestyle, and general health (n = 538,497). A random sub-sample was also invited to fill out a supplementary food frequency questionnaire (FFQ) and to participate in a general health examination (n = 180,103). Out of the sub-sample of 180,103 individuals, 47,682 completed the FFQ, and 18,065 participated in the health examination.
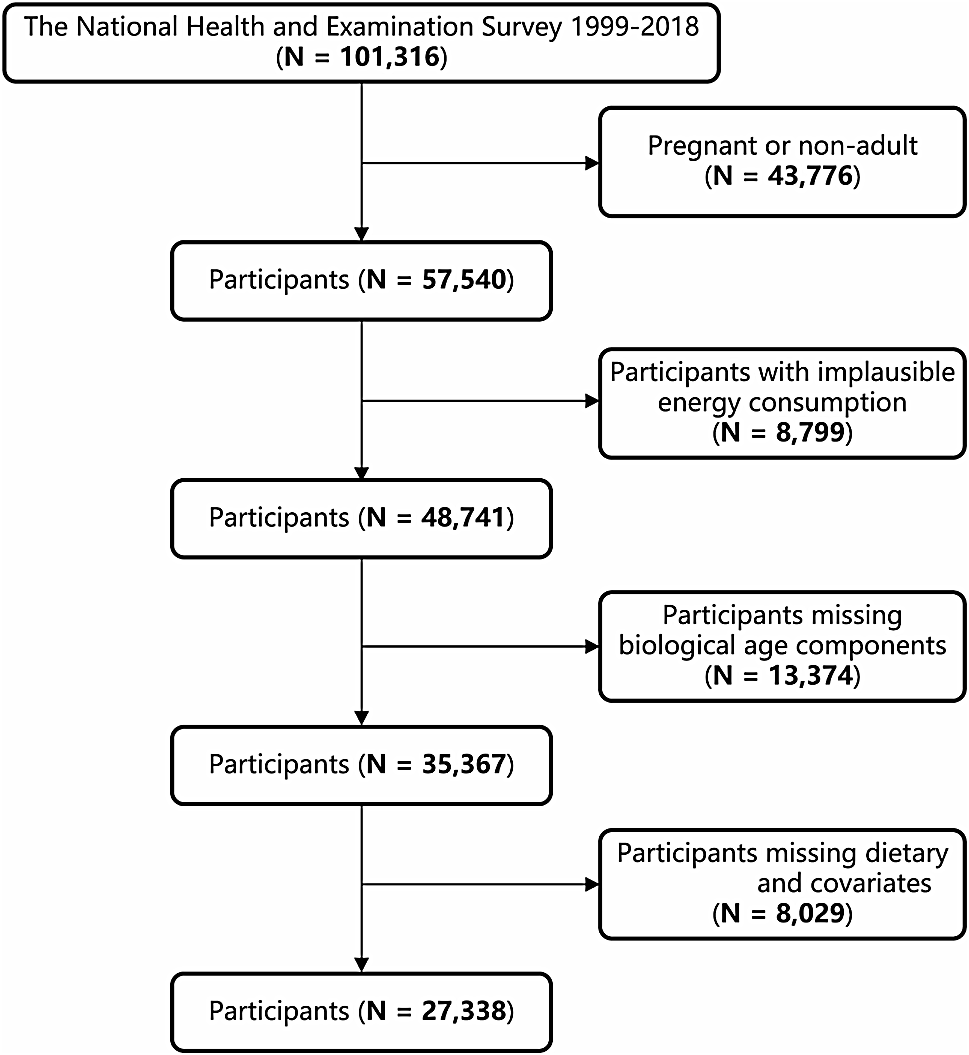
The main study population included individuals who completed the FFQ. We excluded individuals with implausible daily calorie intake (< 800 kcal or > 4200 for males and < 600 kcal or > 3500 for females) (n = 2,956) and individuals with a known diagnosis of diabetes (n = 1,890) from the study population. Therefore, the final study population consisted of 42,836 individuals (26,668 females and 16,168 males). Participants in the health examination were included in the present paper to study the cross-sectional associations between dietary intake of different types of sugar and cardiometabolic risk factors. The number of participants with measured cardiometabolic risk factors was 12,977 (7,858 females and 5,119 males) (Supplemental Fig. 1).
Assessment of diet
A self-administered validated semi-quantitative FFQ, incorporating food frequency and portion sizes through photographs of food items, was used to assess dietary intake based on the intake over the previous year [15, 16]. The original questionnaire comprises 92 food items and 40 portion-size photographs and was validated against two times seven-day weighted diet records in 144 middle-aged subjects from the general population in Copenhagen. Pearson correlation coefficients for energy-adjusted nutrient intake were 0.40 (men) and 0.47 (women) for carbohydrates, 0.50 (men) and 0.41 (women) for sucrose, and 0.39 (men) and 0.53 (women) for dietary fiber [15].
In the DANHES the questionnaire was slightly modified for online administration, and very few food items were omitted. The FoodCalc® program was used to calculate the total energy intake (kcal/day), consumption of food groups (g/day), and nutrients (g/day) using food composition tables. Specifically, the following nutrients were included as exposure variables: total carbohydrates, fiber, starch, total sugar, glucose, fructose, lactose, maltose, and added sugar. The daily intake of each exposure variable was divided into energy-adjusted quintiles by sex using the residual method [17], as the correlations between energy intake and individual nutrient intakes differ between females and males.
The food groups that are major contributors to the intakes of total sugars include sweet products, fruits and vegetables, beverages, and dairy products [18,19,20]. Yogurt and milk were considered sugar sources given the wide range of flavoured options in the supermarkets. Dairy consumption (g/day) did not include ice cream and cheese consumption. Total juice intake was calculated based on the sum of orange/grape, apple, carrot, and tomato/other vegetable juice intake from the FFQ. Total SSBs consumption was the sum of sugar-sweetened soda and diluting juice beverages. Total ASBs consumption includes the sum of light soda and diluting juice beverages. A standard conversion of 200 mL/glass was used to translate portions to milliliters.
Assessment of diabetes
Linkage of participants to the Danish National Diabetes Register, where information on diabetes events during follow-up was obtained, was possible via the unique personal identification number assigned to all citizens in Denmark (follow-up end: December 29, 2012). The registry uses five diagnostic criteria: 1) hospitalization with a diagnosis of diabetes according to the International Classification of Diseases (ICD) 8th or 10th Revisions (ICD-8 codes 249 or 250; ICD-10 codes E10-14, H36.0, or O24 [excluding O24.4]) obtained from the Danish National Patient Registry; 2) registration of chiropody (coded for diabetes) in the Danish National Health Service Register; 3) registration in the Danish National Health Service Register with measurement of blood glucose five or more times within 365 days; 4) two or more annual measurements of glucose during 5 years; and 5) registration in the Danish National Prescription Registry with a prescription of insulin or oral glucose-lowering medication on at least two occasions. If one of these criteria is met, an individual is registered as having diabetes. The register does not distinguish between type 1 and type 2 diabetes.
Participants in DANHES completed questionnaires including sociodemographic information. Information on age and sex was obtained from the Danish Civil Registration System. The following covariates were included: age, sex, body mass index (BMI), total energy intake, smoking status, alcohol consumption, leisure-time physical activity, menopause, family history of diabetes, length of education, hypertension, and dietary factors. Data on self-reported health were obtained from the DANHES-questionnaire, where participants were asked to rate their overall health on a scale of 1 to 10, with 10 being the best possible level of health. All covariates, except for age and sex, were self-reported in the DANHES.
Assessment of cardiometabolic risk factors
Biochemical analysis from non-fasting blood, blood pressure, anthropometric measurements, and aerobic fitness test (Watt-max bike test) were performed by the staff members. Clinical measurements were performed by trained technical health personnel following standard protocols. Detailed information can be found elsewhere [14].
Statistical analyses
Participants were followed from baseline (participation in the DANHES 2007/2008) until the diagnosis of diabetes (n = 970), emigration (n = 301), death (n = 529), or December 29, 2012, whichever occurred first. Cox proportional hazards regression with age as the underlying time scale was used to estimate the risk of diabetes by quintiles of energy-adjusted intake of exposure variables by sex. The reference category was the lowest quintile of energy-adjusted intake. We conducted the Cox proportional hazard models stratified by sex and adjusted for several confounders. Model 1 was adjusted for age. Model 2 was further adjusted for BMI, total energy intake, smoking status, alcohol consumption, physical activity, menopause, family history of diabetes, length of education, and hypertension. Model 3 was further adjusted for the ratio of polyunsaturated fat to saturated fat, trans-fat, and magnesium. The model in which fiber intake is the exposure was additionally adjusted for total sugar intake. The model for starch intake was additionally adjusted for fiber, weekly intake of SSB, and intake of fruits and vegetables. The models for total sugar, fructose, and added sugar were additionally adjusted for fiber. Models for glucose, fructose, lactose, and maltose were mutually adjusted. Tests for linear trends were conducted using quintiles of dietary intake as continuous variables.
To overcome possible reverse causation (individuals with pre-diabetes may have changed their diet), we excluded the first two years of risk time from the analyses. To investigate the non-linear relationship between exposure and the risk of diabetes, analyses were repeated modeling energy-adjusted dietary intake continuously using cubic splines by sex. A restricted cubic spline model with 4 knots was fitted. For each nutrient, the median energy-adjusted intake in the lowest quintile was used as a reference. To minimize the influence of outliers, we excluded participants with total carbohydrate intake below the 1st percentile and those with an energy-adjusted intake of other nutrients below 0 g/day, as well as participants with nutrient intakes above the 99th percentile for all nutrients. We conducted also stratified analyses by age, BMI, hypertension, fiber intake (< median (24.7 g/day) and ≥ median), smoking status, alcohol intake, family history of diabetes, and physical activity, using energy-adjusted nutrient intake values stratified by sex and accounting for a specific daily increase in the consumption of each nutrient. The multiplicative interaction was tested between fructose and glucose (quintiles of energy-adjusted intake by sex) and physical activity (vigorous, moderate, light, sedentary) by a likelihood-ratio test of the multivariable-adjusted model with and without the cross-product interaction term by sex.
Multiple linear regression analyses were used to assess the associations between carbohydrate and sugar intake and cardiometabolic risk factors. Cardiometabolic risk factors that were not normally distributed were logarithmically transformed (systolic blood pressure (SBP), diastolic blood pressure (DBP), total cholesterol, TG, and HbA1c). The means of each cardiometabolic risk factor by sex-specific quintiles of energy-adjusted intake of the exposure variables were calculated as geometric means, along with 95% CI. Model 3 was used as the model of adjustment for all linear regression models. Tests for trends were conducted using quintiles of energy-adjusted intake as continuous variables in the regression models. The significance level was set to a p-value of 0.05 (two-sided). We did not calculate corrected p-values for multiple comparisons, as our focus was on patterns of changes in cardiometabolic factors rather than on individual p-values for significance. Analyses were performed using STATA Software version 18.


留言 (0)