Population
Subjects were participants aged 16 and over from the cross-sectional “Kannari survey: Health, Nutrition and Exposure to Chlordecone in French West Indies” conducted among Guadeloupean and Martinican adults and children by Santé Publique France (the French public health agency) in 2013–2014, and described elsewhere [16]. Briefly, the Kannari survey was based on a multistage stratified random sample of the Guadeloupean and Martinican populations to describe chlordecone food exposition and impregnation, health status and food intakes in these populations. Sample selection was based on a three-stage cluster design (geographic areas, household and individuals in the household), stratified by chlordecone contamination areas (coastline and inland).
The Kannari survey was conducted according to the Declaration of Helsinki guidelines, and the survey protocol received approval from the ethical research committee for South-West and Overseas II (Comité de protection des personnes Sud-Ouest et Outre-mer II, CPP No. 2–13-10) and the French Data Protection Authority (Commission Nationale Informatique et Libertés No. 913236). Informed consent was obtained from all the subjects.
Data collection
Standardized questionnaires collecting demographic and socioeconomic information and a food frequency questionnaire (FFQ) were administered in face-to-face interviews at home. Anthropometric data were collected by home measurement. Dietary intake data were collected by two non-consecutive 24-h recalls by trained phone interviewers. A physical activity questionnaire [23] was also administered, only to individuals from Martinique.
Sociodemographic and economic characteristics
The demographic information collected were the gender, the age, the location (Guadeloupe or Martinique), the urban size (< 10 000 or ≥ 10 000 inhabitants), single-parent household, presence or not of at least one child in the household, and the marital status (single or living in couple). Individuals were categorized into 4 age groups: < 30y; [30y;49y]; [50y;64y] and ≥ 65y. The socioeconomic characteristics were the occupational category (i.e. self-employed, managerial staff, intermediate profession, employee, manual worker, never-employed, based on the six categories used by the French National Institute of Statistics and Economic Studies (INSEE) [24]), the level of education, being whether or not a recipient of social assistance. The level of education was based on the highest qualification attained and categorized as low (no or primary school), middle (below high school), and high (equivalent to or higher than high school).
Dietary data
Dietary data were collected using two non-consecutive 24 h dietary recalls. Participants were asked to describe in detail their food intake (including composition of homemade recipes) and amount consumed during the 24 h preceding the interview. Portion sizes were estimated using standard measurements (e.g. home containers, grams indicated on the package) or a validated illustrated booklet representing more than 250 foods specific to the French West Indies (corresponding to 1000 generic foods) served in seven different portion sizes. The two recall days were randomly assigned, balancing the distribution between weekdays and weekend days across the sample of individuals. To correct the over-representation of weekend days, a weighting factor was applied for food intake, accounting for the type of day.
In addition to 24 h dietary recalls, participants completed a qualitative food frequency questionnaire (FFQ). The FFQ covered the last twelve months and asked the respondent the frequency of consumption of 115 food items, among nine frequencies: « Never», « Less than 1/month», « 1/month», « 2–3/month», « 1/week», « 2–3/week», « 4–5/week», « 1/day», « More than 1/day». As one aim of the Kannari study was to describe chlordecone food exposure and impregnation, the FFQ specifically included food groups contributing to chlordecone exposure such as specific seafoods. More details about the methods of food intake data collection used in the Kannari survey have been published elsewhere [16].
All foods declared in the 24 h dietary recalls (n = 1 357) were categorized into 9 food groups and 29 sub-groups, and were assigned to one of the 115 items of the FFQ. For 248 foods (mainly spices, sauces and composite dishes), it was not possible to match them with any of the 115 items, and they were therefore excluded from the analyses.
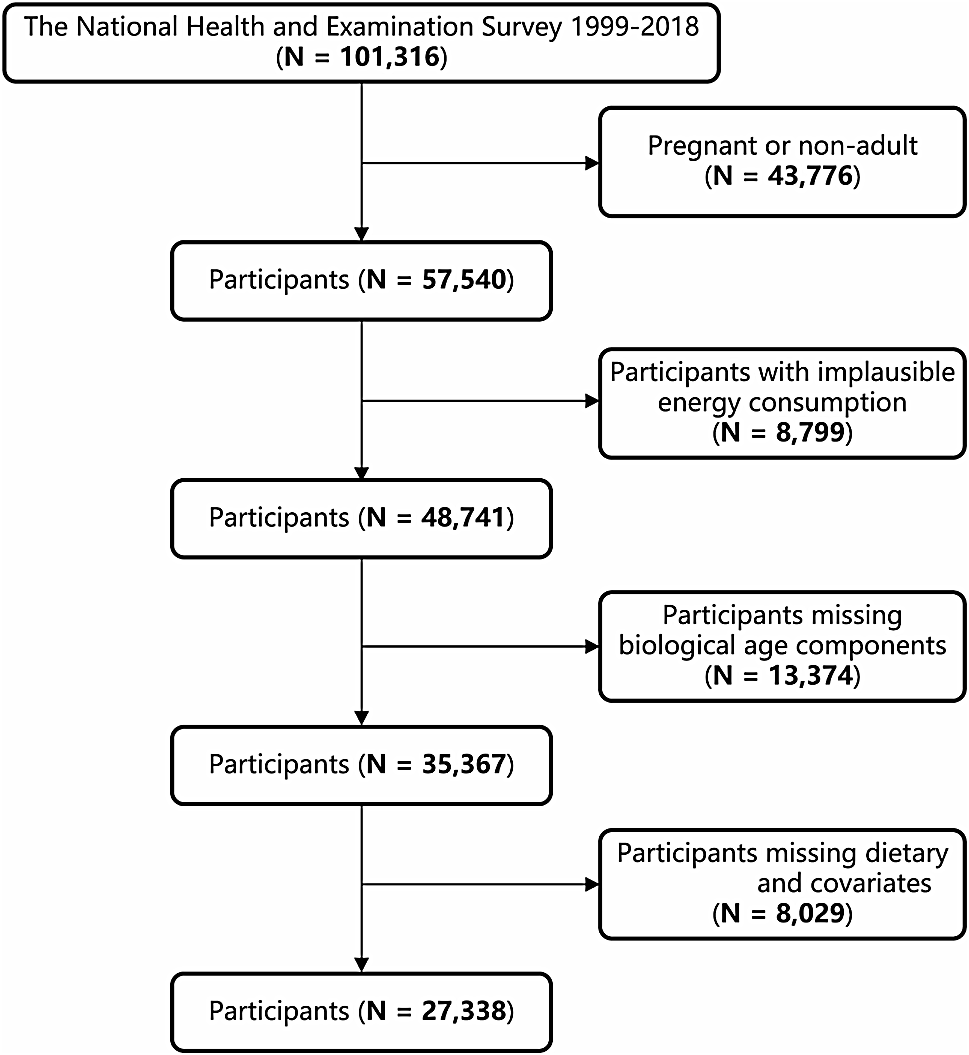
Energy under-reporters – i.e. individuals with a declared energy intake below their minimum energy requirement – were identified by the method proposed by Black et al. [25], based on the basal metabolic rate (BMR) estimated using Mifflin equations since a high prevalence of overweight and obesity was observed in our study sample. For Martinicans, the level of physical activity was collected in the Kannari survey and identified as low, moderate or high. The physical activity level has been imputed for Guadeloupean individuals, using the method Random Forest of the R package missForest, based on the age, gender, the body mass index (BMI), the occupational category, the level of education, being whether or not a recipient of social assistance, having children in the household, single-parent household, the marital status and the urban size. All energy under-reporters were excluded from the analyses, leading to a final sample of 1 112 individuals.
Even after removing individuals identified as under-reporters, previous studies on the Kannari survey revealed that the average observed energy intake among adults was very low (1584 kcal/d [13]). This could be explained by a high prevalence of overweight and obesity in the French West Indies adult population, since overweight and obese individuals are generally recognized to highly under-report their intakes [26]. Because a minimal energy intake is necessary to fulfill the nutritional recommendations, food intakes were fit to an energy need corresponding to a healthy weight (i.e. the weight required to attain a BMI between 18.5 and 25). This was done to avoid that optimization models could not be solved only because of too low energy intake. The methodology used to adjust food intakes is detailed in Additional File “Supplemental Methods”. All following analyses were done on the adjusted amount of foods, subsequently referred to as “initial diet”.
Estimation of nutritional content of diets
The energy, macronutrient, and micronutrient content of diets were estimated using the nutritional food composition table of the Nutrinet-Santé study [27] supplemented with dishes, foods and beverages consumed in the French West Indies. A nutritional food composition table has also been estimated for the items of the FFQ. The nutritional composition of each FFQ food item was the mean of the nutritional content of its related foods, weighted by food intakes according to the gender and location (Martinique or Guadeloupe).
Estimation of diet monetary cost
The monetary cost of diets was estimated based on a food price database specifically developed for the study. The prices of 10,820 food products were collected in June 2019 from the website of a supermarket located in Martinique and matched with the list of 1357 foods declared to be consumed by adults ≥ 16 y of the Kannari survey included in the analysis in order to estimate a mean price for the 1357 foods. In the case of dishes (composed of multiple ingredients) that could not be matched with a food product, prices were estimated based on ingredient proportions from recipes either provided with the Kannari survey, or from recipes compiled for the present study. Ingredients constituting the dish were matched with food products from the supermarket website to estimate their price. The price of the dish was then estimated based on the prices and proportions of its ingredients.
We used conversion factors for the 1357 foods to convert the quantity of the food product "as purchased" into a quantity "as consumed", accounting for changes in weight associated with preparation and waste (e.g. peeling, boning, water gain during cooking, etc.).
The ‘initial diet cost’ refers to what individuals would pay for their diet based on their initial dietary intake and considering they bought each food item at its mean price.
Diet optimization
Mathematically, an optimization model aims to find the unique combination of values for decision variables that generates the optimal value for one objective function, while fulfilling a set of equalities or inequalities, called constraints [21]. In the present study, a diet optimization approach was designed, for each individual of the sample, to identify the best combination of quantity of foods (i.e. the decision variables) at the target energy requirement that met a set of 31 nutritional recommendations and food consumption constraints (i.e. the constraints), while departing the least from the individual initial diet (i.e. the objective function), with or without constraint on the monetary cost of the diet. Different cost constraint scenarios were tested and described below.
Scenarios
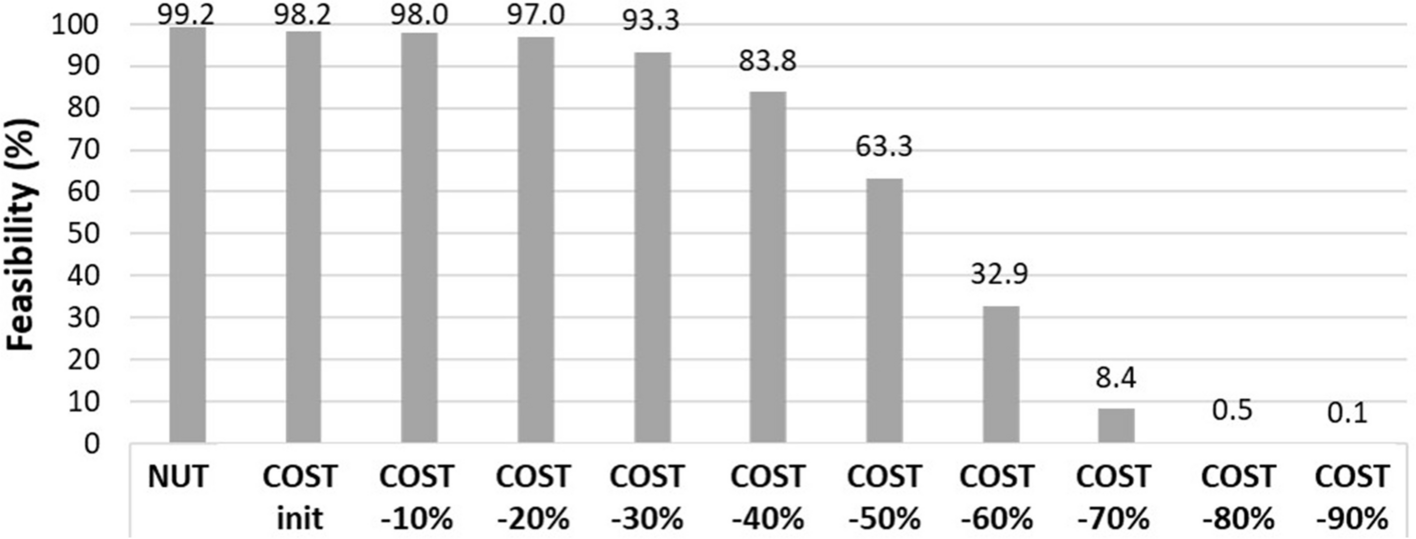
A first scenario (NUT) was run with no cost constraint to identify whether reaching nutritional adequacy while being as close as possible to the initial diet would induce an increase in the monetary cost of the diet. A second scenario (COSTinit) was similar to NUT, except for the addition of a constraint preventing total diet cost from increasing (i.e., the cost of each optimized diet was not allowed to exceed that of the initial diet). Then, several scenarios (COST-X%) were run at increasingly stringent levels of cost constraint to decrease the monetary cost of the diet by 10% steps from the initial diet cost. For each scenario, one diet optimization model was run for each individual of the sample.
Decision variables
For each individual, the decision variables were the foods declared by the individual in the two 24 h recalls (referred to as “repertoire foods”), and the 115 items of the FFQ (referred to as “additional items”) that could be added by the model when “repertoire foods” were not sufficient to fulfill the set of constraints. Foods composing the item “butter-oil-vegetable fat” were kept as “additional items” decision variables in order to let the model adding specific oils, rich in essential fatty acids. Fortified items (n = 3) were excluded from the list of “additional items” to avoid diet optimization model to rely on fortified items to reach nutritional recommendations. Items related to alcoholic drinks (n = 3) as well as low-calories drinks (< 4 kcal/100 g) except tap water (n = 4) were also excluded from “additional items” to favor the addition of tap water as the main source of water.
Nutritional constraints
Each scenario imposed to reach the nutritional recommended values for macronutrients, fatty acids, 10 vitamins (B1, B2, B3, B5, B6, B9, B12, C, D and E), 10 minerals (calcium, copper, iron, iodine, magnesium, manganese, phosphorus, selenium, sodium, zinc), free sugars and fiber as described in Table 1. Energy content of the diet (including alcoholic drinks) was constrained to reach ± 1% of the target energy requirement. The nutritional content of the diet was estimated without considering alcoholic drinks. In addition, to limit the exposure to food contaminants, the fish content was limited to 220 g/week (2 portions per week) as recommended by the French agency for food, environmental and occupational health & safety (ANSES) [28, 29].
Table 1 Nutritional constraintsFood consumption constraints
To avoid unrealistic optimized diets, maximal values were imposed on decision variables and food groups. For each decision variable, the maximal value (g/d) was the 95th percentile of the observed food intake calculated among consumers only, estimated by gender and location (Martinique or Guadeloupe). For foods and drinks excluded from the “additional items” list (alcoholic drinks, fortified foods, water in bottle or low-calorie drinks), maximal values were set to the initial intake to prevent the model from finding nutrients in foods or drinks that are not their natural source. Maximal values were also imposed on each food group and sub-group as the 95th percentile of the observed food intake calculated among all individuals, by gender and location.
Constraint on the monetary cost of the diet (in COSTinit and COST-X% scenarios)
For each individual, a scenario was run that constrained the monetary cost of the optimized diet to not exceed that of the initial diet (COSTinit). In COST-X% scenarios, the monetary cost of diets was imposed to decrease progressively by 10% steps from the initial monetary cost, until reaching infeasibility. The monetary cost of the diet included for the cost of alcoholic drinks. The COST-X% scenario which achieved the highest cost reduction while maintaining a percentage of feasibility higher than 90% was selected for a more detailed description of the results.
Objective function
In all scenarios and for each individual, the objective function (Eq. 1) aimed to minimize the sum of deviations from the individual’s initial food intakes by:
Favoring deviations among the “repertoire foods” instead of the addition of “additional items”,
Adding “additional items” only when needed, using weighing factor to penalize their introduction according to the frequency of consumption declared in the FFQ
$$Min _= \sum_^}|_|+\sum_^ }\frac_^*_^}_^}$$
(1)
With:
\(_\), the objective function for the individual i,
\(_=\frac_^-_^}_^}\), the positive or negative deviation of the “repertoire food” j and individual i in percentage of the initial food intake,
\(_^\), the initial intake of food j by individual i,
\(_^\), the optimized amount of food j for individual i,
\(^\), the “repertoire foods” of individual i,
\(_^\), the median intake of the “additional item” k in the gender-location sub-population of individual i (excluding non-consumers of the additional item from the calculation),
\(_^\), the optimized amount of the “additional item” k by individual i,
\(_^\), the weighting factor of the “additional item” k and individual i, estimated according to the frequency of consumption declared by the individual i in the FFQ, as detailed in Additional File “Supplemental Table 1”.
Statistical analyses
For each scenario, the percentage of feasibility (i.e. percentage of individuals among the sample for which it was possible to respect the full set of constraints with the decision variables) has been estimated.
In the NUT scenario, the percentage of individuals for whom the monetary cost of the diet increased compared to initial diet cost has been calculated.
Among the monetary cost reduction scenarios (COST-X%), the scenario with the strongest cost reduction and a percentage of feasibility higher than 90% was selected for further analysis. The following analyses were conducted only among individuals with optimized diets that were feasible with both COSTinit and the selected COST-X% scenario. The average food group and sub-group amounts in the initial and optimized diets were estimated among the whole sample and by age group (< 30y; [30y;49y]; [50y;64y] and ≥ 65y) since a previous study highlighted a marked generational contrast among the dietary patterns coexisting in the French West Indies [13]. In both scenarios, paired t-tests by food group and sub-group were done to assess: i) in the whole sample and for each age group, whether the variations between the optimized and initial amounts were different from 0, ii) whether the variations between the optimized and initial amounts were different between age groups after adjustment for initial energy intake, gender, level of education, being recipients of social assistance benefits, employment status, presence of children in the household, body mass index and location, and iii) in the whole sample and for each age group, whether the variations between the optimized COSTinit and COST-X% amounts were different from 0.
All values were survey-weighted, and the statistical analyses accounted for the Kannari survey sampling frame design. The Operational Research and the STAT packages of SAS version 9.4 (SAS Institute, Cary, NC, USA) were used to run linear programming models and perform statistical analysis, respectively. An alpha level of 5% was used for all statistical tests.


留言 (0)