
記住我

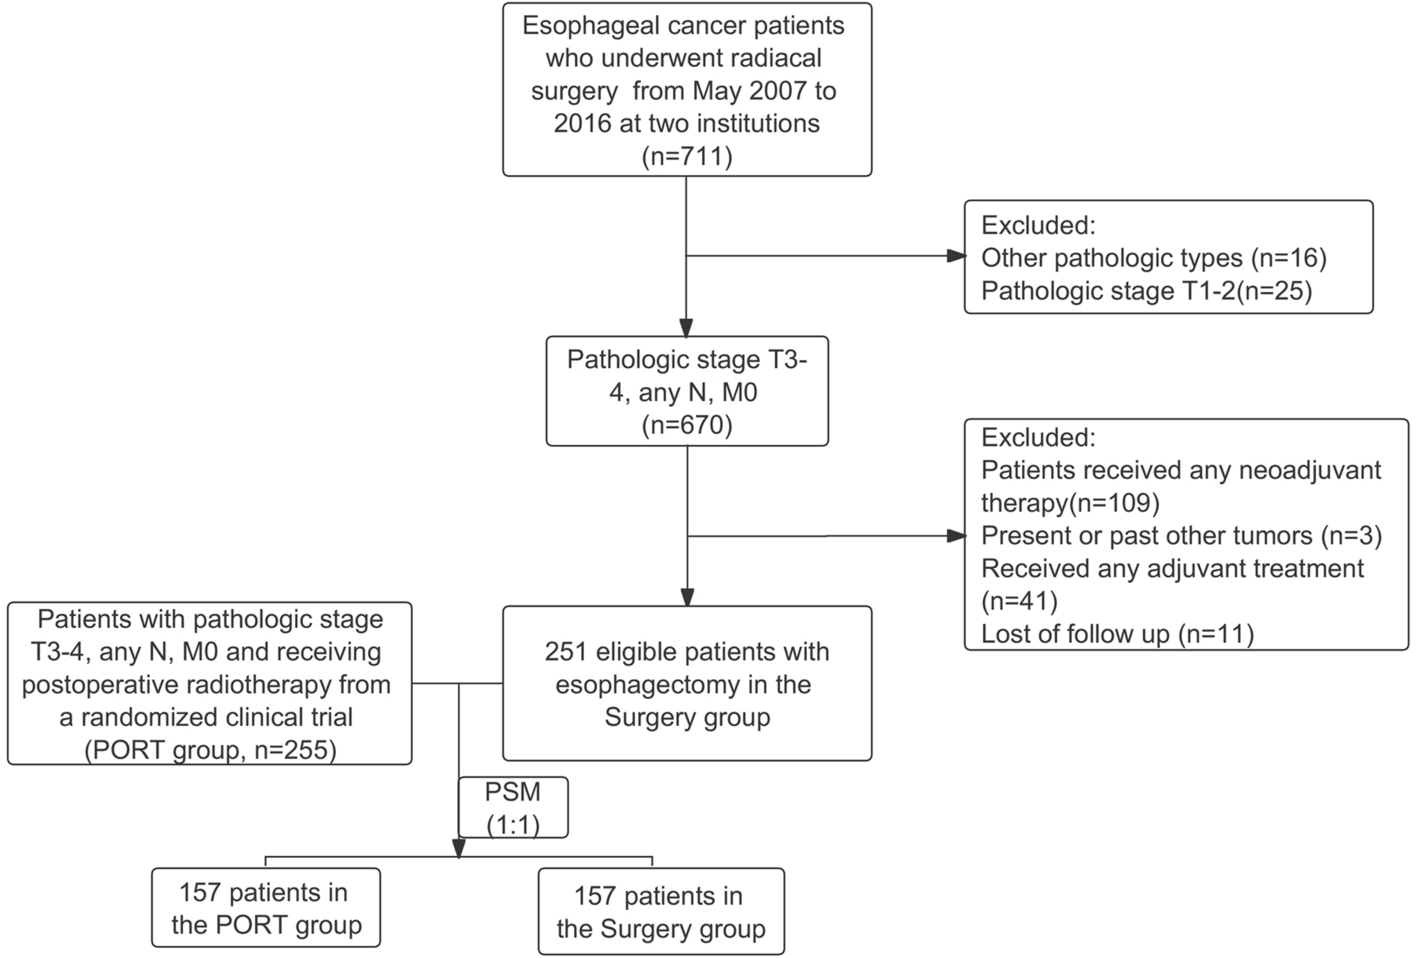

This study included a total of 506 patients. Among them, 255 patients underwent postoperative adjuvant radiotherapy with or without chemotherapy (PORT group), while 251 patients underwent radical surgery alone (surgery group). A significant majority, 94.9% of patients, presented with stage T3 disease. Notably, 13.4% of patients underwent three-field lymph node dissection. It's worth mentioning that patients who underwent three-field lymph node dissection were less likely to receive postoperative radiotherapy (surgery vs. PORT, 21.1% vs. 5.9%; p < 0.001). Furthermore, the PORT group had a higher proportion of patients with lower third thoracic diseases compared to the surgery group (60.8% vs. 38.6%; p < 0.001). Patients with stage N2 or N3 disease were also more inclined to receive adjuvant radiotherapy (surgery vs. PORT, 8.0% vs. 31.4%; p < 0.001). Surprisingly, almost half of the patients with locally advanced ESCC, specifically 49.2%, did not undergo adjuvant chemotherapy. A summary of the baseline characteristics of the study population is presented in Table 1.
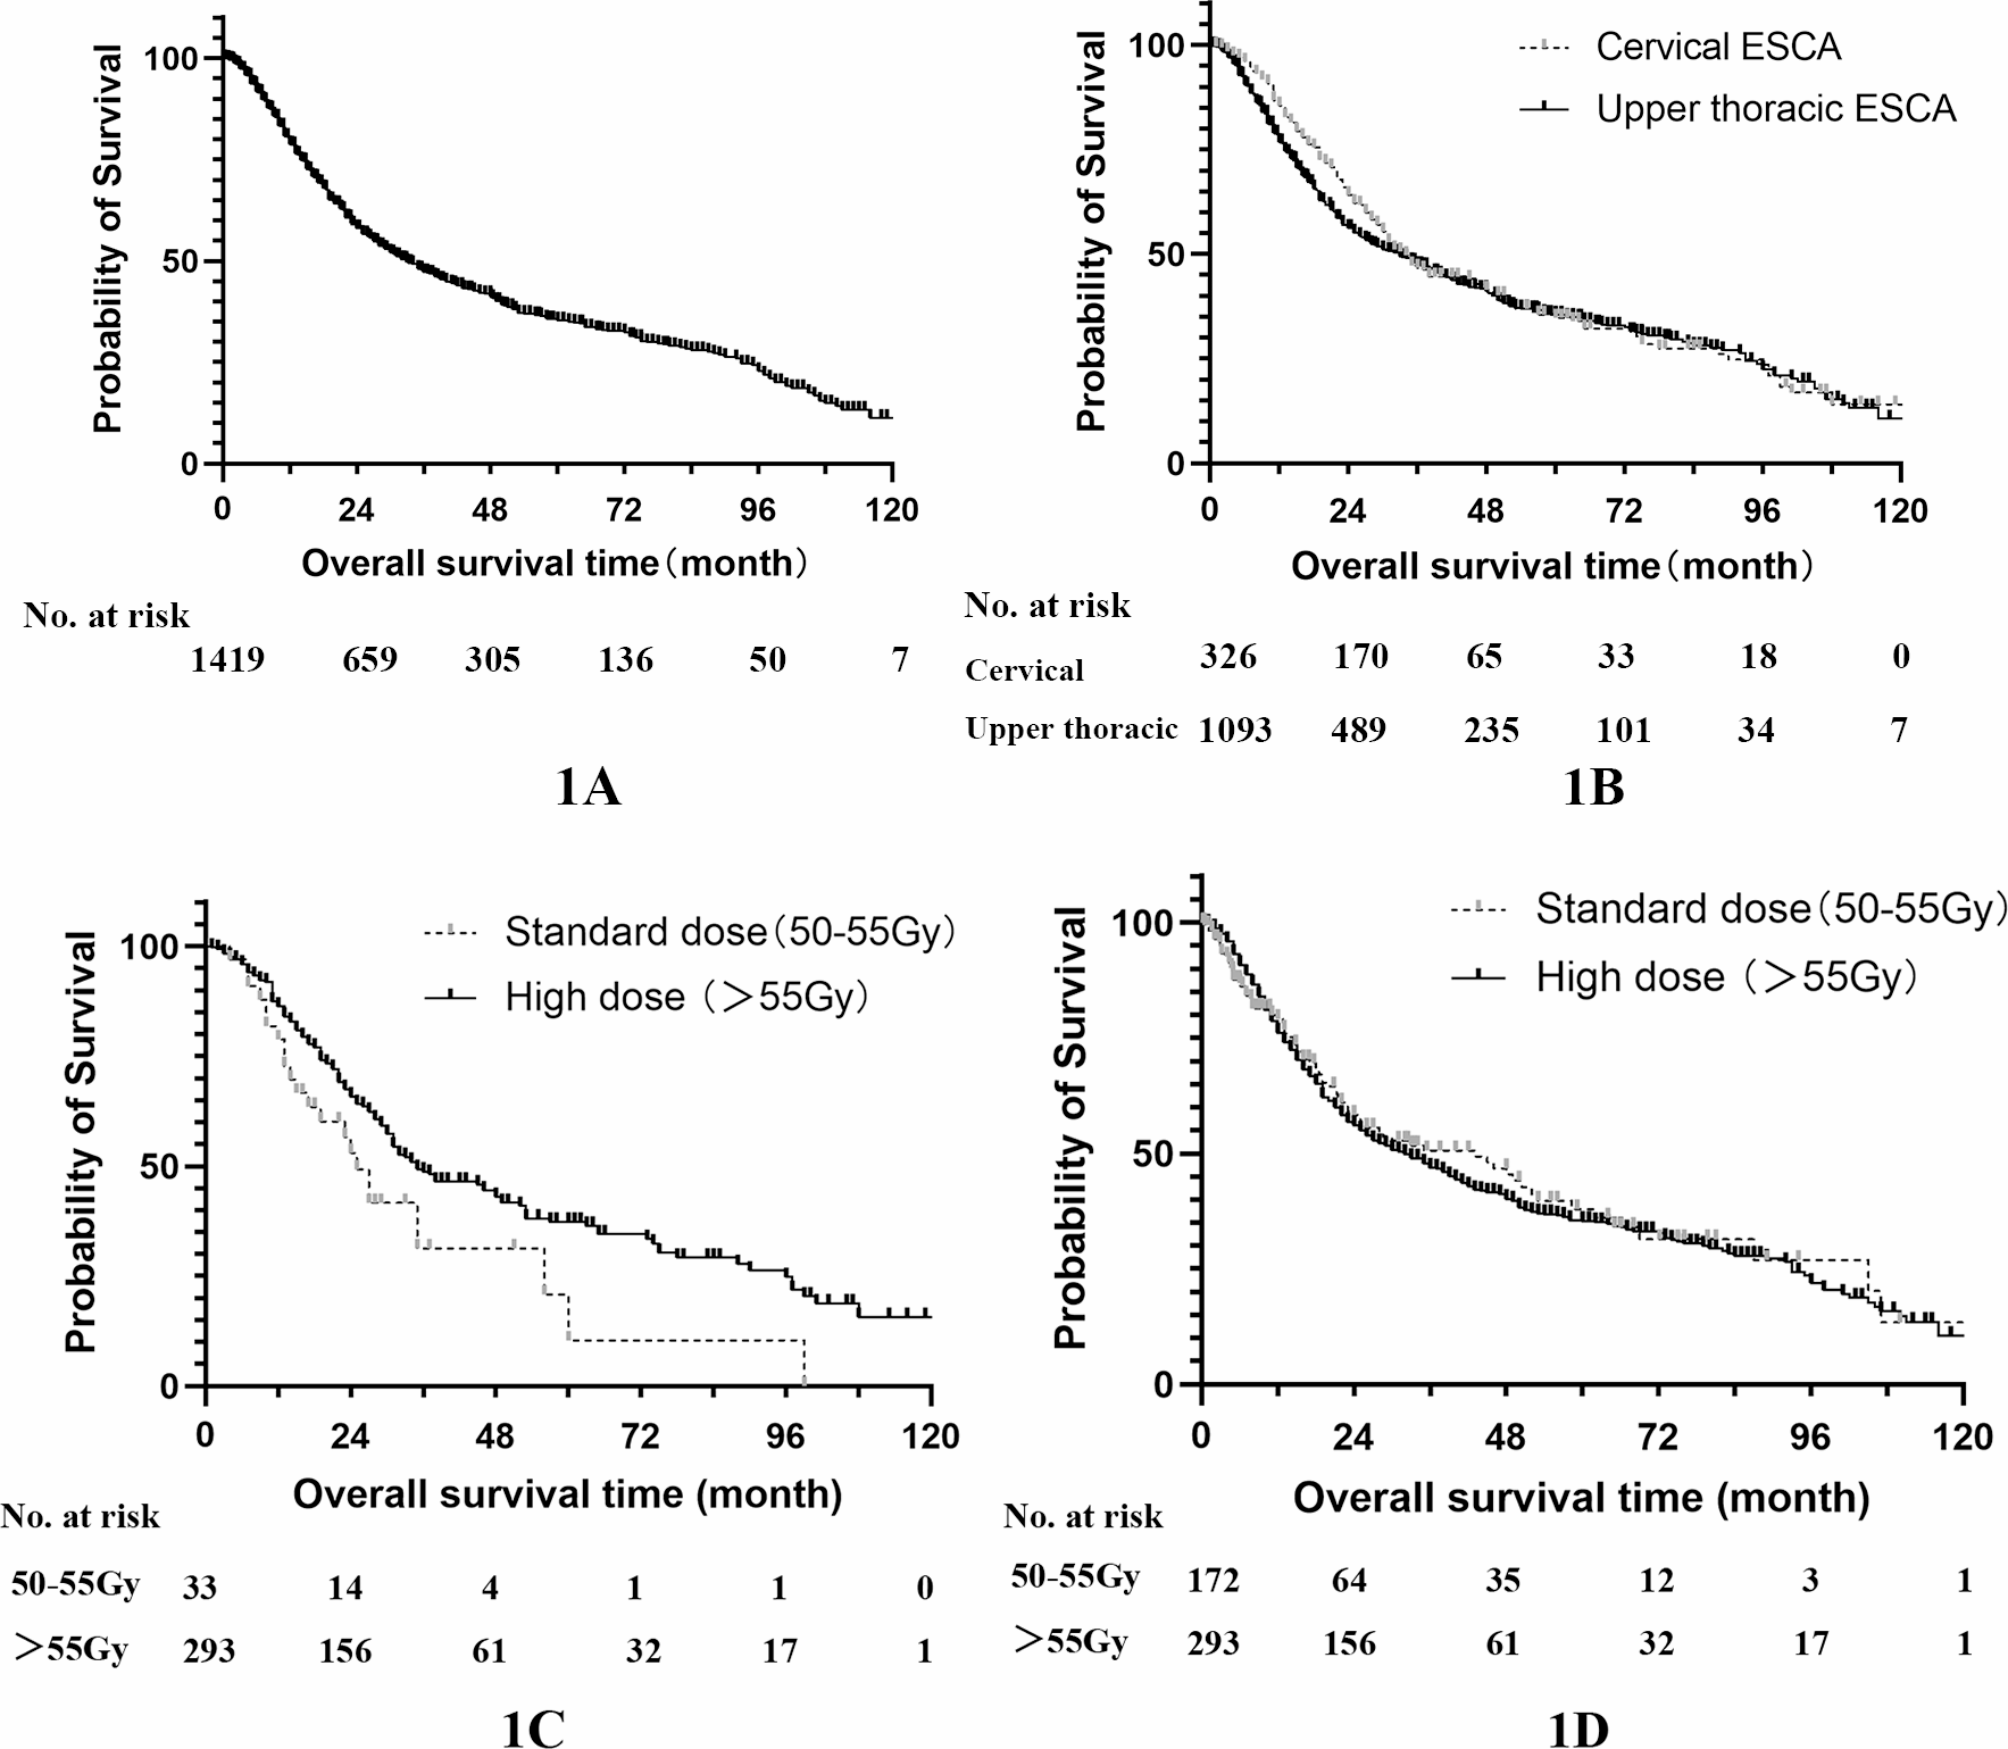
Table 1 Baseline characteristicsSurvival outcomes and prognostic factorsWith a median follow-up duration of 49.1 months (95%CI, 50.6–61.8) for the surviving patients, the 3-year and 5-year DFS rates for patients in the PORT group were 49.8% and 45.3%, respectively, in contrast to 12.3% and 8.5% for patients who did not receive adjuvant radiotherapy. Those who underwent postoperative radiotherapy exhibited significantly prolonged DFS compared to those who underwent surgery alone, with a median DFS of 35.8 months versus 8.0 months (HR, 0.36; 95%CI, 0.29–0.44; p < 0.001; as illustrated in Fig. 2A). The 3-year and 5-year OS rates were 64.8% and 53.8% for patients in the PORT group, while in the surgery group, these rates were 35.2% and 25.3%, respectively. Importantly, PORT demonstrated a significant improvement in OS compared to surgery alone for locally advanced TESCC, with a median OS of 74.6 months versus 21.3 months (HR, 0.41; 95%CI, 0.33–0.52; p < 0.001; Fig. 2B).
Fig. 2
Survival outcomes of the entire population. A Disease-free survival; B overall survival. PORT, postoperative radiotherapy; HR, hazard ratio; CI, confidence Interval; No, number
In the univariable analyses, DFS exhibited associations with primary tumor location, the number of dissected lymph nodes, T stage, and PORT. Meanwhile, OS displayed correlations with gender, age, tumor differentiation, the number of dissected lymph nodes, T stage, N stage, and PORT.
The multivariable analyses revealed that stage T3 (HR, 0.55; 95%CI, 0.36–0.84; p = 0.01) and PORT (HR, 0.34; 95%CI, 0.27–0.43; p < 0.001) were associated with prolonged DFS. Furthermore, female patients (HR, 1.78; 95%CI, 1.16–2.72; p = 0.009), well-differentiated tumors (HR, 0.49; 95%CI, 0.28–0.88; p = 0.02), dissected lymph nodes exceeding 21 (HR, 1.30; 95%CI, 1.02–1.65; p = 0.03)), stage T3 (HR, 0.44; 95%CI, 0.28–0.70; p < 0.001), N0-1 (HR, 0.38; 95%CI, 0.27–0.53; p < 0.001), and PORT (HR, 0.32; 95%CI, 0.24–0.42; p < 0.001) were identified as independent favorable prognostic factors for OS (see additional file-Table s1).
In the PSM cohort, the well-matched population confirmed the survival findings. The PORT group exhibited 3-year and 5-year DFS rates of 50.9% and 45.7%, respectively, while the surgery group showed rates of 9.8% and 7.8%, respectively. Furthermore, the 3-year and 5-year OS rates of PORT group were 64.6% and 53.1%, respectively, whereas the surgery group had rates of 33.1% and 24.2%, respectively. These differences remained statistically significant for both DFS (median DFS, 47.9 vs. 8.0 months; HR, 0.34; 95%CI, 0.26–0.44; p < 0.001; Fig. 3A) and OS (median OS, 73.5 vs. 20.3 months; HR, 0.39; 95%CI, 0.29–0.52; p < 0.001; Fig. 3B).
Fig. 3
Survival outcomes of patients after propensity-score matching. A Disease-free survival; B overall survival. PORT, postoperative radiotherapy; HR, hazard ratio; CI, confidence Interval; No, number
In the PSM population (see additional file-Table s2), univariable analyses revealed associations between survival outcomes and pathological N stage as well as PORT. Furthermore, in the multivariable analyses, N0-1 stage (HR, 0.48; 95%CI, 0.40–0.58; p < 0.001) and PORT (HR, 0.29; 95%CI, 0.22–0.38; p < 0.001) emerged as independent prognostic factors for DFS. Similarly, in the well-balanced cohort, N stage (HR, 0.51; 95%CI, 0.41–0.62; p < 0.001) and PORT (HR, 0.36; 95%CI, 0.27–0.48; p < 0.001) were identified as independent factors associated with OS.
Initial recurrence patterns and risk factors for progressionDuring the follow-up period, disease recurrence was observed in 90.0% (226/251) of patients in the surgery group and 46.7% (119/255) of patients in the PORT group, with a statistically significant difference (p < 0.001). As indicated in Table 2, distant metastases were noted in 19.5% (49/251) of surgery group patients and 28.6% (73/255) of PORT group patients, demonstrating a significant difference (p < 0.001). Notably, hematologic metastasis emerged as the predominant failure pattern in patients who had undergone adjuvant radiotherapy. In contrast, locoregional recurrence (54.2% vs. 9.4%, p < 0.001) and anastomosis recurrence (6.4% vs. 0.8%, p = 0.03) were more frequently observed in the surgery group compared to the PORT group. These differences in distant metastases and locoregional relapse between the two groups remained statistically significant (both p < 0.001) in the PSM cohort. It is noteworthy that, for patients experiencing locoregional recurrences, 87.8% (40/46) of cases occurred within the radiation field in the PORT group. While 96% (170/177) of locoregional recurrences in the surgery group were within the specified radiation field.
Table 2 Failure patterns of two groups in the entire population and PSM cohortThe logistic regression results revealed that T stage (OR, 1.87; 95%CI, 1.19–2.95; p = 0.007), age (OR, 0.40; 95%CI, 0.25–0.60; p < 0.001), PORT (OR, 0.06; 95%CI, 0.04–0.10; p < 0.001), and adjuvant chemotherapy (OR, 0.53; 95%CI, 0.32–0.87; p = 0.01) were identified as independent factors associated with locoregional recurrence. Furthermore, T stage (OR, 0.18; 95%CI, 0.04–0.86; p = 0.03), N stage (OR, 1.75; 95%CI, 1.32–2.33; p < 0.001), and PORT (OR, 0.08; 95%CI, 0.05–0.14; p < 0.001) were strongly correlated with disease progression. These significant associations led to the development of two separate nomogram models (Fig. 4A, B) designed to predict the likelihood of locoregional recurrence and overall disease progression in patients who had undergone esophagectomy for locally advanced TESCC.
Fig. 4
Nomogram models to calculate risk score and predictions of progressive probability and calibration curves. A Local recurrence model; B Total progression model; C calibration curves for (A); D calibration curves for (B). PORT, postoperative radiotherapy
These models exhibited commendable predictive accuracy, as evidenced by their area under the curve (AUC) values: 0.833 for locoregional recurrence and 0.805 for disease progression. Moreover, calibration curves were employed to assess the models' accuracy in predicting locoregional recurrence (S: p = 0.802, Fig. 4C) and overall progression (S: p = 0.474, Fig. 4D).
留言 (0)