
記住我
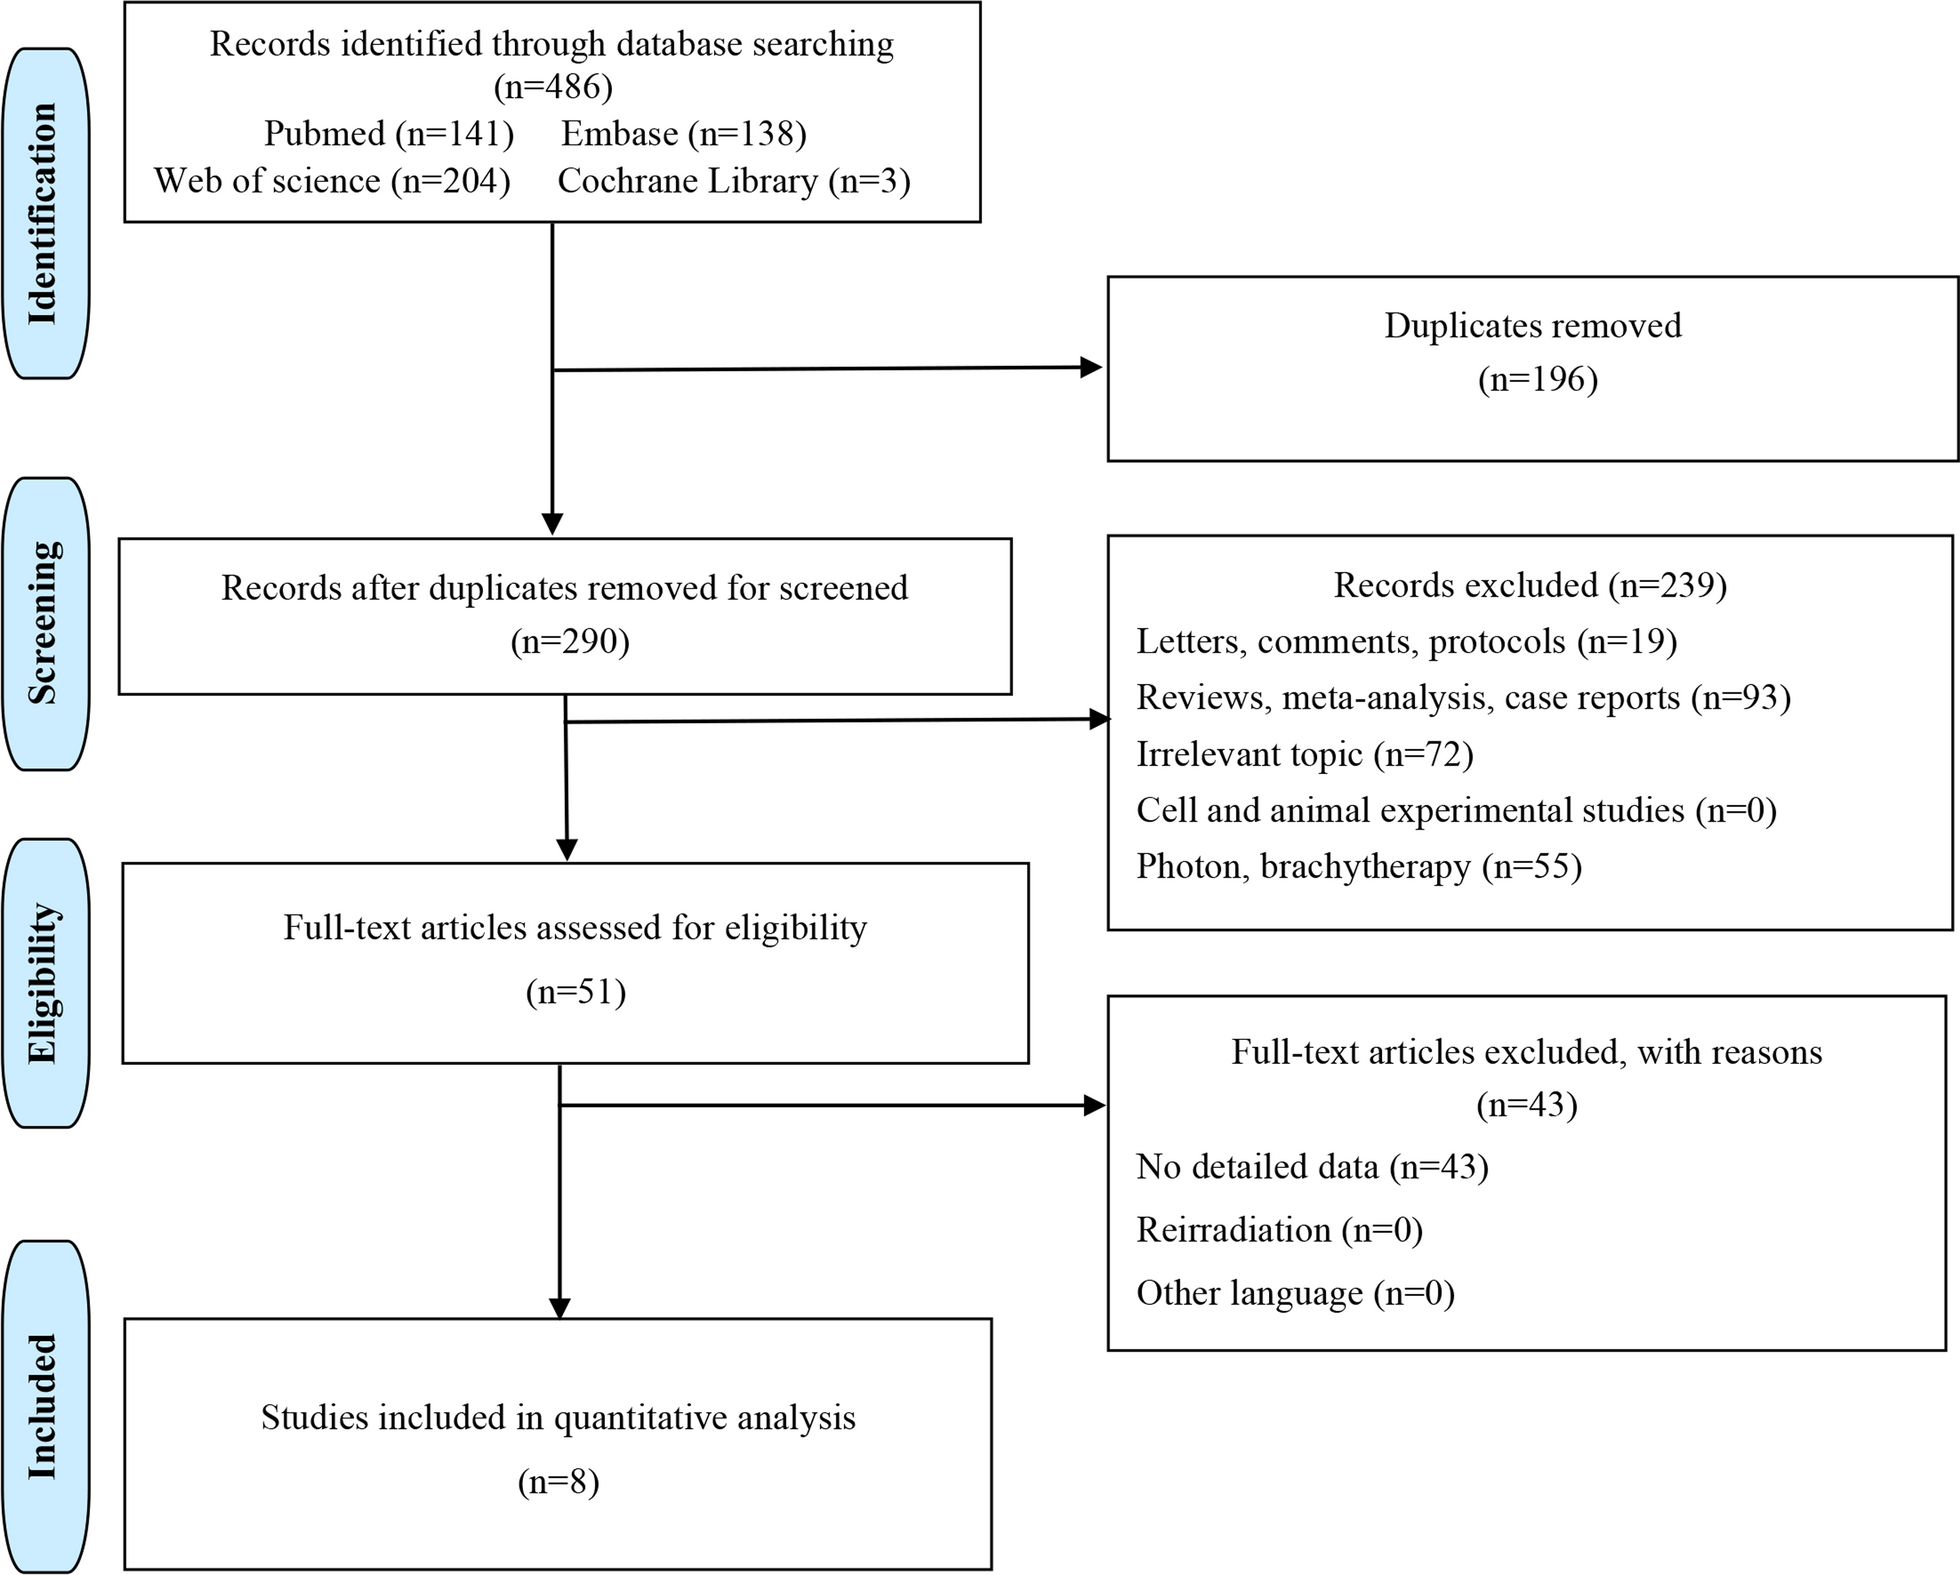

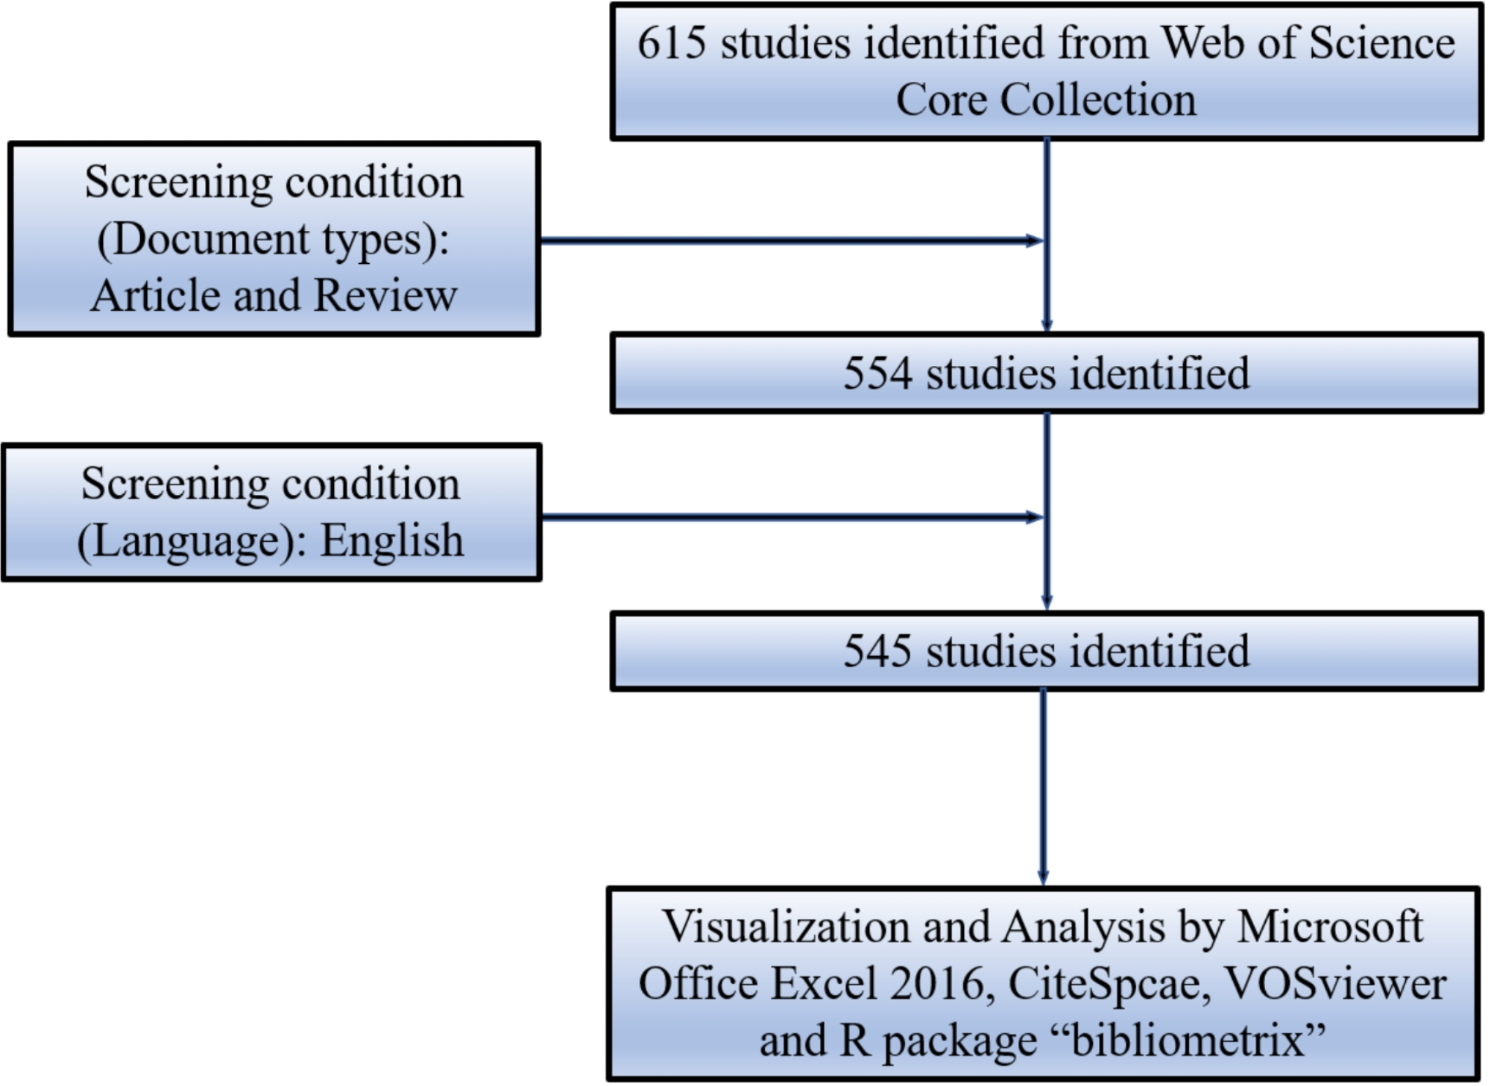


After the primary search, we screened a total of 4098 articles in four databases, and after excluding 361 duplicates, two independent reviewers screened the titles and abstracts of the remaining 3737 articles and excluded 3611 irrelevant articles. After reading the full text of the remaining 126 articles, 89 articles were excluded, and 26 of the remaining 37 articles contained data related to respiratory adverse effects, these 26 articles and 2670 patients were included in our meta-analysis [9,10,11,12,13,14,15,16,17,18,19,20,21,22,23,24,25,26,27,28,29,30,31,32,33,34]. The PRISMA flowchart is shown in Fig. 1.
Fig. 1
Study methodology flowchart. All the steps of this study, from the start to the end are described in the given diagram
In the selection of ICIs, a total of 15 studies opted for the solitary application of PD-1, while six studies chose to exclusively employ PD-L1. Additionally, four studies opted for the combined use of multiple ICIs, and one study consisted of two separate cohorts, one utilizing PD-L1 monotherapy and the other employing combination therapy. Regarding the choice of radiotherapy modality, seven studies utilized Stereotactic Body Radiation Therapy (SBRT), 12 studies employed alternative radiotherapy modalities, and seven studies did not explicitly specify the RT method. Further details on the baseline characteristics of the clinical trials included in this meta-analysis can be found in Table 1.
Table 1 Baseline characteristics of the eligible studiesRisk of Respiratory adverse effects in patients treated with immune checkpoint inhibitors in combination with radiotherapyWe evaluated the incidence rates of adverse respiratory events, including cough, pneumonia, upper respiratory tract infections, and others. Specifically, the incidence rates for different adverse events were as follows: the highest incidence rate of adverse events was for grades 1–5 cough, with an incidence rate of 0.176 (95%CI: 0.113–0.274, I2 = 92.36%); the incidence rate of grades 1–5 pneumonitis was 0.118 (95%CI: 0.067–0.198, I2 = 88.64%); the incidence rate of grades 1–5 upper respiratory tract infection was 0.064 (95%CI: 0.049–0.080, I2 = 0.98%)(Figs. 2, 3 and 4). The incidence rate of severe adverse events was relatively similar: the incidence rate of grades 3–5 cough was 0.050 (95%CI: 0.012–0.204, I2 = 8.90%); the incidence rate of grades 3–5 pneumonitis was 0.052 (95%CI: 0.031–0.078, I2 = 83.86%); the incidence rate of grades 3–5 upper respiratory tract infection was 0.040 (95%CI: 0.007–0.249, I2 = 45.31%)(Supplementary Figs. 1–3). In addition, we also assessed the incidence rate of dyspnea. The incidence rate of grades 1–5 dyspnea was 0.211 (95%CI: 0.126–0.296, I2 = 93.44%)(Fig. 5), while the incidence rate of grades 3–5 dyspnea was 0.029 (95%CI: 0.014–0.061, I2 = 75.34%)(Supplementary Fig. 4).
Fig. 2
Forest plot of incidence rate of grades 1–5 cough in Patients Treated with Immune Checkpoint Inhibitors in Combination with Radiotherapy
Fig. 3
Forest plot of incidence rate of grades 1–5 pneumonitis in Patients Treated with Immune Checkpoint Inhibitors in Combination with Radiotherapy
Fig. 4
Forest plot of incidence rate of grades 1–5 upper respiratory tract infection in Patients Treated with Immune Checkpoint Inhibitors in Combination with Radiotherapy
Fig. 5
Forest plot of incidence rate of grades 1–5 dyspnea in Patients Treated with Immune Checkpoint Inhibitors in Combination with Radiotherapy
Risk of respiratory adverse effects in different Immune checkpoint inhibitors therapiesAs shown in the Figs. 6, 7 and 8, we conducted subgroup analyses on PD-1 inhibitor, PD-L1 inhibitor, and combination therapy respectively. We found that the incidence rate of respiratory adverse reactions(cough, pneumonitis, upper respiratory tract infection) in patients receiving combination therapy was higher than that in patients receiving PD-1 or PD-L1 inhibitor monotherapy. Regarding the comparison between PD-1 and PD-L1 inhibitor, except for a similar incidence rate of severe pneumonia, the incidence rate of other respiratory adverse reactions was higher with PD-1 inhibitor treatment(Supplementary Fig. 5).
Fig. 6
Forest plot of incidence rate of grades 1–5 cough for subgroup analysis by different immune checkpoint inhibitors therapies
Fig. 7
Forest plot of incidence rate of grades 1–5 pneumonitis for subgroup analysis by different immune checkpoint inhibitors therapies
Fig. 8
Forest plot of incidence rate of grades 1–5 upper respiratory tract infection for subgroup analysis by different immune checkpoint inhibitors therapies
The incidence rates for adverse events of applied combination therapy were as follows: the incidence rate of grades 1–5 cough was 0.207 (95%CI: 0.138–0.312, I2 = 14.58%); the incidence rate of grades 1–5 pneumonitis was 0.146 (95%CI: 0.082–0.245, I2 = 0%); the incidence rate of grades 1–5 upper respiratory tract infection was 0.096 (95%CI: 0.024–0.167, I2 = 60.41%); grades 3–5 pneumonitis, 0.100 (95%CI: 0.005–0.295, I2 = 59.34%). The incidence rates for adverse events of applied PD-1 inhibitor therapy were as follows: the incidence rate of grades 1–5 cough was 0.171 (95%CI: 0.077–0.376, I2 = 95.68%); the incidence rate of grades 1–5 pneumonitis was 0.112 (95%CI: 0.042–0.296, I2 = 93.28%); the incidence rate of grades 1–5 upper respiratory tract infection was 0.061 (95%CI: 0.039–0.084, I2 = 0%); the incidence rate of grades 3–5 pneumonitis was 0.049 (95%CI: 0.021–0.088, I2 = 86.96%). The incidence rates for adverse events of applied PD-L1 inhibitor therapy were as follows: the incidence rate of grades 1–5 cough was 0.162 (95%CI: 0.065–0.402, I2 = 85.22%); the incidence rate of grades 1–5 pneumonitis was 0.106 (95%CI: 0.036–0.271, I2 = 83.77%); the incidence rate of grades 1–5 upper respiratory tract infection was 0.053 (95%CI: 0.000-0.111, I2 = 0%); the incidence rate of grades 3–5 pneumonitis was 0.050 (95%CI: 0.020–0.091, I2 = 84.23%).
Risk of respiratory adverse effects in different radiotherapiesAs shown in the Figs. 9, 10 and 11, compared to other radiotherapy modes, SBRT (stereotactic body radiotherapy) exhibited lower incidence rates for grades 1–5 cough (0.139, 95% CI: 0.0.087–0.223 vs. 0.178, 95% CI: 0.075–0.422), grades 1–5 pneumonitis (0.085, 95% CI: 0.045–0.155 vs. 0.117, 95% CI: 0.042–0.286), and grades 1–5 upper respiratory tract infection (0.052, 95% CI: 0.017–0.157 vs. 0.096, 95% CI: 0.032–0.288), but a higher incidence of grade 3–5 pneumonitis (0.061, 95% CI: 0.022–0.161 vs. 0.049, 95% CI: 0.019–0.120)(Supplementary Fig. 6).
Fig. 9
Forest plot of incidence rate of grades 1–5 cough infection for subgroup analysis by different radiotherapies
Fig. 10
Forest plot of incidence rate of grades 1–5 pneumonitis for subgroup analysis by different radiotherapies
Fig. 11
Forest plot of incidence rate of grades 1–5 upper respiratory tract infection for subgroup analysis by different radiotherapies
Risk of respiratory adverse effects in different tumor locationsAs shown in the Figs. 12, 13 and 14, we performed a subgroup analysis of the tumor locations. The results showed that compared to tumors of other sites, NSCLC or other thoracic tumors had significantly higher incidence rates for grades 1–5 cough (0.488, 95% CI: 0.275–0.732 vs. 0.123, 95% CI: 0.080–0.188), grades 1–5 pneumonitis (0.280, 95% CI: 0.153–0.455 vs. 0.065, 95% CI: 0.034–0.121), grades 1–5 upper respiratory tract infection (0.121, 95% CI: 0.053–0.190 vs. 0.059, 95% CI: 0.043–0.075), and grades 3–5 pneumonitis (0.068, 95% CI: 0.038–0.105 vs. 0.041, 95% CI: 0.017–0.074)(Supplementary Fig. 7).
Fig. 12
Forest plot of incidence rate of grades 1–5 cough for subgroup analysis by different tumor locations
Fig. 13
Forest plot of incidence rate of grades 1–5 pneumonitis for subgroup analysis by different tumor locations
Fig. 14
Forest plot of incidence rate of grades 1–5 upper respiratory tract infection for subgroup analysis by different tumor locations
Risk of respiratory adverse effects in different treatment ordersAs shown in the Figs. 15, 16 and 17, compared to sequential treatment, concurrent treatment exhibited lower incidence rates for grades 1–5 cough (0.155, 95% CI: 0.101–0.238 vs. 0.199, 95% CI: 0.038-1.000), grades 1–5 pneumonitis (0.096, 95% CI: 0.050–0.179 vs. 0.223, 95% CI: 0.181–0.271), and grades 3–5 pneumonitis (0.047, 95% CI: 0.024–0.078 vs. 0.058, 95% CI: 0.035–0.086)(Supplementary Fig. 8).
Fig. 15
Forest plot of incidence rate of grades 1–5 cough for subgroup analysis by different treatment orders
Fig. 16
Forest plot of incidence rate of grades 1–5 pneumonitis for subgroup analysis by different treatment orders
Fig. 17
Forest plot of incidence rate of grades 1–5 upper respiratory tract infection for subgroup analysis by different treatment orders
Quality Assessment and Publication BiasWe used the Cochrane risk of bias tool to assess the quality of RCTs, and the results are shown in Supplementary Fig. 9. As shown in the figure, we used the MINORS scale to assess the quality of single-arm and non-randomized controlled studies (Supplementary Table 1). We conducted publication bias analysis using funnel plots, and except for Dyspnoea, which displayed a noticeably asymmetric funnel plot, the funnel plots for the other adverse effects appeared relatively symmetrical (Supplementary Figs. 10–15). Egger’s and Begg’s tests were also performed to recognize publication bias in this studyl (Supplementary Figs. 16–21). Except for Dyspnoea, which showed a significant result with Egger’s test (p < 0.0001), no substantial bias was observed for the other adverse effects. Sensitivity analyses were also performed to assess the stability of the included studies (Supplementary Figs. 22–33). After excluding one study at a time, no significant difference in the results was found from the initial analysis.
留言 (0)