
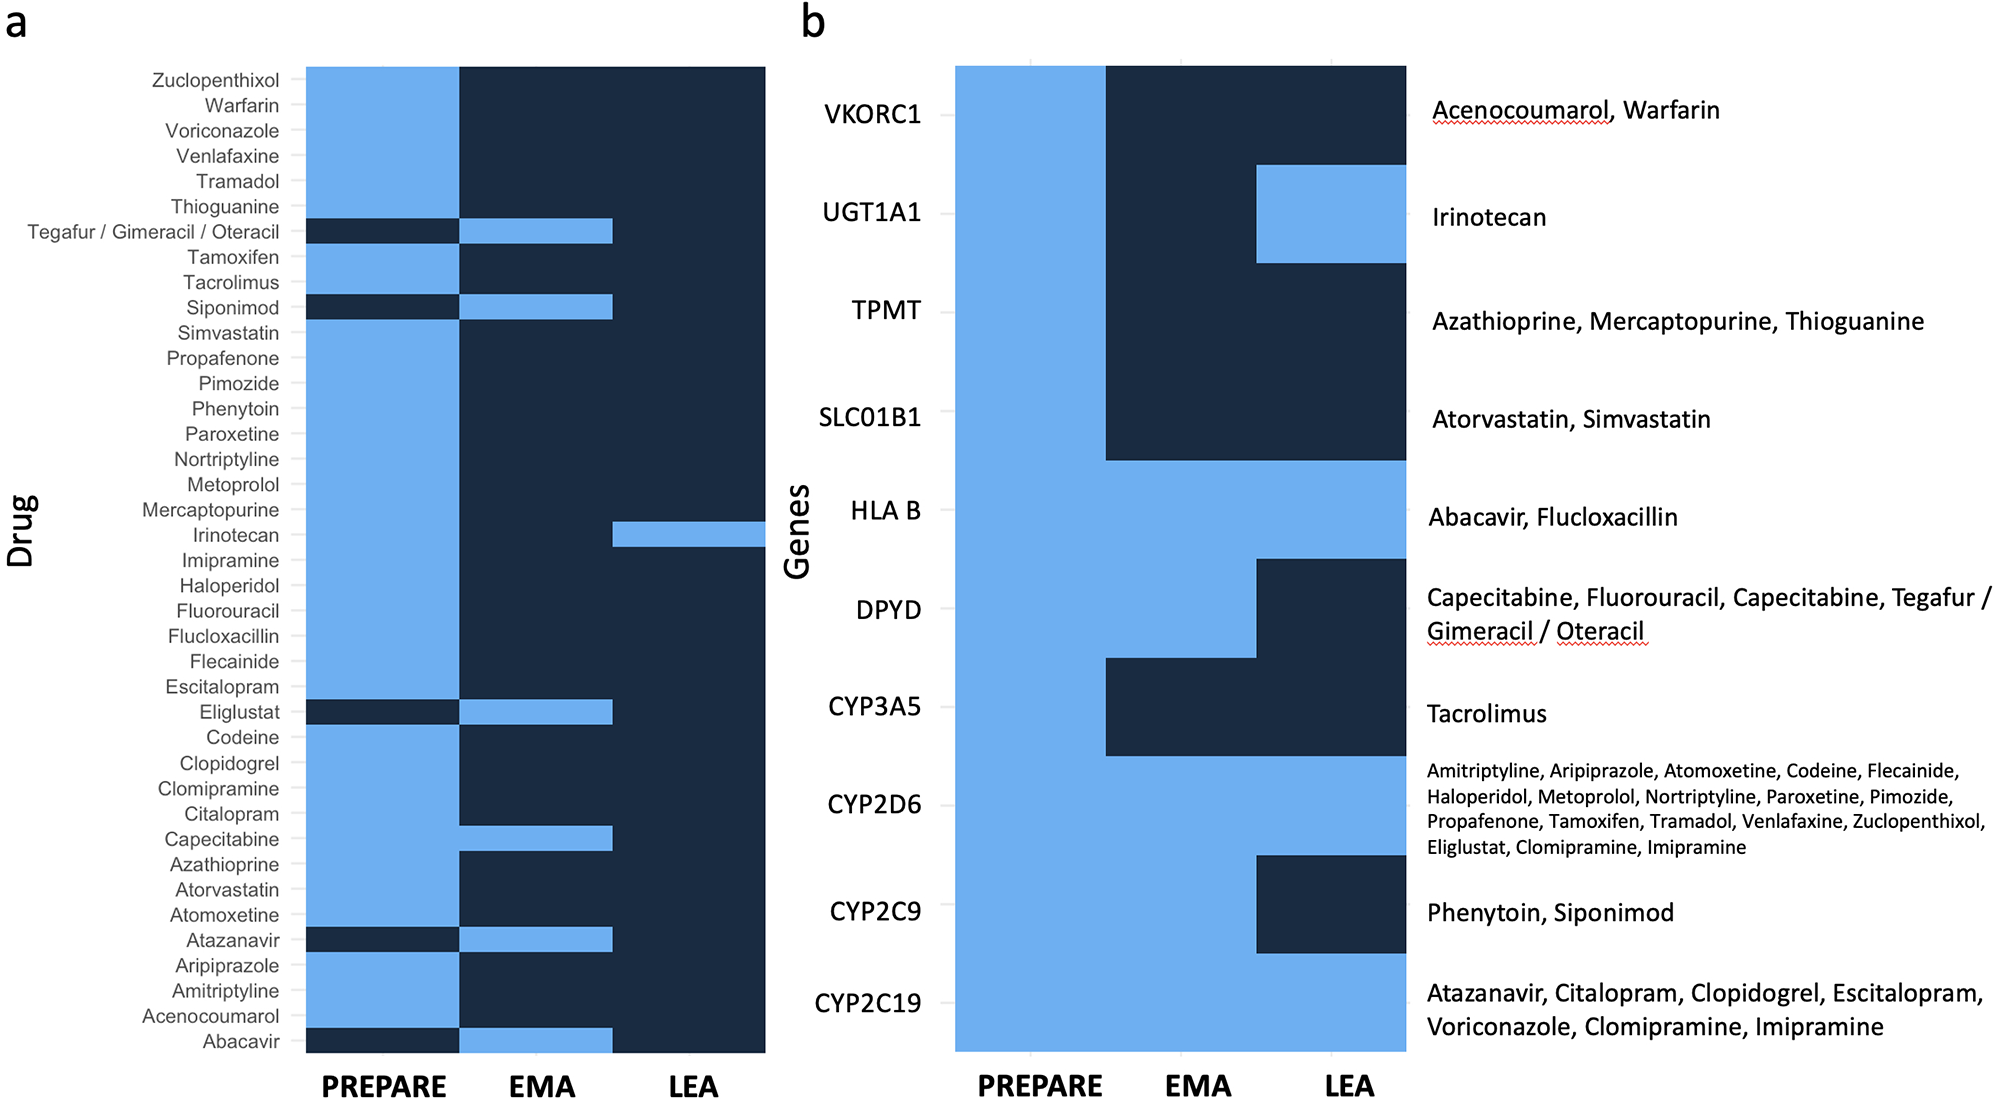
記住我

The main characteristics of the patients are summarized in Table 1. The median age of patients at the time of CRC diagnosis is 68 years (range 42–87) and the study group comprises slightly more men (53%) than women (47%). The unequal sex distribution is not intentional and corresponds with the reported higher incidence of CRC in men [1]. The majority of patients have stage II or III disease (40% resp. 47%) and tumors localized in the left colon (60%). One patient at stage IV was excluded from survival analyses and the rest of the analyses included the group of patients with stage III. The vast majority of surgical tumor removal procedures were evaluated as R0, i.e. tumor-free resection margins. About 62% of patients were administered 5-FU-based systemic adjuvant chemotherapy with or without oxaliplatin and the rest of the patients did not receive any chemotherapy due to either poor performance status or lack of risk factors for stage II. The median follow-up is 48 months. RFS of the patients is significantly associated with disease stage (p = 0.045) and the presence of regional lymph node metastases (p = 0.021). OS is associated only with the latter (p = 0.045) (Supplementary Fig. S1).
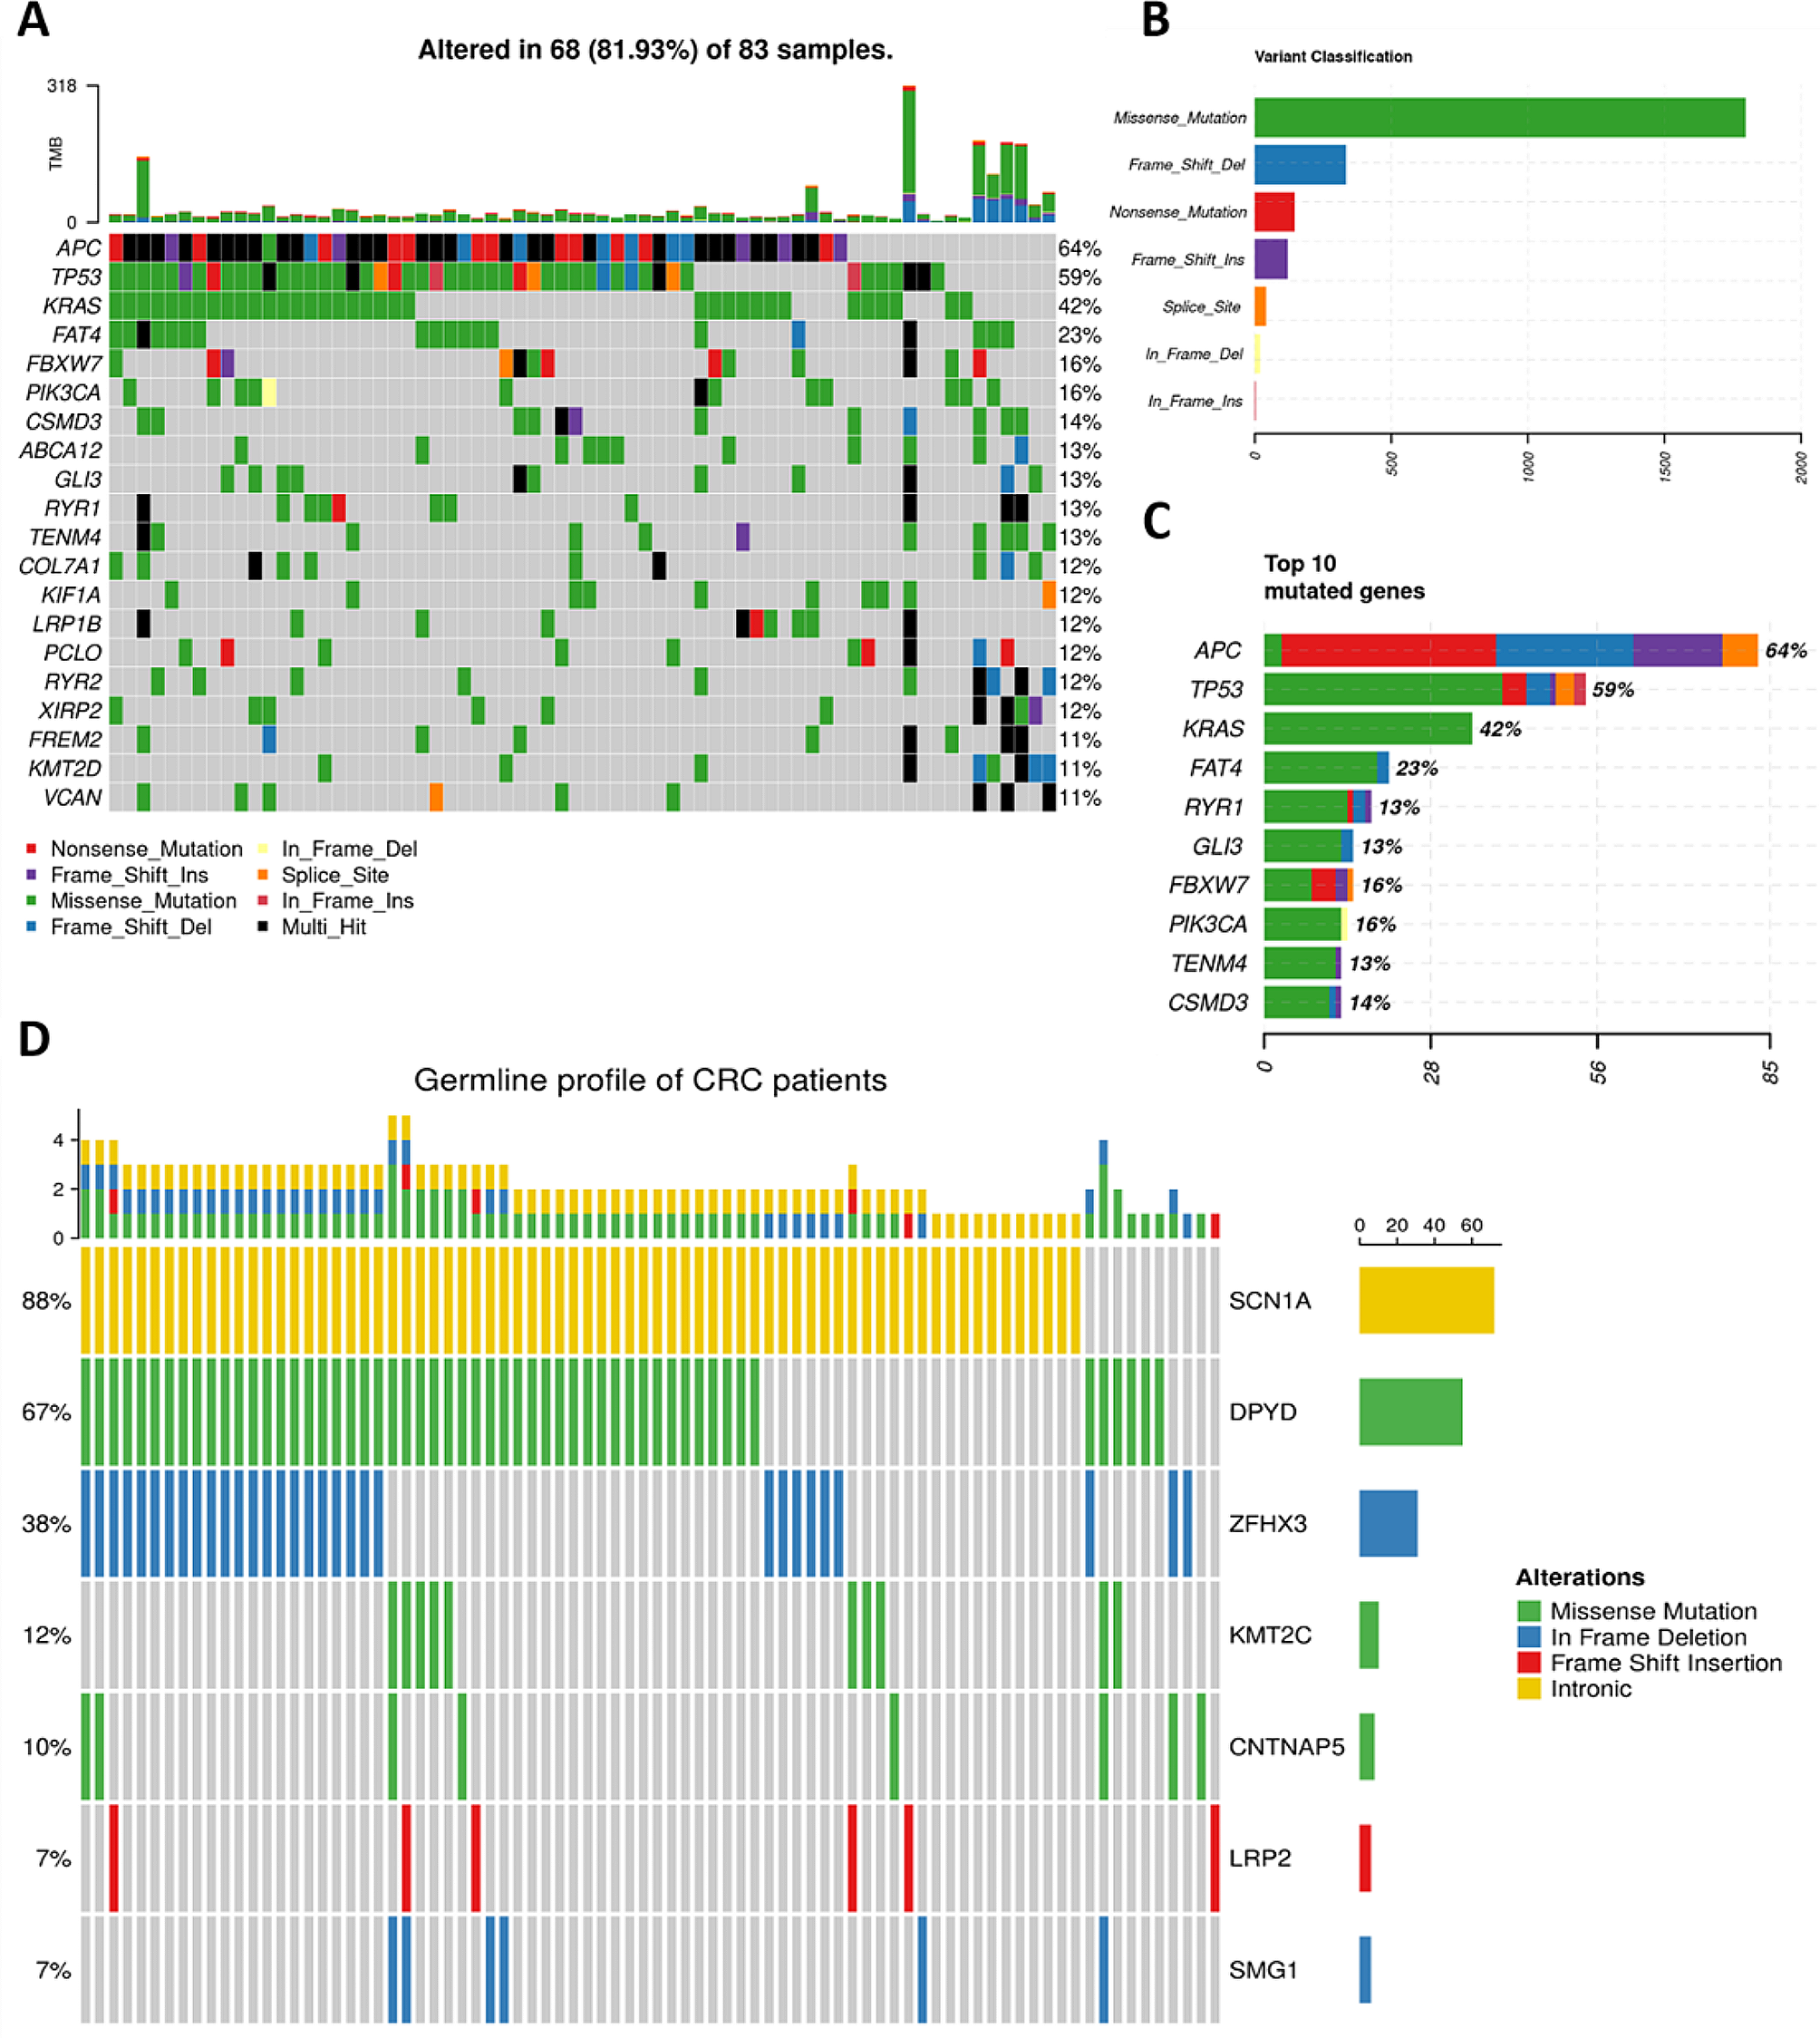
Table 1 Clinical characteristics of the patientsSomatic profile of tumor samplesThe median number of detected variants per tumor sample was 18.5 (ranging from 0 to 318). The median amount of somatic variants fulfilling the functional classification HIGH (see Materials and Methods) per sample was 4 (0–79) and for MODERATE 14.5 (0–239). APC, TP53, and KRAS were the most frequently mutated genes (64%, 59%, and 42% of mutated samples, respectively). Additionally, FAT4 (23%), FBXW7, and PIK3CA (16% for both) belong to the most mutated genes (Fig. 1a, c and Supplementary Table S2). The most common class of somatic variants was the missense mutation (Fig. 1b). The median TMB per Mb was 3.6 (0–62.3) and seven patients were classified as MSI-high and MMR-D. The median CNV size was 15.48 Mbp (0.048–36.24). The mutation summary for all samples is in Supplementary TableS3.
Fig. 1
Oncoplot of somatic and germline variability of targeted gene panel in CRC patients. (a) Plot of top 20 somatically most mutated genes. (b) The classification of variants according to their functional effect (missense, frameshift deletion/insertion, nonsense, splice site, or in-frame deletion/insertion mutations). The most prevalent variants were missense. (c) Overall distribution of variants in top 10 genes with most somatic mutations. (d) Genes with germline variants listed in ClinVar or InterVar databases
Germline profile of CRC patientsThe median number of all detected germline variants per sample was 326 (ranging from 310 to 355) and that of variants with the HIGH predicted effect was 25 (19–30). At least 5% frequency for the sum of all variants with the HIGH effect was observed in 55 genes. Out of these, pathogenic or drug response-connected variants were called by ClinVar or InterVar for SCN1A (88% of patients), DPYD (67%), ZFHX3 (38%) KMT2C (12%), CNTNAP5 (10%), LRP2 (7%) and SMG1 (7%) (Fig. 1d). SCN1A (rs3812718), ZFHX3 (rs372909378), CNTNAP5 (rs17727261), LRP2 (rs80338754), and SMG1 (rs781029159) were unique polymorphisms, while for KMT2C (rs199504848 and rs763762478) and DPYD (97,883,329, 97,515,839, 97,699,535, 97,305,364) multiple polymorphic loci were found (Supplementary TableS4).
Clinical associations of mutational profilesFor all analyses, variants with HIGH or MODERATE predicted functional effects counted together were used. We first analyzed associations between individual gene mutation frequencies or functional classification and clinical data including survival.
Patients with a higher risk of progression - in stages III or IV (n = 40) have more frequent mutations in APC (pcrude=0.036, Fisher’s exact test), TP53 (pcrude=0.040), or KRAS (pcrude=0.048) than those in less advanced stages I or II. For KRAS, we also found an increasing trend in mutation counts with grade (G1 < G2 < G3, pcrude=0.030). In the case of APC, the association with disease stage was even more pronounced for frameshift type of mutations (pcrude=0.015) and KRAS specifically for the 12D mutation (pcrude=0.012 for stage and pcrude=0.027 for grade), all in the same direction. The response to adjuvant therapy was worse in carriers of frameshift mutations in APC (pcrude=0.008) or 12D variant in KRAS (pcrude=0.005) (Table 2). However, none of these associations passed the FDR adjustment for multiple testing (padj>0.05).
Table 2 Associations of somatic variants in individual genes with clinical dataAlthough the survival analysis did not offer a significant relationship (pcrude/padj>0.05), the trends were very clear. Patients with shorter RFS more often have frameshift mutations in APC (pcrude=0.064, Supplementary Fig. S2a) or carry the KRAS-12D variant (pcrude=0.057, Supplementary Fig. S2b). The relationships with OS were less pronounced, although in the same direction (pcrude=0.180 for APC and pcrude=0.200 for KRAS-12D) (Supplementary Fig. S2c, d). Neither the frequency nor the functional classification of somatic mutations in TP53 had predictive or prognostic significance. When analyzing combinations based on co-mutated APC, KRAS, and TP53, the combination TP53 co-mutated with KRAS codons 12 or 13 and more specifically subset of KRAS-12D with TP53 co-mutated had worsened OS (pcrude=0.024 and pcrude=0.047, respectively, Supplementary Fig. S2e, f), but not RFS (pcrude=0.420 and pcrude=0.078, respectively). None of these associations passed the FDR adjustment for multiple testing (padj>0.05). Several patients had all three genes co-mutated, based on APC frameshift or nonsense type of mutations (n = 29), but this combination did not significantly modify their survival (pcrude>0.05).
As for other genes, we found several relationships between mutation spectra and patient survival among genes mutated in at least 10% of samples (n = 45 genes, Supplementary Table S2). The rest of genes was not analyzed in a single gene mode due to small numbers of patients in the compared subgroups. Mutations in ANK2 and SACS were associated with shorter RFS (pcrude=0.021 and pcrude=0.014, respectively) and those in ABCA13, ANK2, COL7A1, NAV3, and UNC80 with shorter OS (pcrude<0.001, pcrude<0.001, pcrude=0.002, pcrude=0.005, and pcrude=0.035, respectively) regardless of treatment. Interestingly, KMT2D showed an inverse relationship to OS, i.e. shorter survival in patients without variants (pcrude=0.050) (Supplementary Fig.S3a-h).
In untreated patients only (n = 29), no relationship to RFS was found, but carriage of somatic mutations in ABCA13, ANK2, COL7A1, FLG, GLI3, and UNC80 was associated with OS (pcrude<0.001, pcrude=0.012, pcrude=0.046, pcrude=0.006, pcrude=0.012, and pcrude<0.001, respectively) (Supplementary Fig.S4a-f).
No association with RFS was also found in patients treated with adjuvant regimens of chemotherapy (n = 47, one patient with stage IV excluded from survival analyses). On the other hand, we found many relationships with OS, namely for poor OS and carriage of mutations in ABCA13, ANK2, COL6A3, COL7A1, LRP1B, NAV3, RYR1, RYR3, TCHH, and TENM4 (pcrude=0.001, pcrude=0.029, pcrude=0.002, pcrude=0.004, pcrude=0.003, pcrude=0.036, pcrude=0.043, pcrude=0.027, pcrude=0.037, and pcrude=0.015, respectively) (Supplementary Fig.S5a-j).
From the above results, it was apparent that variants in ABCA13, ANK2, and COL7A1 carry prognostic information regardless of whether adjuvant oncological treatment was administered or the patient was just discharged. Furthermore, FLG, GLI3, and UNC80 appear to be prognostic in treatment-naïve patients, whereas COL6A3, LRP1B, NAV3, RYR1, RYR3, TCHH, and TENM4 in those treated with adjuvant chemotherapy. We therefore grouped all genes with pcrude<0.05 for further analysis. In these analyses, we applied the FDR adjustment for multiple testing to all results. OS of patients with mutations in ABCA13, ANK2, COL7A1, NAV3, or UNC80 grouped was highly significantly worse than in patients who did not carry mutations in any of these five genes (padj=0.015, Fig. 2a). This five-gene signature was prognostic, in the same direction, also in untreated (padj=0.007, Fig. 2b) but not in adjuvantly treated (pcrude=0.140, Fig. 2c) patients. A combination of three genes ABCA13, ANK2, or COL7A1 had the same effect (all padj<0.001, Fig. 2d-f), but combination of 10 genes (ABCA13, ANK2, COL7A1, COL6A3, LRP1B, NAV3, RYR1, RYR3, TCHH, and TENM4) was not significant (all pcrude>0.05) indicating that associations are gene-selective irrespective of just general mutation load.
Fig. 2
Kaplan-Meier plots of patient survival stratified by the carriage of somatic variants in ABCA13-ANK2-COL7A1 or ABCA13-ANK2-COL7A1-NAV3-UNC80. OS analysis of somatic variants in ABCA13, ANK2, COL7A1, NAV3, or UNC80 in all (a), untreated (b), and adjuvantly treated (c) patients. OS analysis of somatic variants in ABCA13, ANK2, or COL7A1 in all (d), untreated (e), and adjuvantly treated (f) patients. Blue line represents patients without mutations, the yellow line patients carrying mutations in single gene, and the grey line those with mutations in more than one gene (where applicable)
Moreover, the carriage of mutations in any of genes from combination of FLG, GLI3, or UNC80 was prognostic for worse OS in untreated patients (padj<0.001, Fig. 3a), while less significantly also in all patients (padj=0.007, Fig. 3b), but not at all in treated ones (pcrude=0.700, Fig. 3c). Finally, worse OS was observed in adjuvantly treated patients with mutations in any of COL6A3, LRP1B, NAV3, RYR1, RYR3, TCHH, or TENM4 and it was even worse in carriers of multiple gene mutations (padj<0.001, Fig. 3d). On the contrary, this gene combination was not prognostic in terms of OS for untreated (pcrude=0.340, Fig. 3e) and weakly significant before FDR adjustment in all patients (pcrude=0.025/padj=0.070, Fig. 3f). None of the above combinations was prognostic for RFS (pcrude>0.05).
Fig. 3
Kaplan-Meier plots of patient survival stratified by the carriage of somatic variants in FLG-GLI3-UNC80 or COL6A3-LRP1B-NAV3-RYR1-RYR3-TCHH-TENM4. OS analysis of somatic variants in FLG, GLI3, or UNC80 in untreated (a), all (b), and adjuvantly treated (c) patients. OS analysis of somatic variants in COL6A3, LRP1B, NAV3, RYR1, RYR3, TCHH, or TENM4 in adjuvantly treated (d), untreated (e), and all (f) patients. Blue line represents patients without mutations, the yellow line patients carrying mutations in single gene, and the grey line those with mutations in more than one gene (where applicable)
We further divided the gene set according to the occurrence of mutations in oncodriver pathways identified in our previous exome studies as associated with CRC progression (MYC, Hippo, Notch, RTK-RAS, PI3K, HRR, and the immunogenic signature ICB1) [19] (Supplementary TableS5). Although the gene panel was less informative on the complete pathway level as opposed to the exome, the gene selection was broad enough and included the majority of principal genes from the mentioned pathways, as can be judged from the resulting associations with clinical data. Patients with mutations in the MYC, PI3K, RTK-RAS, and ICB1 pathways had more often regionally advanced stage III or generalized IV than locally advanced stages I or II (pcrude=0.004, pcrude=0.030, pcrude=0.003, and pcrude=0.033, respectively, Table 3) although these associations did not pass the FDR adjustment to multiple testing (pcrude>0.05). Despite these associations, we did not observe a prognostic significance for any of the observed pathways. Hippo, Notch, or HRR (homologous recombination repair) pathways did not associate with any of the clinical characteristics (pcrude>0.05).
Table 3 Associations of somatic variants in oncodriver pathways with clinical dataThe MSI-high status, TMB divided by median, CNV size, or individual copy number alteration types divided by median showed no clinical associations and had no apparent prognostic role (p > 0.05).
We validated the observed prognostic associations of somatic variants with OS using the external dataset TCGA COAD-READ (specification in Materials and methods). We confirmed the association of ABCA13, ANK2, COL7A1, NAV3, or UNC80 with OS in all patients regardless of whether patients were treated with adjuvant chemotherapy or not (p = 0.032, Fig. 4). Despite we could still see the trend of longer survival of non-mutated patients the mutation dosage did not yield significant results (Supplementary Fig.S6d). Similarly, the rest of the observed associations showed a clear trend although p-values were statistically insignificant. Results of external validation are presented in Supplementary Fig.S6a-l.
Fig. 4
Kaplan-Meier plot of external validation of patient survival stratified by the carriage of somatic variants in ABCA13-ANK2-COL7A1-NAV3-UNC80. Blue line represents patients without mutations and the yellow line patients carrying mutations in any of the studied genes
From all germline variants, we tested those having more than 5% frequency and either record in ClinVar or InterVar databases (11 variants in 7 genes) or indication of an association with RFS divided by three years on Manhattan plot (7 variants in 4 genes, Supplementary Fig.S7). Of these, carriers of heterozygous genotype rs72753407 (intron variant) in NFACS had significantly poorer RFS and OS (pcrude<0.001/padj=0.011 and pcrude<0.001/padj=0.011, respectively) than wild-type patients (Fig. 5a, b). Additionally, patients carrying heterozygous genotype rs34621071 (intron) in ERBB4 had significantly worse OS and insignificant trend towards worse RFS, after FDR adjustment compared to wild-type carriers (pcrude=0.002/padj=0.018 for RFS and pcrude<0.001/padj=0.011 for OS, Fig. 5c, d). Although patients with wild-type for rs2444274 (intron) in RIF1 had worse RFS and OS than carriers of heterozygous or variant genotypes, these associations did not pass the FDR adjustment (pcrude=0.009/padj=0.054 for RFS) or remained borderline significant (pcrude=0.006/padj=0.043 for OS) (Fig. 5e, f). The rest of variants identified by the Manhattan plot (NFASC-rs2595959, RIF1-rs16830036 and rs16830047, and SYNE1-rs9479265) were not significant (pcrude>0.05).
Fig. 5
Kaplan-Meier plots of patient survival stratified by the carriage of germline variants in individual genes. RFS analysis of germline variants in NFACS- rs72753407 (a), ERBB4-rs34621071 (c), and RIF1-rs2444274 (e). OS analysis of germline variants in NFACS- rs72753407 (b), ERBB4-rs34621071 (d), and RIF1-rs2444274 (f). Blue line represents patients carrying the wild-type and yellow line carriers of heterozygous genotype. Grey line represents variant genotype carriers in (e) and (f) plots
No pathogenic or drug response-connected variants according to ClinVar or InterVar (CNTNAP5-rs17727261, DPYD-rs1801265, rs1801160, rs1801159, and rs2297595, LRP2-rs80338754, KMT2C-rs199504848 and rs763762478, SCN1A-rs3812718, SMG1-rs781029159, and ZFHX3-rs372909378) were associated with survival of patients (pcrude>0.05).
留言 (0)