
記住我
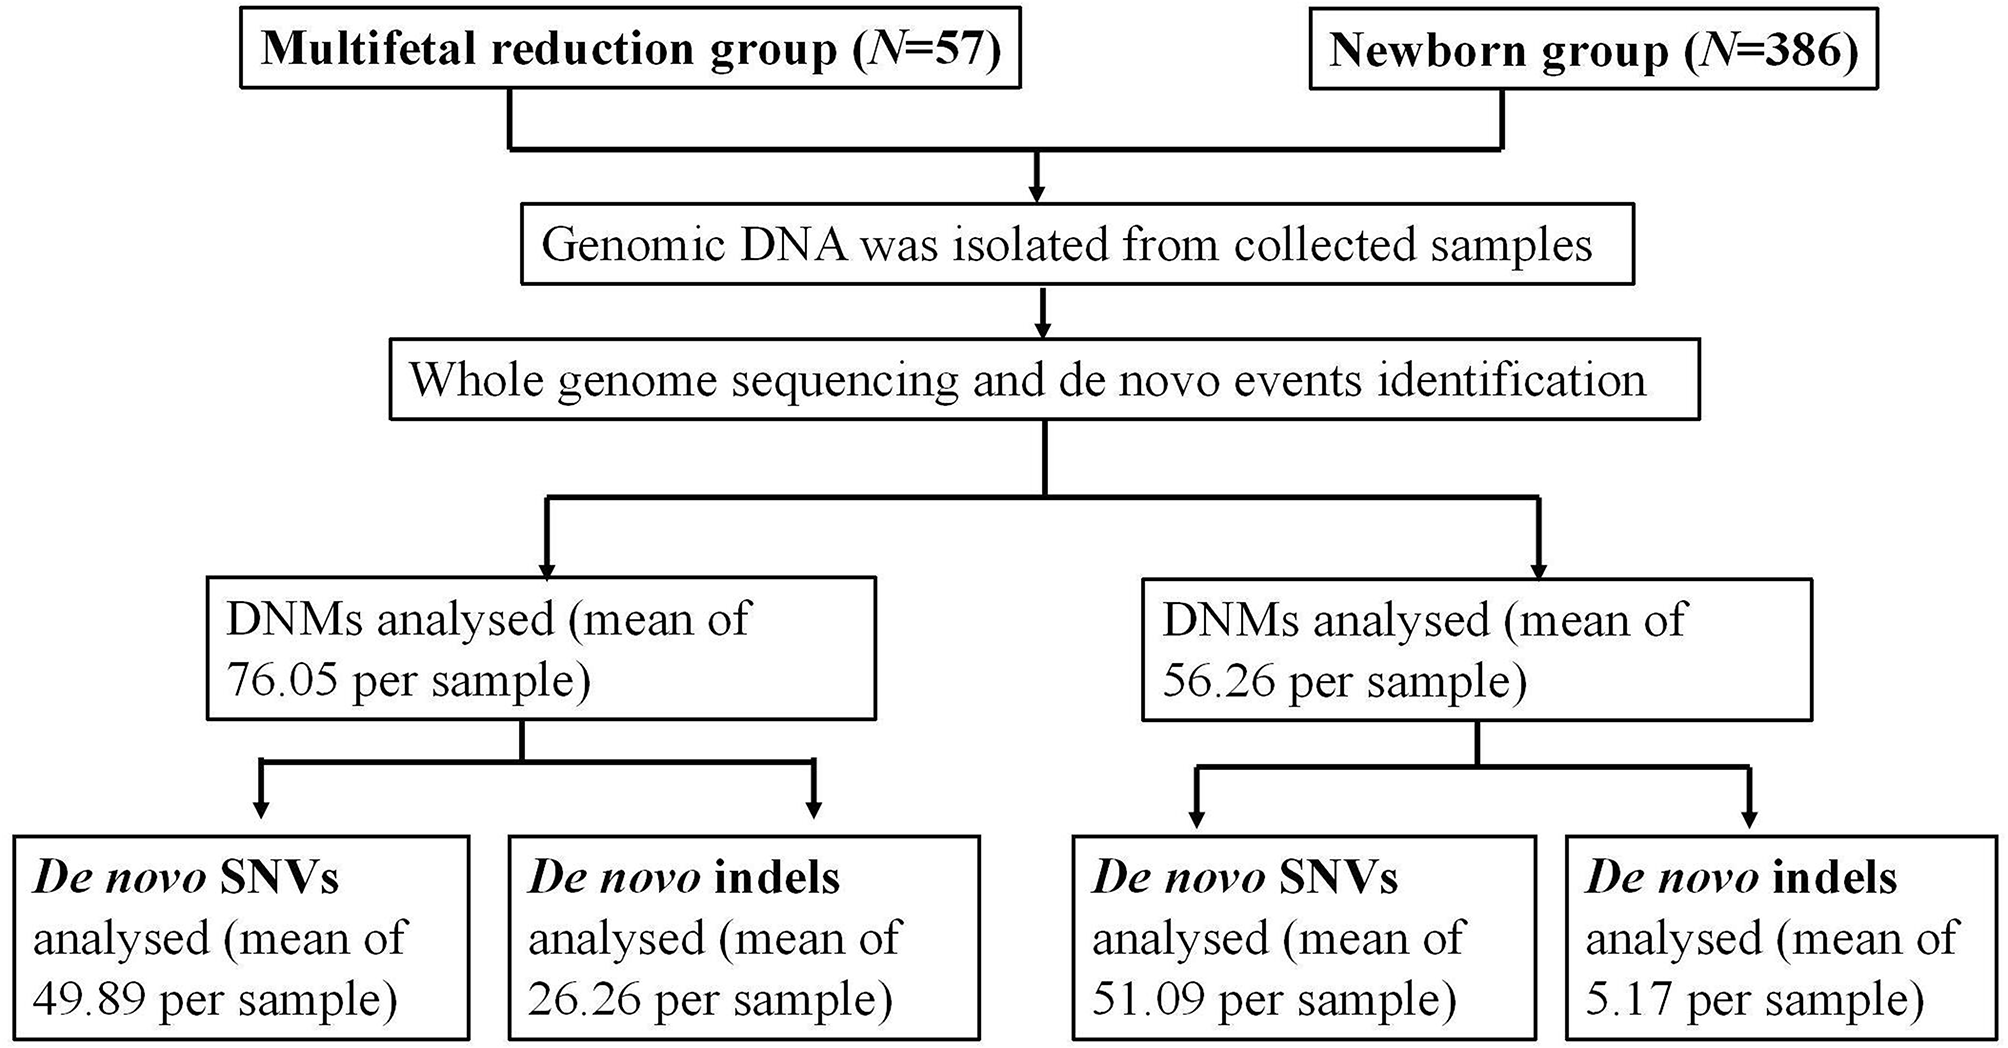
As illustrated in Fig. 1, Our research encompassed a total of 57 fetuses and 386 neonates, selected in accordance with the corresponding criteria. Based on clinical features, we established two distinct groups: the multifetal reduction group and the newborn group. The clinical background information of both groups is presented in Table 1. The parental age for the newborn group was 32.16 (31.78–32.53) and 33.88 (33.40–34.36), respectively, which was slightly higher than that of the multifetal reduction group. The maternal pre-pregnancy body mass index (BMI) in the multifetal reduction group was 22.14 (21.34–22.94) and in the newborn group was 21.49 (21.22–21.75). There was no significant difference in the age of the parents or the maternal pre-pregnancy BMI between the two groups (P > 0.05). The distribution of the DNMs between the two groups is discussed below.
Fig. 1
Flowchart of the main results of the study
Table 1 Parental characteristics between the two groups De novo events in the progeny from developing fetus to birth subsequent to implantationThe sequencing results show a WGS depth of 30X ∼ 40X per sample, yielding approximately 120G of data and sequencing quality of Q20 > 95% and Q30 > 85%. Based on the quantity of bases affected by the mutation, DNMs can be classified into categories: SNVs and indels. For the purposes of this study, only de novo SNVs and indels were analyzed. The genomic region in which DNMs occur can be divided into ten distinct groups based on their biological function including downstream, exonic, intergenic, intronic, ncRNA-exonic, ncRNA-intronic, splicing, upstream, UTR3, and UTR5. In this study, we focused on three major genetic regions, which were analyzed as follows: the downstream and upstream regions were classified as intergenic regions, while the ncRNA-intronic and splicing regions were categorized as intronic regions. Finally, the ncRNA-exonic, UTR3, and UTR5 regions were grouped as exonic regions.
The average number of total DNMs in the newborns was observed to be 56.26 (54.17–58.35), which appeared to be lower than that in the multifetal reduction group, which was 76.05 (69.70–82.40) (F = 2.42, P = 0.12). However, after adjusting for parental age and maternal pre-pregnancy BMI, significant differences were observed between the two groups (F = 50.60, P < 0.001). Furthermore, we categorized the total number of DNMs into various genetic regions and found that the distribution of DNMs in genome sections varied. Notably, the number of DNMs per capita in intergenic and intronic regions was found to be the highest among all the groups. The average number of DNMs in intergenic regions was found to be 44.30 (40.47–48.13) in the multifetal reduction group and 30.80 (29.59–32.02) in the newborns (F = 3.72, P = 0.05). Similarly, the average number of DNMs in intronic regions was 29.84 (27.23–32.46) in the multifetal reduction group and 23.79 (22.84–24.74) in the newborns (F = 0.05, P = 0.83). After adjusting for parental age and maternal pre-pregnancy BMI, it was determined that the observed differences were statistically significant. The average number of DNMs in exonic regions was 1.89 (1.49–2.30) in the multifetal reduction group and 1.60 (1.45–1.75) in the newborns (F = 0.86, P = 0.35).There is no difference between groups in statistics. These findings are presented in Fig. 2; Table 2.
Fig. 2
The average number of DNMs catalogued between the multifetal reduction group and the newborns. (A) The occurrence of the average number of total DNMs, de novo SNVs and de novo indels in the two groups. The results revealed a statistically significant decrease in the average number of total DNMs and de novo indels in newborns (P < 0.001). (B). The distribution of various genome regions in total DNMs, de novo SNVs and de novo indels. The average number of total DNMs were significantly differences between the two groups in both intergenic and intronic regions. There were significantly differences in the number of de novo indels across all regions examined (P < 0.001). (C) The distribution of various mutation modes in de novo SNVs, specifically C > T, G > A, A > G, and T > C, was analyzed. No significant differences were noted in the frequency of base exchange between the two groups (P > 0.05). *** indicates P < 0.001
Table 2 The average number of DNMs catalogued between the multifetal reduction group and the newbornsDistribution of de novo SNVsAfter conducting phased DNMs in two cohorts, we proceeded to perform similar workflows on de novo SNVs and indels separately. Our findings revealed that tthe average number of de novo SNVs associated with the multifetal reduction group and the newborns was 49.89 (45.59–54.20) and 51.09 (49.22–52.96), respectively. Notably, no significantly differences were observed between the groups (F = 1.01, P = 0.32). Furthermore, we subdivided the total number of de novo SNVs into different genetic regions and found no significant difference between the groups.
Out of the various modes of mutation, the four primary types, namely, C > T, G > A, A > G, and T > C, demonstrated the highest frequency of occurrence, with frequencies of 9.84 (9.39–10.29), 9.95 (9.50-10.41), 7.17 (6.81–7.53), and 6.93 (6.57–7.29) per newborn, respectively. Similarly, with frequencies of 9.98 (8.89–11.07), 9.84 (8.58–11.1), 6.54 (5.71–7.38) and 6.39 (5.60–7.17) per fetus in the multifetal reduction group, respectively. There was no significant difference observed in the frequency of base exchange between the two groups.
The extant literature reports indicate a correlation between DNMs and paternal age. Our own observations, after adjusting for parental age and maternal pre-pregnancy BMI using a multivariable regression model, reveal a similar directionality between the two groups. These findings are presented in Fig. 2; Table 2.
Distribution of de novo indelsIt appears that indels occur at lower frequencies than SNVs, likely due to their larger size which collectively affects more base pairs. The average number of de novo indels among the multifetal reduction group and the newborns was 26.26 (23.27–29.05) and 5.17 (4.82–5.52) respectively, and a statistically significant difference was observed (F = 194.17, P < 0.001). The study also found significant differences in the number of de novo indels in intergenic, intronic, and exonic regions, which remained significant even after correcting for clinical background information. The multifetal reduction group had an average of 16.28 de novo indels in intergenic regions, 9.37 in intronic regions, and 0.49 in exonic regions. In contrast, newborns had averages of 2.63, 2.36, and 0.15, respectively. All comparisons were statistically significant (P < 0.001). These results are presented in Fig. 2; Table 2.
Parental characteristics when divided by the number of DNMs within the groupIn this study, we categorized the parental age and the maternal pre-pregnancy BMI within the multifetal reduction group or newborn group based on the number of DNMs, with the number of 60 as the cutoff point, to investigate whether there were any differences. Within the group of multifetal reduction, there was no statistically significant difference in parental age and the pre-pregnancy BMI between those with less than 60 DNMs and those with 60 or more DNMs. However, in the newborn group, The maternal age for the group with 60 or more DNMs was 33.14 (29.39–36.89), while the paternal age was 34.99 (30.16–39.82). This represented a significant increase in comparison to those individuals who had fewer than 60 DNMs (F = 4.09, P < 0.001; F = 4.67, P < 0.001, respectively) (Table 3).
Table 3 Comparison of parental characteristics devided by the number of DNMsCategorical on the pathogenicity of the DNMsNext, we conducted a variant interpretation using InterVar on all of the identified variants. Upon analysis, no significant differences were observed across all groups in terms of pathogenic and likely pathogenic mutations. The pertinent data are presented in Fig. 3, while cases harboring pathogenic or likely pathogenic mutations are enumerated in Table 4.
Fig. 3
The pathogenicity of DNMs catalogued between the multifetal reduction group and the newborns. Among the total DNMs and de novo indels, there were statistically significant differences in both variants of uncertain significance and benign results between the two groups (P < 0.001). However, no significant difference was observed in the five pathogenicity classifications of the de novo SNVs between the two groups (P > 0.05). *** indicates P < 0.001. Note P = Pathogenic; LP = Likely Pathogenic; B = Benign; LB = Likely Benign; VUS = Variant of Uncertain Significance
Table 4 Summary of pathogenic or likely pathogenic DNMs detectedAmong the total DNMs, 86.07% and 94.82% of the variants were interpreted as having uncertain significance in the multifetal reduction group and the newborn group, respectively (F = 447.77, P < 0.001). 13.56% and 4.73% of the variants were interpreted as benign, respectively (F = 487.05, P < 0.001). There were statistically significant differences in both variants of uncertain significance and benign results between the two groups. Among the de novo SNVs, there was no difference in the five pathogenicity classifications between the two groups. Among the de novo indels, 71.16% and 99.06% of the variants were interpreted as having uncertain significance in the multifetal reduction group and the newborn group respectively, with a significant difference (F = 598.09, P < 0.001). Additionally, 28.77% and 0.55% of the variants were interpreted as benign, respectively, also showing a significant difference (F = 622.987, P < 0.001).
留言 (0)