
記住我
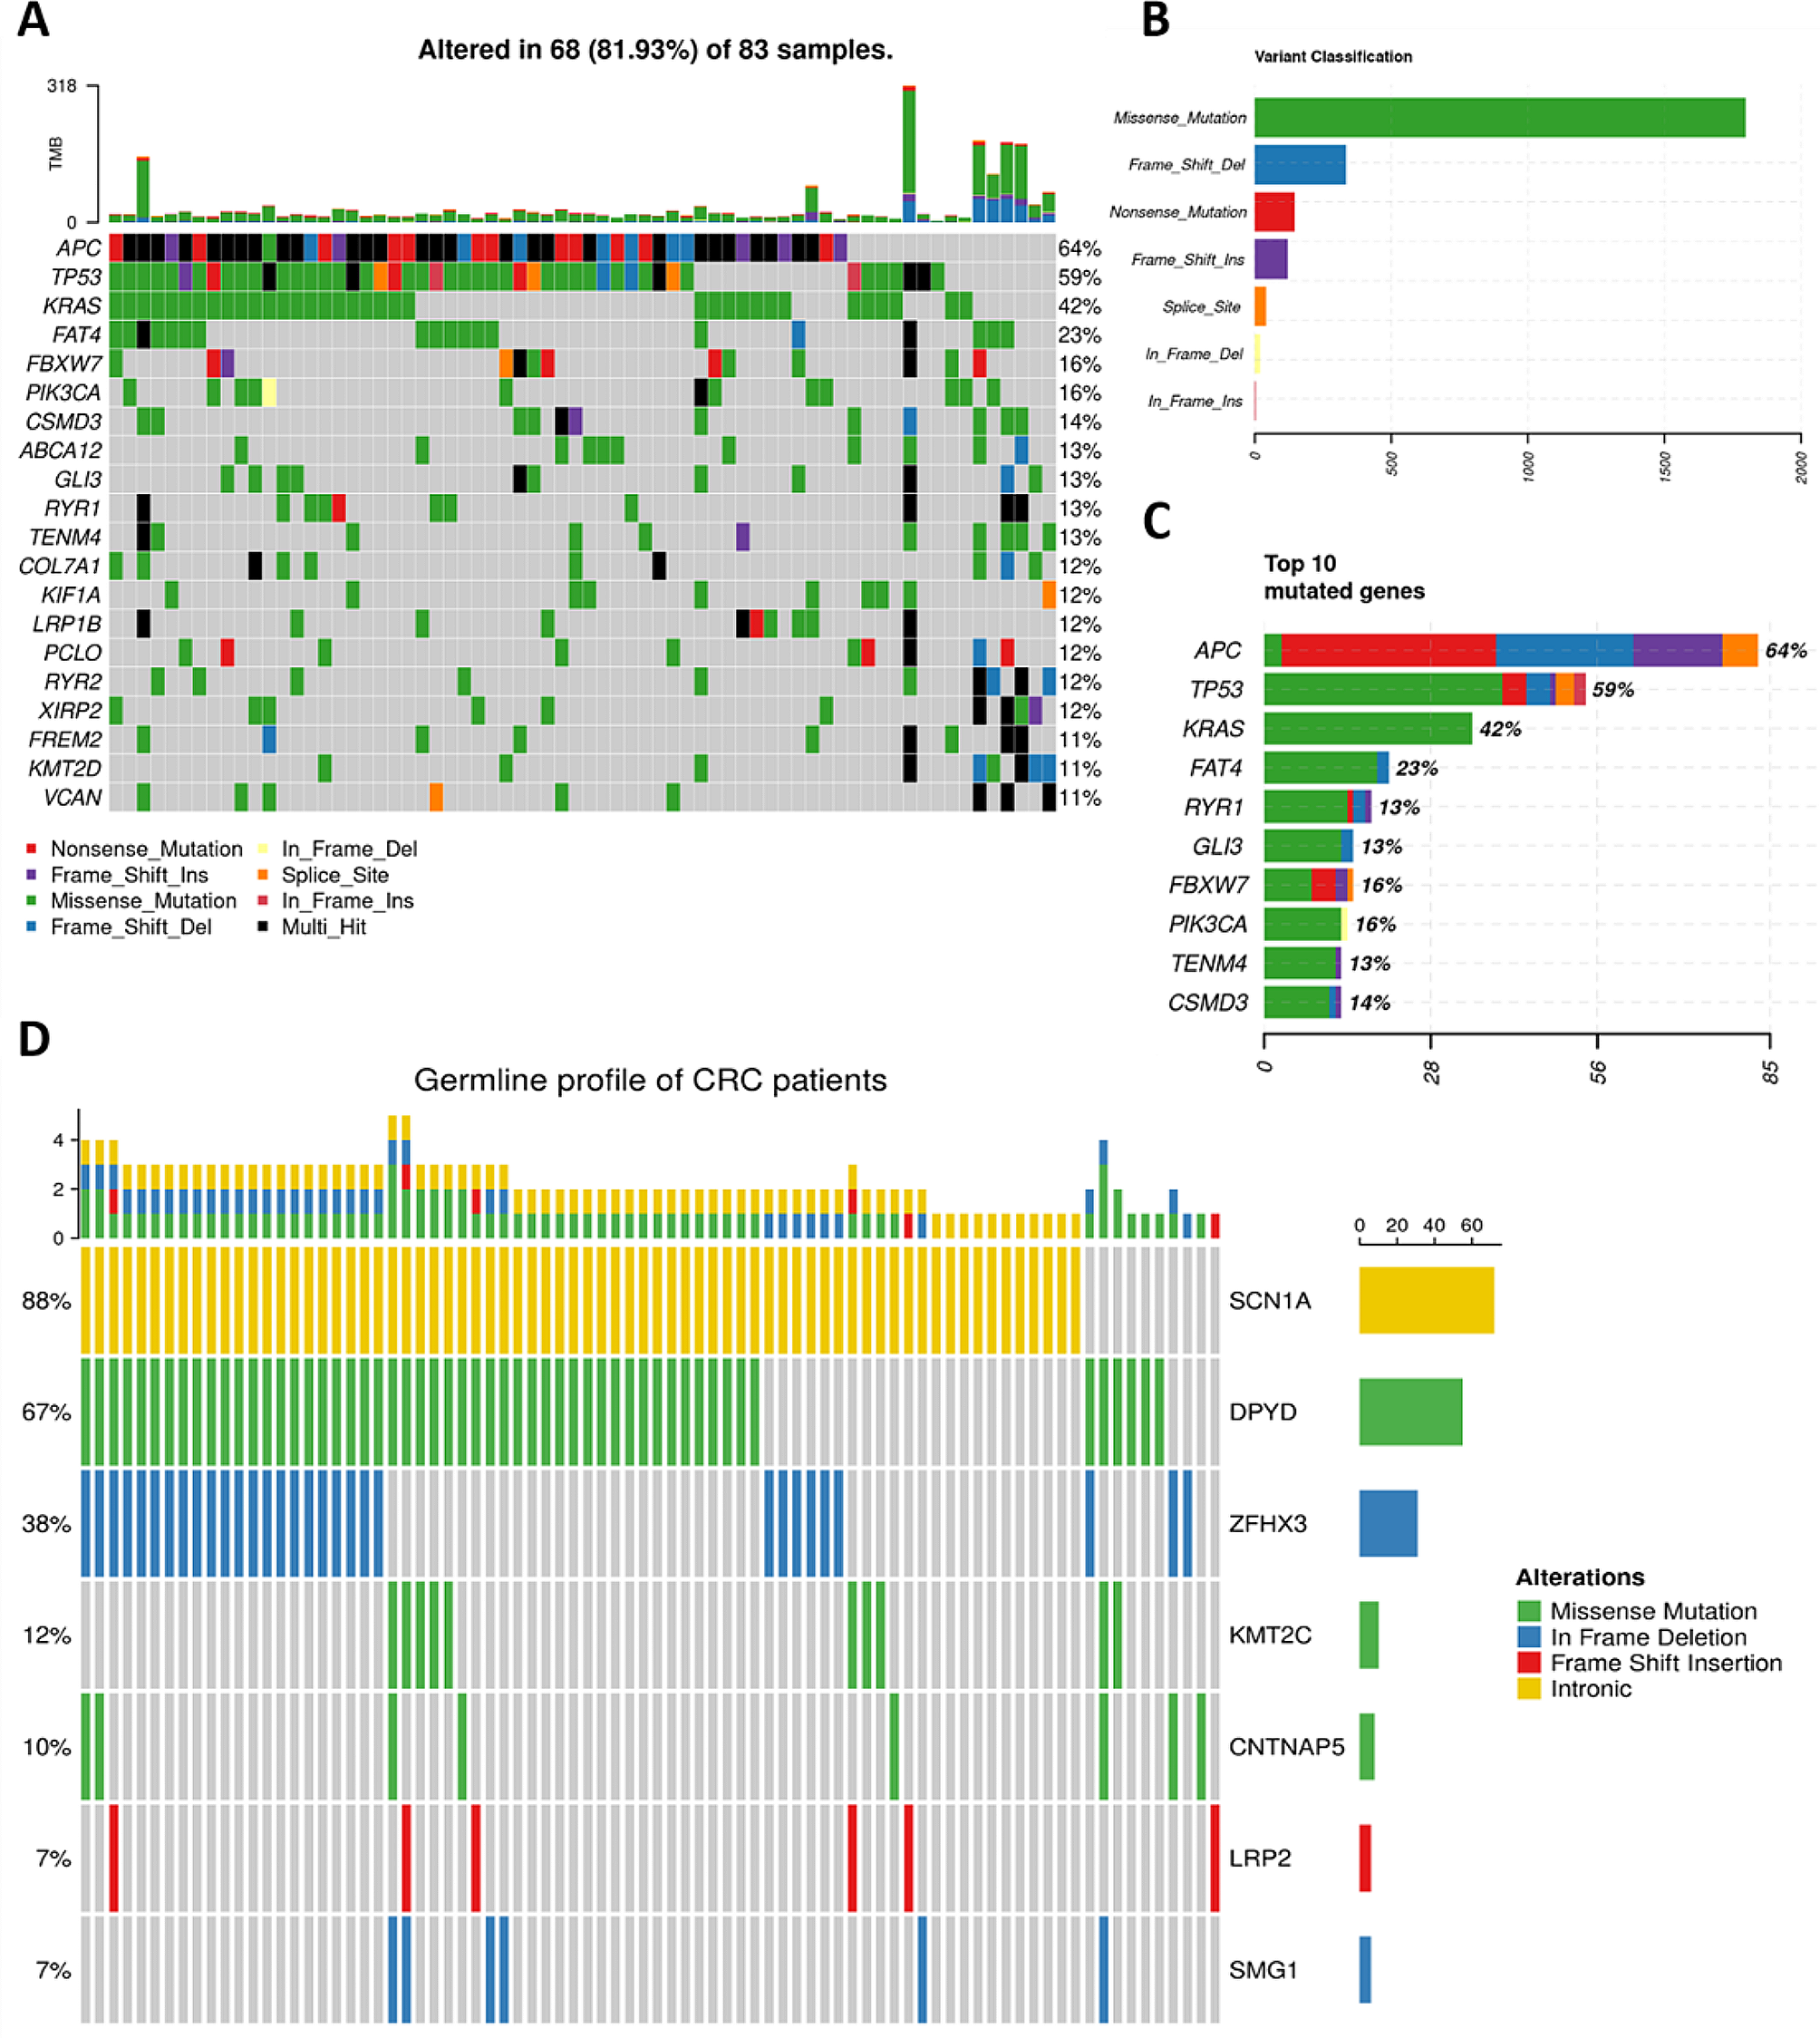
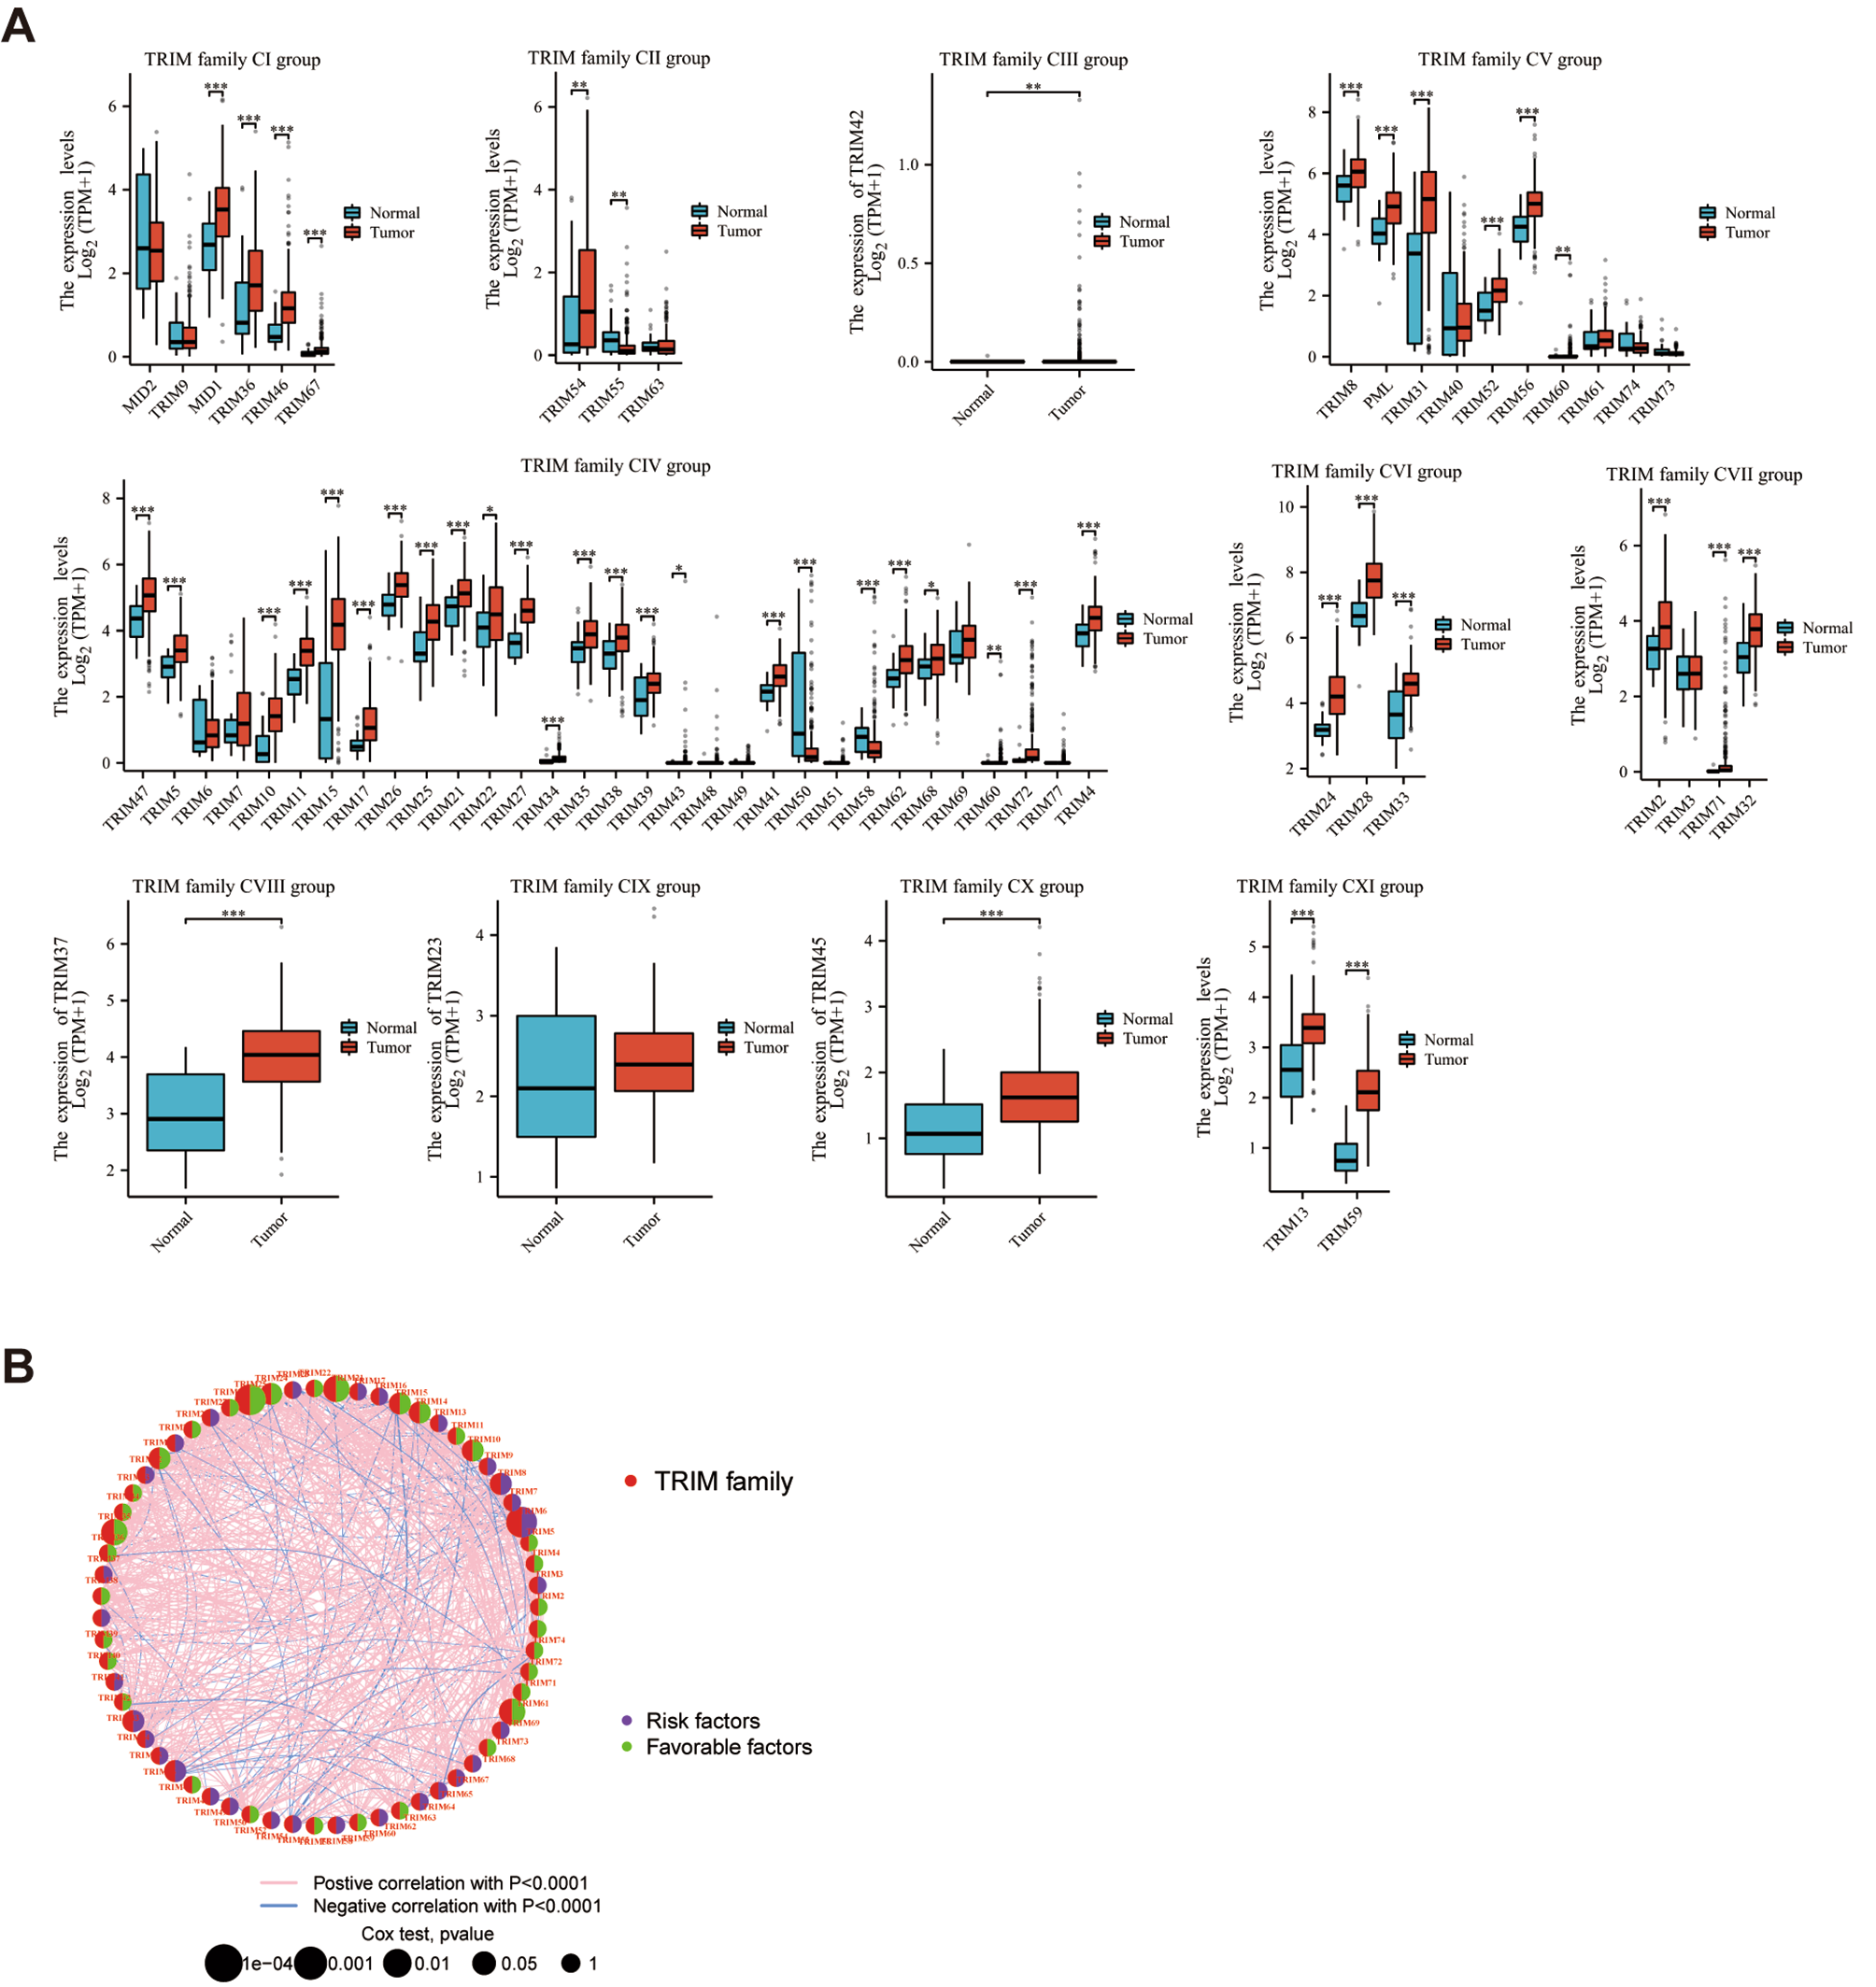
The merged RNA-Seq transcriptome data was defined as merged-matrix, which concluded 63 TRIMs. The expression level of TRIMs were displayed between STAD and normal samples from TCGA (Fig. 1A). The prognostic network diagram of the univariate Cox regression analysis of TRIMs was showed in Fig. 1B. There were 52 DEMs expressed differentially in STAD merged-matrix. The expression levels of 44 DEMs were significantly correlated with the OS according to the K-M analysis (Supplementary Figs. 1–2).
Fig. 1
mRNA expression profile and prognostic network of TRIMs. (A) The expression level of TRIM family CI-CXI groups between gastric STAD and normal tissues. MID1: TRIM18. MID2: TIRM1. PML: TRIM19. (B) The prognostic network diagram was drawn according to the results of Univariate Cox regression analysis between TRIM family members and OS of STAD. HR > 1 was defined as risk factors, and HR < 1 was favorable factors. ns, p ≥ 0.05; *p < 0.05; **p < 0.01; ***p < 0.001
Gene alteration profile, TF-gene-miRNA and PPI network of TRIMsThe alteration frequency of 7 TRIMs were above 2%, including TRIM9, TRIM51, TRIM71, TRIM26, TRIM46, TRIM37, and TRIM42. Missense mutation accounted for the majority of gene alteration (Fig. 2A). The increased copy number was discovered in 37 TRIMs, while the decreased copy number was discovered in 28 TRIMs (Fig. 2B). The PPI network of proteins coded by TRIMs was showed in Fig. 2C-D. Figure 2E and F displayed the TF-gene and gene-miRNA network of TRIMs, respectively.
Fig. 2
Gene mutation profile and interaction networks of TRIMs. (A) Visualization of the somatic mutation profile of TRIMs from 433 samples of TCGA-STAD. Genes are ordered by their mutation frequencies. The mutation frequency and number of samples for each gene are shown on the right. The bottom side shows information about the nucleic acid mutation sites and the type of mutation. (B) The CNV frequency of TRIMs. The values represented by the red circles indicated the gain frequency of the gene, while the green circles indicated the loss frequency. (C) The PPI network of TRIMs used Cytoscape software. The ordering of “Degree” is quantized using the size and color of the circle. Larger circles and darker colours represent stronger interactions. (D) The network of functional and physical protein associations of TRIMs by the STRING database with 0.400 interaction score. (E) The TF-gene interaction network constructed by the ENCODE database with the peak intensity signal < 500 and the predicted regulatory potential score < 1. Red circles represent TRIMs, blue squares represent transcription factors. The size of the red circle was positively related to the number of interacted TFs. (F) The gene-miRNA interaction network by the miRTarBase database. Red circles represent TRIMs, blue squares represent miRNAs. The size of the red circle was positively related to the number of interacted miRNAs.
Consensus clustering analysis of TRIMsThe optimal K value was determined to be K = 2 according to the consensus clustering analysis (Fig. 3A, Supplementary Fig. 3A-G, Supplementary Fig. 5A). STAD samples were divided into TRIM cluster A and TRIM cluster B (Fig. 3B). PCA analysis showed favorable discrimination between the two clusters (Fig. 3C). K-M analysis indicated better survival benefit of TRIM cluster B than cluster A (p = 0.021) (Fig. 3D). GSVA analyses showed glycosaminoglycan biosynthesis chondroitin sulfate, neuroactive ligand receptor interaction pathways were more enriched in cluster A. While proteasome, aminoacyl tRNA biosynthesis, RNA degradation, spliceosome, base excision repair were more enriched in cluster B (Fig. 3E). ssGSEA analysis showed that a variety of immune cells were more enriched in TRIM cluster A, including activated B cells, mature B cells, CD56 bright natural killer (NK) cells, MDSC, macrophage, mast cell, natural killer T cells, NK cells, plasmacytoid dendritic cells (DCs), T follicular helper cells (TFH), and Th1 cells. While, activated CD4 T cells, CD56 dim NK cells, neutrophil, and Th17 cells were more enriched in TRIM cluster B (Fig. 3F).
Fig. 3
The consensus clustering analysis and functional analysis. (A) When the value of k (representing the number of clusters) is set to 2, the consensus matrix is generated to describe the outcomes of the clustering. (B) Heatmap of the expression of TRIMs in TRIM cluster A and B with clinical characteristics (N stage, T stage, gender and age). (C) PCA of TRIM cluster A and B of GC patients. Visualization by the PCA analysis, mapping from high dimensions to two dimensions. (D) K-M analysis between TRIM cluster A and B. (E) The different enriched pathways between TRIM cluster A and B by the GSVA analysis. Enriched pathways were shown on the right. (F) Immune infiltration score of immune cells in TRIM cluster A and B by the ssGSEA analysis. The horizontal coordinates represented the different types of immune cells and the vertical coordinates represented the corresponding immune infiltration scores. GO (G) and KEGG (H) enrichment analyses conducted in the DEGs. The size of the circle represented the degree of enrichment. BP: Biological Process. MF: Molecular Function. CC: Cellular Component. (I) Heatmap of the expression of TRIMs in gene cluster A and B after the second consensus clustering analysis with clinical characteristics (N stage, T stage, gender and age). (J) K-M analysis between gene cluster A and B. ns, p ≥ 0.05; *p < 0.05; **p < 0.01; ***p < 0.001
818 DEGs were obtained from the differential expression analysis between TRIM cluster A and B. GO and KEGG enrichment analysis showed DEGs were most enriched in components and structure of extracellular matrix (Fig. 3G-H). Gene cluster A and B were obtained by consensus clustering analysis based on DEGs (Fig. 3I, Supplementary Fig. 3A-G, Supplementary Fig. 5B). Gene cluster A and B exhibited more pronounced prognostic disparities in comparison to TRIM cluster A and B (p < 0.001) (Fig. 3J). 38 TRIMs were differentially expressed between the two gene clusters (Supplementary Fig. 5C).
Prognostic model construction and scRNA-seq analysis based on hub DEGs7 DEGs were screened out by the LASSO regression, including RGS4, MYB, EDNRA, SLC27A2, TAGLN, HTRA1, and KRT7 (Supplementary Fig. 5D). 4 hub DEGs including RGS4, MYB, SLC27A2, and KRT7 satisfied the criteria of the multivariate Cox regression with p value < 0.05 and were selected as the model constituent genes. STAD samples from the merged-matrix were divided into a train set and a test set at a 1:1 ratio, and the train set was used to constructed the Cox regression model and nomogram (Fig. 4A). The calibration curve was close to the diagonal and the AUC of 1-, 3-, and 5-years ROC curve were 0.625, 0622, and 0.646 in all samples (Fig. 4B-C). The ROC curve with AUC of the predicted model was also obtained in train set and test set at 1, 3, and 5-year (Supplementary Fig. 5E-F).
Fig. 4
The nomogram based on the risk score and scRNA analysis of hub genes. (A) The survival rate at 1, 3, and 5-year of a sample from TCGA-STAD were 0.729, 0.387 and 0.255, respectively, according to the nomogram based on gender, age, risk score, T stage and N stage. (B) The ROC of the model and AUC at 1, 3, and 5-year. (C) Calibration curve of the model at 1, 3, and 5-year. (D) The t-SNE algorithm was used for dimensionality reduction and 5 cell subgroups were identified. (E) The expression of hub genes in 5 cell subgroups. ns, p ≥ 0.05; *p < 0.05; **p < 0.01; ***p < 0.001
The scRNA-seq data of our study was obtained from the GSM5101015 diffuse-type GC sample with 2234 cell samples. After unsupervised clustering, cell annotation and visualization of clusters, we identified 7 clusters as 5 kinds of cell subgroups: Cytotoxic cell, Endothelial cell, B cell, Fibroblast and Epithelial cell (Fig. 4D). RGS was verified expressed mainly in fibroblast cell subgroup (Fig. 4E).
High risk group displayed unfavorable survival outcome and impressive immune cell infiltrationThe formula of risk score was displayed as: risk score =(0.206021*RGS4) + (-0.09742*MYB) + (-0.24672*SLC27A2) + (0.107758*KRT7). ALL STAD samples were divided in to low- or high-risk group based on the median of risk score (Fig. 5A, Supplementary Fig. 6A-B). K-M analysis showed better survival in low-risk group (p < 0.001) (Fig. 5B, Supplementary Fig. 6C-D). 36 genes in TRIMs were differentially expressed between the two groups, and TRIM cluster A and gene cluster A had higher risk scores (p < 0.001) (Fig. 5C, Supplementary Fig. 6E). Sankey diagram showed the distribution of STAD samples between TRIM clusters, gene clusters, risk groups and clinical outcomes (Fig. 5D).
Fig. 5
Survival analysis and immune infiltration analysis between high-risk and low-risk groups. (A) The risk score, survival time and expression level of hub genes in high-risk and low-risk groups in all samples. (B) K-M analysis between high-risk and low-risk groups. (C) The risk score of TRIM cluster A was higher than TRIM cluster B. (D) The Sankey diagram displayed the distribution of the samples after twice consensus clustering analysis and risk score construction, as well as survival outcomes. (E) Stromal score, immune score and ESTIMATE score in high-risk and low-risk groups. (F) The correlation analysis in CD4 + memory T cells, mast cells and Tfh with risk score. R referred as the correlation coefficient. ns, p ≥ 0.05; *p < 0.05; **p < 0.01; ***p < 0.001
The stromal score and ESTIMATE score were higher in the high-risk group (Fig. 5E). Immune cell infiltration analysis showed the infiltration of resting mast cells, memory B cells, M2, monocytes, resting memory CD4 + T cells and Tregs were positively related to risk scores, while activated memory CD4 + T cells, TFHs, M0, M1, resting NK cells, and plasma cells were negatively related to risk scores. In particular, resting mast cells, activated memory CD4 + T cells, and TFHs were closely related to risk scores (|Spearman correlation coefficient| >0.2) (Fig. 5F, Supplementary Fig. 5F).
High risk group was connected with MSS/MSI-L status and higher IC50 of drugsPatients belong to the low-risk group had the tendency to present MSI-H status (Fig. 6A-B). Significantly statistical difference of IC50 of multiple drugs were displayed between high and low risk group. Higher IC50 of drugs (chemotherapy drugs: 5-Fluorouracil, cisplatin, cyclophosphamide, docetaxel, oxaliplatin, gemcitabine, irinotecan, paclitaxel, and so on; targeted drugs: afatinib, dabrafenib, erlotinib, gefitinib, lapatinib, sorafenib, and so on) was found in high group (Fig. 6C).
Fig. 6
Exploration of MSI status and drug sensitivity between high-risk and low-risk groups. (A) The relationship between MSI status and risk score. The risk score was with significant statistical difference between MSS and MSI-H, MSI-L and MSI-H. (B) The percent weight of different MSI status in high-risk and low-risk group. (C) The IC50 of 9 kinds of drugs in high-risk and low-risk group. ns, p ≥ 0.05; *p < 0.05; **p < 0.01; ***p < 0.001
TRIM31 was up-expressed on gastric tissues and indicated unfavorable clinical prognosis.
We found that the TRIM31 was overexpressed in STAD compared with the normal and paracancerous tissues (Fig. 7A). Patients with distance metastasis displayed higher TRIM31 expression (Supplementary Fig. 7A). The ROC curve indicated the favorable identification ability in GC of TRIM31 (Fig. 7B). In STAD samples, the OS of TRIM31 high expression group was better than that of TRIM31 low expression group (Fig. 7C). The N stage, age, primary therapy outcome and the expression level of TRIM31 were proved to be the independent prognostic risk factor of the multivariate Cox regression analysis, and were included to construct the prognostic model and the nomogram (Fig. 7D-E).
Fig. 7
Single-gene bioinformatics analyses of TRIM31. (A) The expression level of TRIM31 between STAD and normal tissue. (B) The ROC curve with AUC of the accuracy of TRIM31 for predicting outcomes in STAD. (C) K-M analysis between TRIM31-high and TRIM31-low groups. (D) The 1-, 3-, and 5-year nomogram was constructed based on independent risk factors of OS after Cox regression. (E) Calibration curve of the model at 1, 3, and 5-year. (F) K-M analysis between high TRIM31 IHC score and low score groups. (G-I) GSEA analysis on DEGs between TRIM31-high and TRIM31-low groups. (J-M) The IC50 of paclitaxel, cisplatin, docetaxel and 5-fluorouracil in TRIM31-high (G1) and TRIM31-low (G2) groups. ns, p ≥ 0.05; *p < 0.05; **p < 0.01; ***p < 0.001
The IHC score of STAD samples were significantly higher than paracancerous samples in tissue microarray chips (Table 1). Clinical characteristics of STAD patients in tissue microarray chips was shown in (Supplementary Tabel 1). TRIM31-low group was verified with longer survival time than TRIM31-high group based on the ICH score in STAD samples, the mOS was 39 m (95%CI 35-NA) and 31 m (95%CI 26–42) (P = 0.0471), respectively (Fig. 7F). IHC score of TRIM31, age, T stage and N stage were verified to be correlated with the overall survival of STAD patients in univariate Cox regression analysis and were submitted to multivariate analysis (Table 2).
Table 1 Differential expression of TRIM31 in cancer and paracancerous tissuesTable 2 Univariate and multivariate analyses of the factors correlated with Overall survival of STAD patientsDeep research on TRIM31 based on bioinformatics analysis7 mi RNAs and 25 TFs were verified to have interaction with TRIM31 (Supplementary Fig. 7B). DEGs between the TRIM31-high and TRIM31-low group were selected with the threshold mentioned before. 4424 positively and 1478 negatively co-expressed genes of TRIM31 were selected and the top 300 co-expressed genes were used to construct the PPI network (Supplementary Fig. 7C). We identified the top 9 enrichment items of BP, CC, MF, and KEGG pathways (Supplementary Fig. 7D). Cell cycle, oxidative stress and cell stress, and tumorigenesis related pathways were verified to be strongly connected with TRIM31 by GSEA analysis (Fig. 7G-I, Supplementary Fig. 7E). Especially, lower expression of TRIM31 was related with the activation of FOXO mediated transcription of oxidative stress. Moreover, immune cells including aDC, mast cells, NK cells, pDC, T helper, and Treg were positively related to TRIM31, while the stomal score was negatively related to TRIM31 (Supplementary Fig. 7F-G). Finally, we evaluated the relationship of the sensibility of GC common chemotherapy drugs and the expression of TRIM31. IC50 of 5-Fluorouracil and paclitaxel were negatively related to TRIM31, while cisplatin and docetaxel were positively related to TRIM31 which indicated that the expression of TRIM31 may serve as a biomarker of sensibility of chemotherapy in GC patients (Fig. 7J-M).
Knockdown of TRIM31 inhibited the growth of GC cellsWe know that TRIM31 is highly expressed in GC tissue based on prior immunohistochemistry data. We further look into the biological function of TRIM31 in GC via in vitro research. First, we compared the levels of TRIM31 protein expression in GES-1, AGS, MKN7, SGC7901, and NCI-N87 cell lines. The findings revealed that the protein expression level of TRIM31 in AGS cells was significantly higher than in the GES-1 cells (Fig. 8A). As a result, we chose AGS cells as the experimental subjects in the following investigations.
Fig. 8
Functional validation of TRIM31 in vitro experiments. (A) Western blot revealed TRIM31 expression levels in GES-1, AGS, MKN7, SGC7901, NCI-N87 cell lines (n = 3). (B) TRIM31 protein expression was evaluated by western blot in AGS cells silenced by TRIM31-sh1, TRIM31-sh2, and TRIM31-sh3 (n = 3). (C) AGS cell lines cloning after lentivirus treatment (shControl, TRIM31-sh3). The absorbance of the solution generated by dissolving the cell population in glacial acetic acid represents the number of cell clones (n = 4). (D) Cell viability of AGS cell lines treated with lentivirus (shControl, TRIM31-sh3) was determined (n = 3). (E) EDU staining was used to detect the potential of AGS cells to proliferate. Scale bar: 100 μm. (F) Determination of migration ability of AGS cell lines treated with lentivirus (shControl, TRIM31-sh3) (n = 3). Scale bar: 100 μm. (G) Evaluate the oxidative stress level of AGS cell lines treated with lentivirus (shControl, TRIM31-sh3) by DCFH-DA staining (n = 3). Scale bar: 100 μm. (H) Evaluate the mitochondrial function of AGS cell lines treated with lentivirus (shControl, TRIM31-sh3) by JC-1 staining. Scale bar: 100 μm. (I) Western blotting was used to assess CyclinD1 and CDK2 levels in AGS cell lines treated with lentivirus (shControl, TRIM31-sh3) (n = 3). ns, p ≥ 0.05; *p < 0.05; **p < 0.01; ***p < 0.001
We are going to inject the lentivirus into AGS cells in order to create a stably transfected cell line with decreased TRIM31 protein. Western blot was utilized to test the efficacy of lentivirus infection, and it was discovered that the decrease in TRIM31 expression in TRIM31-sh3 AGS cells was the most significant (Fig. 8B). Following that, we assessed the proliferative potential of TRIM31-sh3 AGS cells and discovered that TRIM31 knockdown resulted in a decrease in cell proliferative ability (Fig. 8C). The similar result was observed when we utilized EDU staining to measure cell proliferation ability (Fig. 8E). It is worth mentioning that the reduction in cell viability caused by TRIM31 knockdown is not considerable (Fig. 8D). Additionally, we assessed the TRIM31-sh3 AGS cells’ capacity for migration and discovered that this capacity declined after TRIM31 knockdown (Fig. 8F). The rise in ROS levels in cells following TRIM31 knockdown, a sign of increased oxidative stress, is exciting (Fig. 8G). The data from JC-1 staining further revealed that TRIM31 knockdown impacted the mitochondrial activity of cells (Fig. 8H). Furthermore, western blot analysis revealed a decrease in CyclinD1 and CDK2 protein expression in TRIM31 knockdown cells (Fig. 8I).
留言 (0)