
記住我
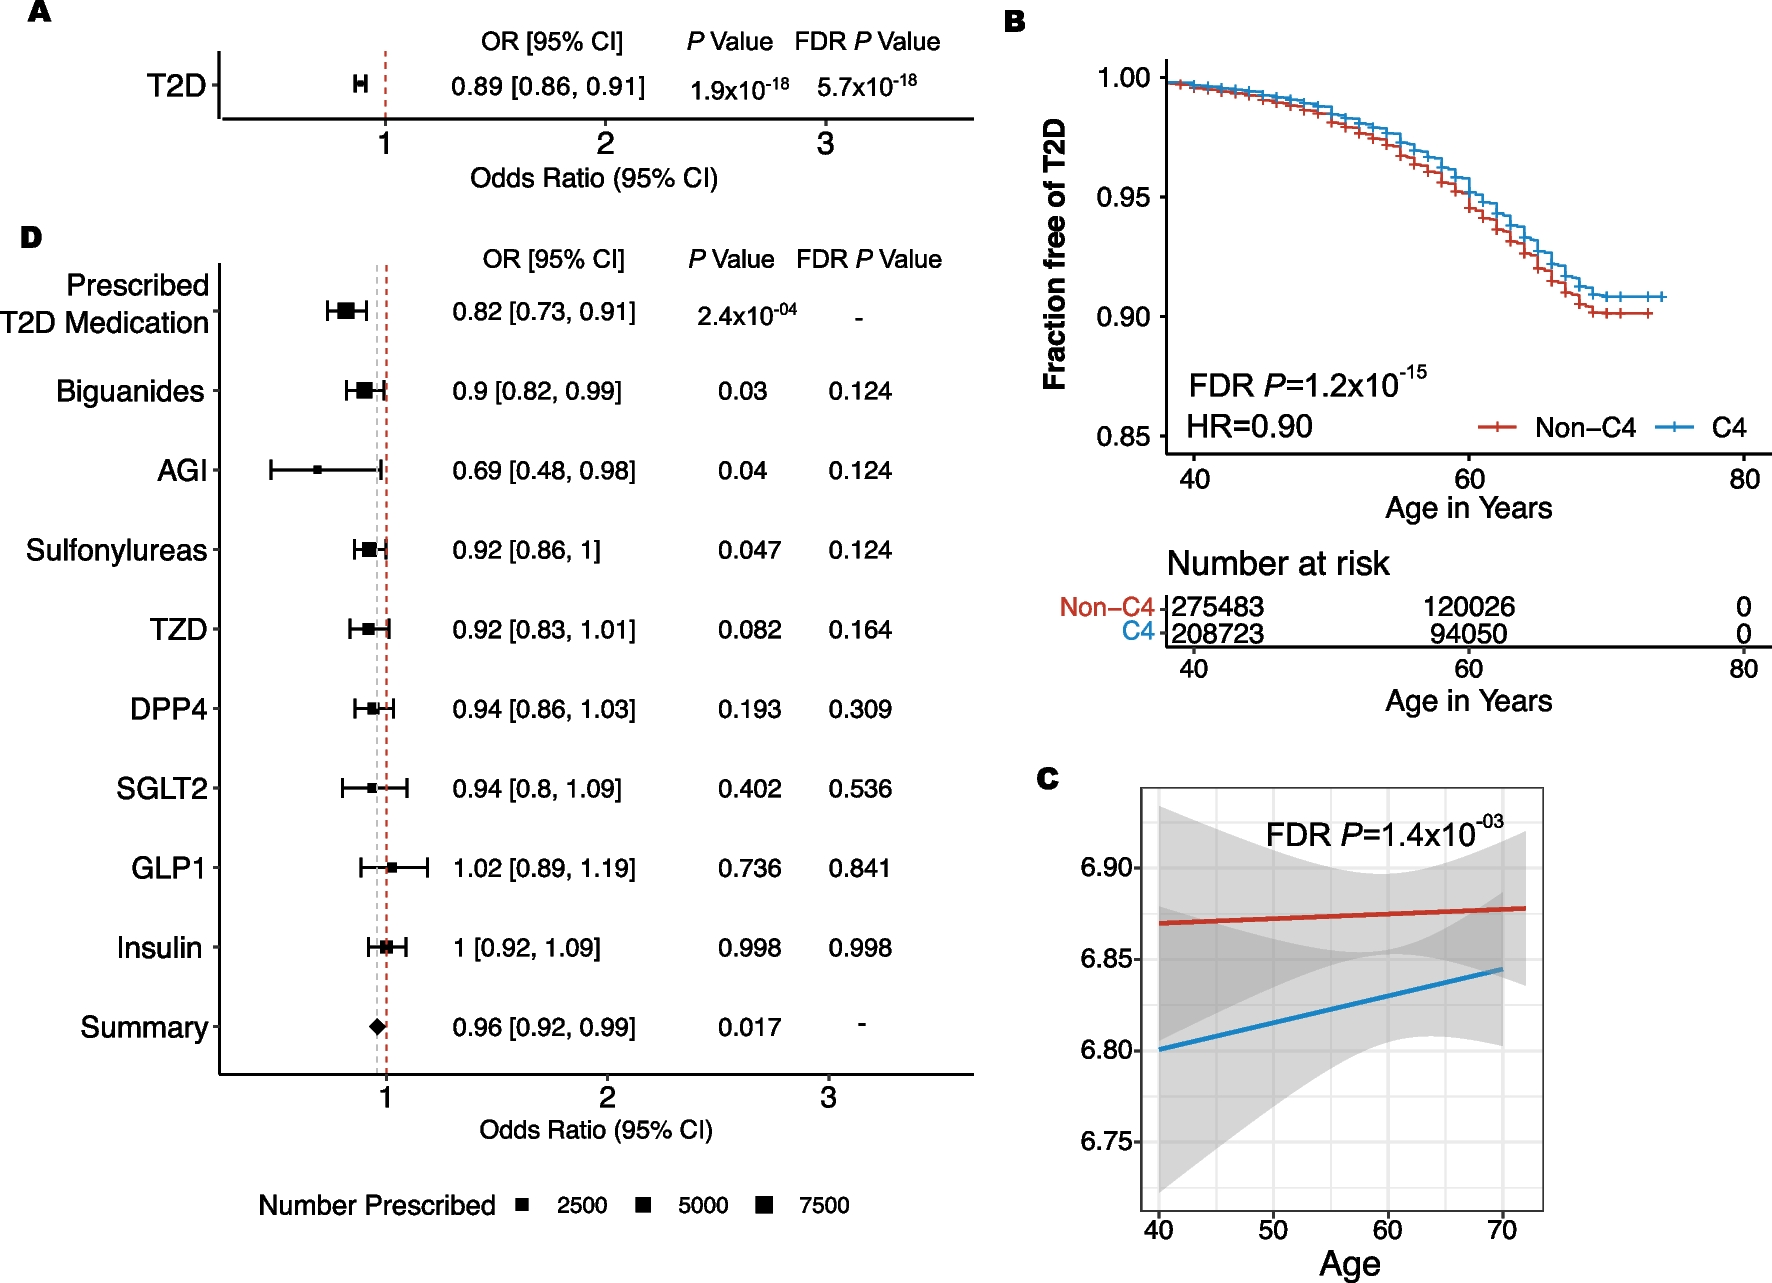
In the UKBiobank, 43.06% of the entire cohort (C4 = 210,152/488,001), and 40.06% of individuals with T2D (C4 = 9927/24,580), were classified as C4 using the UKB sctPS (UKBiobank recalibrated sctPS). In the UKBiobank, C4 individuals were less likely to be diagnosed with T2D (P = 1.89 × 10⁻¹⁸, OR = 0.89, C4 with T2D = 9927(4.7%), non-C4 with T2D = 14,653(5.3%) (Fig. 1A). Among the 24,580 individuals with T2D, the C4 subgroup was diagnosed at a slightly later age than the non-C4 group (FDR P = 8.44 × 10⁻¹⁶, HR = 0.90) (Fig. 1B). The C4 subgroup also had a lower HbA1c (mg/dL) (FDR P = 1.44 × 10–03, Beta = − 0.05) at the time of their first appointment (Fig. 1C).
Fig. 1
Associations of C4 with T2D Outcomes. A C4 compared to non-C4 using a generalized linear model to test associations with type 2 diabetes (FDR P = 5.7 × 10⁻¹⁸). B Time to T2D diagnosis was assessed using a Cox proportional hazard model (FDR P = 1.2 × 10⁻¹⁵). C HbA1c was compared between C4 and non-C4 using linear regression (FDR P = 1.4 × 10–03). D C4 individuals are less likely to be prescribed T2D medications (P = 2.3 × 10⁻⁴, OR = 0.82)
The UKBiobank is comprised of 94% white individuals, whereas the ACCORD trial was 62% white. The UKB sctPS was calibrated on the entire ACCORD cohort. While 40.06% of individuals with T2D in the UKBiobank were predicted to be C4, in the full ACCORD cohort, only 31.71% of individuals were predicted to be C4. However, when the ACCORD cohort was subset by white race and the UKB sctPS was applied, 42.48% of individuals were predicted to be C4.
ACCORD and UKBiobank CVD outcomes using recalibrated SCT PSWhen the UKB sctPS was applied to the original ACCORD cohort, among all C4 individuals, the intensively treated test and training sets showed decreased risk cardiac outcomes when compared to those receiving standard care (Training P = 2e10−5, Test P = 0.002) (Supplementary Fig. 2) this decreased risk was also observed in the white C4 cohort (Training P = 3e10−6, Test P = 0.004) (Supplementary Fig. 3). Among all the individuals in the standard glycemia arm in ACCORD, there were no statistically significant differences in adverse events between predicted C4 and non-C4 groups using the original PS [2]. However, using the UKB sctPS, the predicted C4 group showed marginal increases in coronary heart disease (P = 0.03), macrovascular events (P = 0.002), and fatal myocardial infarction (MI) (P = 0.042) on standard glycemia treatment (Supplementary Fig. 4).
In the UKBiobank, of the 23,067 individuals with T2D and ICD codes available in the UKBiobank, 9332 were predicted to be C4. Within this subset, no associations were observed between the C4 subtype and time to CVD event (Supplementary Table 5).
C4 is associated with fewer prescriptions for T2D medicationsMedication data was available for 10,990 individuals diagnosed with T2D in the UKBiobank (C4 = 4524). Based on these records, fewer C4 individuals were prescribed T2D medications when compared to non-C4 individuals (P = 2.3 × 10⁻⁴, OR = 0.82) (Fig. 1D). Of the individuals in the C4 subgroup that were prescribed T2D medications, there was no significant difference in the number of unique medications prescribed, compared to the individuals in the non-C4 group (Supplementary Table 6). There were no significant differences between individual classes of T2D medication, including insulins, biguanides, sulfonylureas, AGIs, DPP4 inhibitors, GLP1 inhibitors, SGLT2 inhibitors or TZDs after multiple hypothesis correction (FDR > 0.05). However, a meta-analysis of these associations showed a significant decrease across the prescription classes (P = 0.017) (Fig. 1D).
MAS1 and IGF2R SNPs are associated with C4Combined Annotation Dependent Deletion (CADD) scores for the 37 SNPs assessed in this study ranged from 0.001 to 22.5 (mean = 3.84 and median = 2.23) (Supplementary Table 7). Four SNPs in MAS1 and 20 SNPs in IGF2R were significantly associated with C4 (P < 0.05) (Fig. 2A, Supplementary Table 7). IGF2R and MAS1 SNPs were not significantly associated with T2D occurrence, time to T2D diagnosis, nor HbA1c (FDR < 0.05) (Supplementary Tables 8–9).
Fig. 2
Associations of MAS1 and IGF2R SNPs with C4 and T2D Prescriptions. A IGF2R and MAS1 SNPs significantly associated with C4, colored by the odds ratio. B Odds ratio describing the likelihood of being prescribed any T2D medications for each SNP colored by the association with the C4 subtype
IGF2R SNPs are associated with an increased risk for CVD outcomesIGF2R SNPs rs635551 C and rs8191871 T were associated with an increased risk of CVD (FDR P = 0.02, OR 1.068) and an increased risk of MI (FDR P = 0.04, OR = 1.15), respectively (Supplementary Table 10).
MAS1 and IGF2R SNPs are associated with T2D prescription patternsFour IGF2R SNPs associated with C4 were significantly associated altered likelihood of being prescribed T2D medications (P < 0.05) (Fig. 2B). Furthermore, of the individuals who were prescribed T2D medications, two MAS1 SNPs and six IGF2R SNPs were also significantly associated with differences in the number of unique T2D medication prescriptions. (Supplementary Table 11).
Those with T allele for MAS1 rs220721 were less likely to be prescribed sulfonylureas (FDR P = 0.04, OR = 0.91) and those with the G allele of IGF2R rs8191754 were more likely to be prescribed biguanides (FDR P = 0.04, OR = 1.15) (Supplementary Table 12).
留言 (0)