Characterization and preparation of ZnO NPs
After the sonication of ZnO NPs, the following experiments were performed to characterize the material properties. The physical appearance and size of ZnO NPs powder (CAS677450-5G, Sigma-Aldrich, USA) was evaluated using the transmission electron microscope (TEM, TECNA12 microscope, FEI, USA) and field emission scanning electron microscope (SEM, ULTRA55 microscope, ZEISS, GER). The zeta potential of ZnO NPs in serum, EC culture (early chick culture) and medium was measured by electrophoretic light scattering (ELS) while the hydrated particle size were assessed by dynamic light scattering (DLS), both with a Zetasizer Nano ZS instrument (Malvern Instruments Ltd, UK). The crystal structure and specific surface area of ZnO NPs were determined by X-ray powder diffractometer (XRD, Thermo Fisher, USA) and Micromeritics ASAP 2010 M + C instrument (Micromeritics Co., GA, USA), respectively. ZnO NPs were prepared into a nanoparticle suspension of the desired concentration using distilled water, physiological saline (0.9%) or Dulbecco’s Modified Eagle’s Medium (DMEM, C11995500BT, Gibco, USA). Ultrasonic vibration was performed with an ultrasonic cleaning instrument (JP-040, CGOLDNWALL, JPN) for 1 h, followed by subsequent animal and cell experiments respectively.
Determination of free Zn
2+concentration
Inductively coupled plasma mass spectrometry (ICP-MS, Invitrogen, Germany) was utilized to determine the concentration of Zn2+of ICR mice placenta and embryos. Briefly, the tissue was placed in concentrated nitric acid overnight, followed by digestion with 30% hydrogen peroxide at 200 °C. The resulting digestion liquid was cooled and centrifuged at 10,000 rpm for 5 min to collect the supernatant, which was then analyzed using ICP-MS. To assess the solubility of nanoparticles in liquid, ZnO NPs were added to DMEM and subject to sonication for 1 h. The resulting suspension was placed in a 37 °C cell culture incubator. At predetermined time intervals (0, 2, 4, 6, 8, 12, 24 and 48 h), the supernatant was collected after centrifugation at 10,000 rpm for 5 min, and Zn2+ concentration was assessed using ICP-MS.
ZnO NPs exposure animal model
8-weeks-old ICR mice were purchased from Guangdong Medical Laboratory Animal Center (Guangdong, China). The mice were placed in a 21–22 °C environment for a 12-h light/dark cycle and ad libitum access to food and water. Following this, the male and female mice were caged together for 1 day. Pregnancy in the female mice was determined according to the presence of vaginal plugs on the second day’s morning. Pregnant mice were allocated into distinct groups using randomization techniques (N = 6): the saline group, 5 mg/kg, 10 mg/kg and 20 mg/kg ZnO NPs group. Pregnant mice were injected with different concentration of ZnO NPs into the tail vein on embryonic days E5.5, E7.5 and E9.5 respectively. On E10.5, the mice were anesthetized with pentobarbital and subsequently euthanized. The placenta and embryos were harvested for subsequent experiments (Supplementary Fig. 1A).
Fertilized Leghorn eggs were purchased from the South China Agriculture University (Guangdong, China) and were subjected to place in a humidified incubator (Yiheng Instrument, Shanghai, China). The incubator was set to a temperature of 38 °C and a humidity level of 70% until the chicken embryo reached desired stage. It should be emphasized that the developmental stages of chicken embryos are usually delineated according to the Hamburger and Hamilton (HH) staging, which provides a reference and standard for identifying various important stages involved in early neurogenesis of chicken embryo (Bluemel et al. 2021; Misske et al. 2007). Specifically, HH0 is the first few hours of incubation and the embryo at this period is basically fertilized eggs. When incubated to HH4-HH5 (16–22 h), the embryo develops into a gastrula. At this time, the notochord stimulates the ectoderm to differentiate into neuroectoderm and leads to the formation of neural plate. The lateral edges of both ends of the neural plate then gradually rise, forming neural folds when they develop to HH6-HH7 (23–26 h). Afterwards, the neural folds at both ends continue to approach and encounter at the midline, and merge into the neural tube at HH10-HH11 (33–45 h). Therefore, to more clearly observe the effects of ZnO NPs on various important stages of early embryonic neural development. HH0 chicken embryos were subjected to incubated in EC culture at a temperature of 38℃ within a humidified environment, experiments were conducted both with and without the presence of ZnO NPs (12.5, 25 and 50 μg/ml) or 5 mM N-acetylcysteine (NAC) until HH10. We observed chicken embryos in each group at HH0, HH4, HH7 and HH10 and the surviving embryos (N ≥ 12 embryos in each group) were harvested at the HH10 stage for the evaluation of morphology in the developing embryonic neural tubes, including the distance of approaching neural folds, the area of approaching neural folds and the rostral-caudal distance of closing neural folds. The modeling method of chicken embryos exposed to ZnO NPs described above is presented in Supplementary Fig. 1B in the form of a schematic diagram.
Whole-mount embryos immunofluorescent staining
The immunofluorescent staining was conducted on whole-mount chicken embryos according to established protocols (Song et al. 2020; Yahya et al. 2021). Following incubation, the embryos were collected and preserved in 4% PFA at 4℃ overnight. Subsequently, the fixed chicken embryos were exposed to primary antibodies (Pax7, 1:500, AB528428, DSHB, USA) at 4℃ on a shaker for an overnight incubation. Following thorough rinsing in PBST (0.1% Tween-20), the embryos were incubated with Alexa fluor 555 secondary antibodies (1:1000, Invitrogen, USA) on a shaker overnight at 4℃. DAPI (1:1000, Invitrogen, USA) was used for counterstaining all embryos for an hour and imaged using a Leica M205FA fluorescence stereo microscope.
RNA sequencing (RNA-seq) transcript profiling
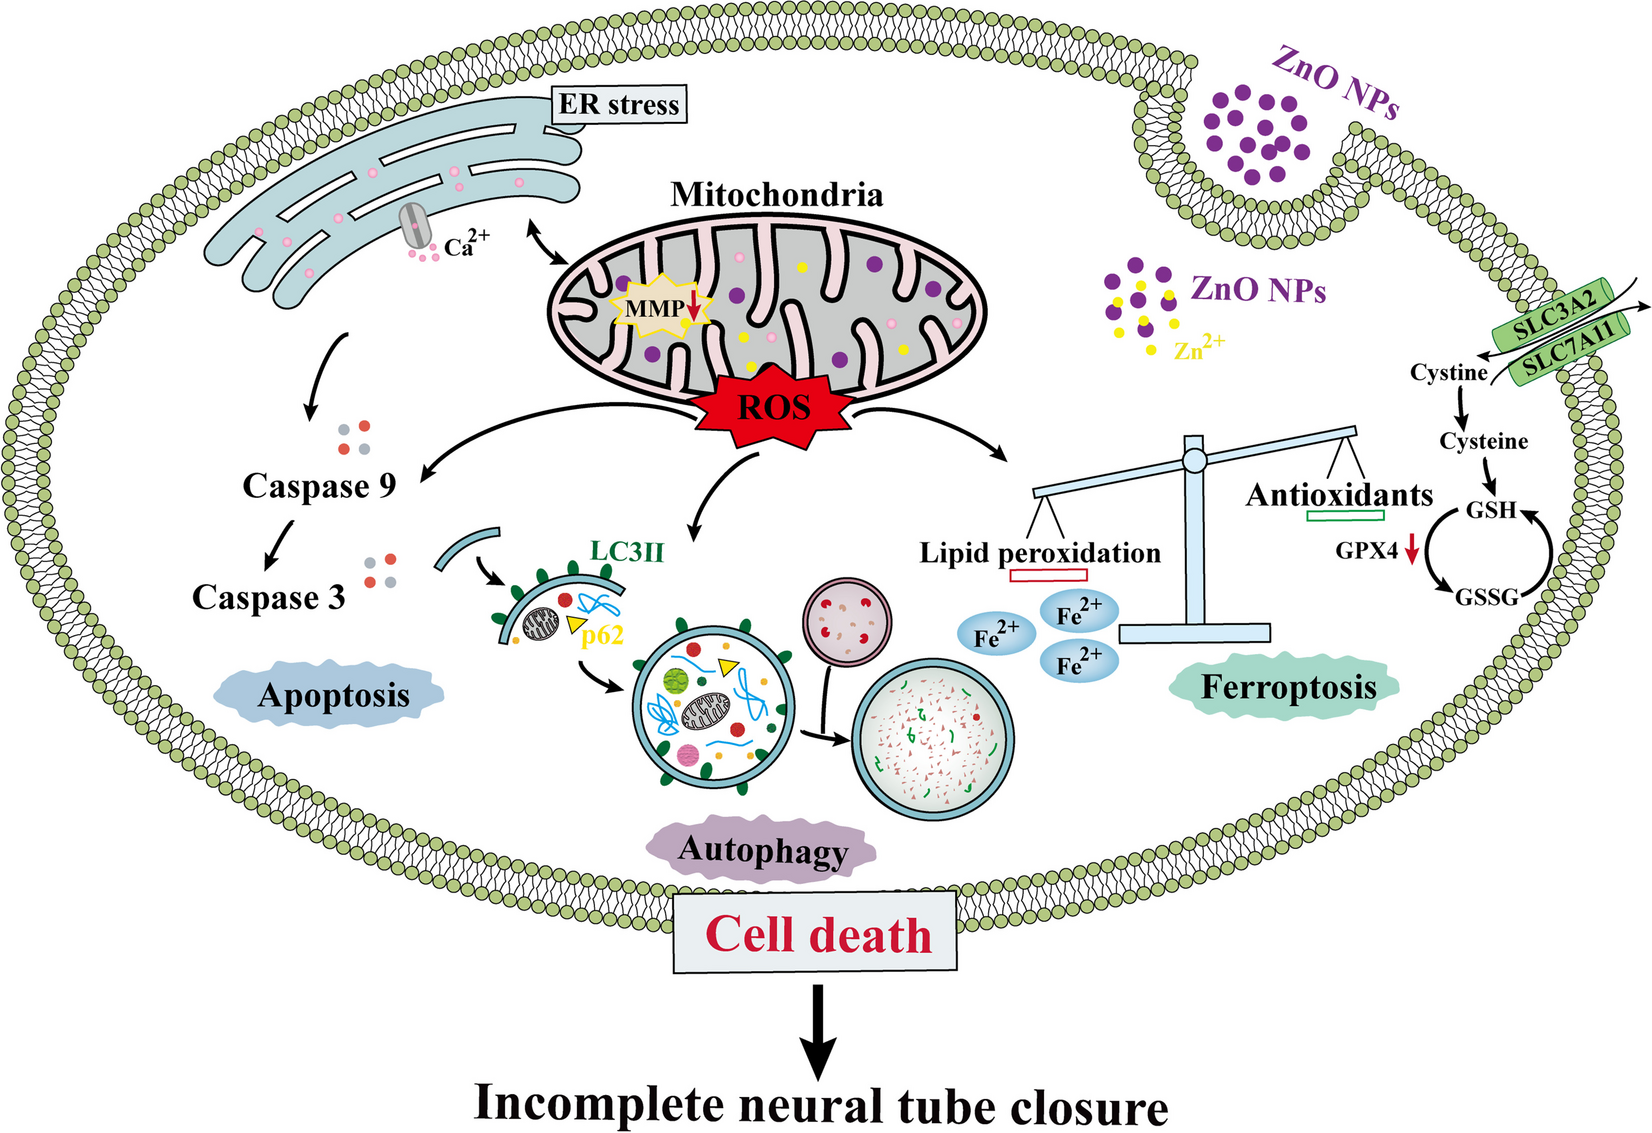
The embryos of HH10 chickens in both the control group and the group treated with 50 µg/ml of ZnO NPs were collected and sequenced by Novogene Bioinformatics Technology Co., Ltd (Guangdong, China) to detect differentially expressed genes (DEGs) between the two groups. DEGs with |log2 fold change (FC)|> 1 and p-value < 0.05 were considered to be significantly differentially expressed genes. The RNA-seq data obtained from this analysis were subsequently submitted to the Gene Expression Omnibus (GEO) database and the GEO number is GSE121507. The raw image data files acquired from high-throughput sequencing were processed using CASAVA base identification analysis to generate original sequencing sequences. The outcomes were saved in FASTQ file format, encompassing the sequence data (reads) and associated sequencing quality information. Rigorous quality control measures were implemented on the sequencing data, ensuring a sequencing error rate of less than 1% per base position and removing adapters and low-quality reads. After reference sequence comparison analysis, gene expression level analysis and overall quality assessment, the DEGs between the two groups were obtained, and then heatmap and GO enrichment analysis were generated using the Seurat R package (version 5.0.1), and protein–protein interaction (PPI) analysis was performed using the STRING software.
Cell culture
We used SH-SY5Y cells (ATCC, USA) as a model for in vitro experiments. SH-SY5Y cells are considered an ideal in vitro model for neurotoxicology studies because of their neurogenic characteristics and ability to differentiate into neuron-like cells (Hoffmann et al. 2023; Lopez-Suarez et al. 2022). Cells were maintained in DMEM containing 10% fetal bovine serum (16410071, Gibco, USA), 100units/ml penicillin and 100 μg/ml streptomycin (15140122, Gibco, USA) in the incubator set at 37℃ with a 5% CO2 concentration and passaged every two days.
Cell viability test
Cell viability was evaluated utilizing Cell Counting Kit-8 (CCK8, ab228554, Abcam, UK) following established protocols (Liu et al. 2020). Briefly, cells were plated in 96-well dishes (1.5 × 10³ cells/cm2) and were treated with or without the presence of 300 µM ZnCl2, ZnO NPs (2.5, 5, 12.5, 25 and 50 µg/ml), deferoxamine (DFO, 1, 5, 10, 50, 100, 200 µM) or NAC (0.5, 1, 2, 5, 10 and 20 mM). After incubation (2, 4 and 6 h), 10µL of CCK-8 working reagent (5 g/L) was added to the wells of the 96-well dishes and incubated for an additional 4 h at 37℃. Absorbance values were taken at a wavelength of 450 nm utilizing the Bio-Rad 450 microplate reader (Bio-Rad, CA, USA).
Transmission electron microscopy of SH-SY5Y cells
SH-SY5Y cells were cultured in 25cm2 cell culture flasks at a concentration of 8 × 10⁴ cells/cm2. Cells were cultured with DMEM with or without the presence of ZnO NPs (12.5, 25 and 50 μg/ml) for 6 h after the cell density reached 80%. Subsequently, the cells in each group were subjected to three washes with PBS, followed by digestion with trypsin and centrifugation at 1,000 rpm for 5 min. The supernatant was then discarded to collect cells (about the size of half a mung bean). Cells were fixed in 0.1 mol/L PBS containing 2.5% glutaraldehyde for 2 h, and then dehydrated, embedded, sectioned, and stained in the same manner as in vivo experiments. Subsequently, the cell mitochondria alteration and autophagosome were examined using TEM.
Cell immunofluorescent staining
Cell immunostaining was performed as previous reported (Yan et al. 2021). Briefly, cells were cultured in 6-well dishes (5 × 10³ cells/cm2) and were subjected to the treatment with or without the presence of 300 µM ZnCl2 or ZnO NPs (12.5, 25 and 50 µg/ml) for 6 h. Cells were then harvested and fixed overnight in 4% PFA at 4℃. Cells were subjected to immunostaining using specific antibodies: LC3 (Microtubule-associated protein 1A/1B-light chain 3, 1:500, ab192890, Abcam, UK), p62 (sequestosome 1, 1:500, AP2183B, Abcepta, USA), GPX4 (Glutathione peroxidase 4, 1:200, DF6701, Affinity biosciences, China), FTL (Ferritin light chain, 1:200, DF6604, Affinity biosciences, China), SLC7A11 (Solute carrier family 7 member 11, 1:200, DF12509, Affinity biosciences, China). In summary, cells were subjected to overnight incubation with primary antibodies at 4℃ on a shaker, followed by thorough rinsing in PBST (0.1% Tween-20). Subsequently, the cells underwent overnight incubation with Alexa fluor 555 or 488 secondary antibodies (1:1000, Invitrogen, USA) at 4℃ on a shaker. The cells were then stained with DAPI (1:1000, Invitrogen, USA) for an hour before being imaged using an Olympus IX51 inverted fluorescent microscope.
Flow cytometry-based detection of apoptosis
To assess apoptosis rates and ROS levels in SH-SY5Y cells, we used an Annexin V-FITC apoptosis kit (88–8005-72, Thermo Fisher, USA) conducted the analysis through flow cytometry. The cells (8 × 10⁴ cells/cm2) were inoculated into 6-well dishes overnight and then exposed to 300 µM ZnCl2, ZnO NPs (12.5, 25 and 50 μg/ml) or 5 mM NAC for 2, 4 or 6 h. Subsequently, the cells were digested with trypsin and centrifuged at 1,000 rpm for 5 min, 5μL annexin V-FITC and 5μL PI (50 μg/mL) were included to mix with cells. After vortex, the cells were subjected to incubation at room temperature for 20 min and analyzed utilizing a FACS-can flow cytometer (Becton–Dickinson, San Jose, USA). Flow cytometry detection results are presented as fluorescence intensity scatter plots: the lower left quadrant, lower right quadrant, upper right quadrant and upper left quadrant are viable cells, early apoptotic cells, late apoptotic cells and necrotic cells respectively.
Reactive oxygen species (ROS) detection
The cells were plated in 6-well dishes (8 × 10⁴ cells/cm2) and exposed to 300 µM ZnCl2, ZnO NPs (12.5, 25 and 50 μg/ml) or 5 mM NAC for 6 h. Subsequently, the cells were suspended in ROS working reagent (S0033M, Beyotime, China) and stained at 37℃ for 30 min. Following a PBS wash, the cells were re-suspended in 500μL PBS and the ROS levels were quantified using a FACS-can flow cytometer. Cells were inoculated into confocal dishes (8 × 10⁴ cells/cm2) and incubated with DMEM containing 300 µM ZnCl2, varying concentrations of ZnO NPs (12.5, 25 and 50 μg/ml) or 5 mM NAC for 6 h. Subsequently, the initial medium was removed and replaced with 1 mL ROS working solution, which was then incubated for an additional 10 min at 37℃. Subsequently, the cells were visualized using an Olympus IX51 inverted fluorescent microscope.
Assay of mitochondrial membrane potential with JC-1 assay kit
The cells were plated in 6-well dishes (5 × 10³ cells/cm2) and exposed to 300 µM ZnCl2 or ZnO NPs (12.5, 25 and 50 μg/ml). The supernatant was discarded, and the cells were incubated with DMEM containing 10 μg/ml JC-1 working reagent (C2005, Beyotime, China) at 37℃ for 30 min and then washed three times with PBS. The images were acquired within 30 min using an Olympus IX51 inverted fluorescent microscope.
Assay of Fe
2+contents with FerroOrange
The cells were plated in confocal dishes at a concentration of 5 × 10³ cells/cm2 as described above and exposed to 300 µM ZnCl2, varying concentrations of ZnO NPs (12.5, 25 and 50 μg/ml) or 5 mM NAC for 6 h. Fe2+ contents were detected using FerroOrange (F374, Dojindo, Japan). After removing the supernatant cells were stained with DMEM containing 1 μM FerroOrange at 37℃ for 30 min and then rinsed three times with PBS. The images were acquired within 30 min using an Olympus IX51 inverted fluorescent microscope.
Calcein acetoxymethyl ester/propidium iodide (Calcein-AM/PI) staining
The cells were plated in confocal dishes (8 × 10⁴ cells/cm2) and exposed to 300 µM ZnCl2, varying concentrations of ZnO NPs (12.5, 25 and 50 μg/ml) or 5 mM NAC. After labeling with Calcein-AM/PI dye (E-CK-A354, Elabscience, China) at 37℃ for 30 min, the living cells (green fluorescence) and dead cells (red fluorescence) were imaged using an Olympus IX51 inverted fluorescent microscope.
Total superoxide dismutase (SOD) activity
Cells were plated in 6-well dishes (8 × 10⁴ cells/cm2) and then treated with or without varying concentrations of ZnO NPs (12.5, 25 and 50 μg/ml) for 6 h. Subsequently, the cells were homogenated with 100μL PBS and then centrifuged at 1,000 rpm for 5 min. After adding the SOD assay working solution (S0109, Beyotime, China) and reaction initiation solution to the supernatant, the liquid was incubated at 37℃ for 30 min. The absorbance values were quantified at a wavelength of 450 nm utilizing the microplate reader.
Lipid peroxidation malondialdehyde (MDA) concentration
The MDA concentration of cells was evaluated using the Lipid Peroxidation MDA Assay Kit (S0131S, Beyotime, China). Briefly, the cells were plated in 6-well dishes (8 × 10⁴ cells/cm2), followed by treatment with or without varying concentrations of ZnO NPs (12.5, 25 and 50 μg/ml) for 6 h. Subsequently, the cells were homogenated with 100μL PBS and then centrifuged at 1,000 rpm for 5 min. After adding the MDA assay working solution to the supernatant, the liquid was incubated at 100℃ for 15 min. After being cooled to room temperature, the liquid was centrifuged (1000 g) for 10 min. The absorbance values were recorded at a wavelength of 532 nm utilizing the microplate reader.
Glutathione (GSH) concentration
The GSH concentration of cells were evaluated using the GSH and GSSG Assay Kit (S0053, Beyotime, China). Cells were plated in 6-well dishes (8 × 10⁴ cells/cm2), followed by treatment with or without varying concentrations of ZnO NPs (12.5, 25 and 50 μg/ml) for 6 h. Subsequently, the cells were homogenated with protein removal reagent M solution and then centrifuged at 1,000 g for 10 min. The GSH assay working reagent was added to the supernatant and incubated for 5 min. Subsequently, the NAPDH working solution was added, and the mixture was further incubated for 30 min. The absorbance values were recorded at a wavelength of 412 nm utilizing the microplate reader.
Western blotting analysis
The protein extraction and immunoblotting techniques utilized in this study were performed as previous reported (Yan et al. 2021). Cell collection and lysis were performed using CytoBuste protein extraction reagent (#71,009, Novagen, Germany) supplemented with protease and phosphatase inhibitors (Roche, Switzerland). Total protein concentrations were determined using a BCA quantification kit (BCA01, DingGuo BioTECH, China). The protein loading amount was 30 μg/sample and protein were separated by SDS-PAGE and subsequently transferred to PVDF membranes (Bio-Rad). The membranes were obstructed with 5% Difco skim milk (#232,100, BD, USA) and then exposed to primary antibody (FTL) for 18 h on a shaker at 4 °C, followed by incubation with secondary antibody (7074P2, Cell Signaling Technology, USA) for 1 h at room temperature. Subsequently, the bands corresponding to the proteins of interest were detected utilizing an ECL kit (#34,079, Thermo Fisher, USA) and GeneGnome5 system (SYNGENE, China). The intensity of the bands was assessed using Quantity One software (Bio-Rad, USA). FTL was diluted 1000-fold in 5% skim milk, and the secondary antibodies were diluted 3000-fold. At minimum of three separate experiments were conducted.
Data analysis
The data were statistically analyzed using IBM SPSS statistics 26.0 and graphed using GraphPad Prism 8.0. Experiments were conducted independently at least three times. The Shapiro–Wilk test was used to assess the normality of all data in this study. If the data were normally distributed, they were presented as mean ± SEM. Multiple comparisons between groups were made using the LSD test in one-way ANOVA for data with homogeneity of variances. For data with heterogeneity of variances, Dunnett´s T3 test was employed to compare between groups. The nonparametric Kruskal–Wallis rank sum test was utilized to analyze data of Non-Normal distribution. The chi-squared test was employed to assess the differences in rates among the experimental groups. The chi-squared test was employed to assess the differences in rates among the experimental groups. Statistical significance was established at P < 0.05, while highly significant differences were indicated at P < 0.01 and P < 0.001 between control and experimental groups.

留言 (0)