RNA sequencing and clinical data analysis from TCGA database
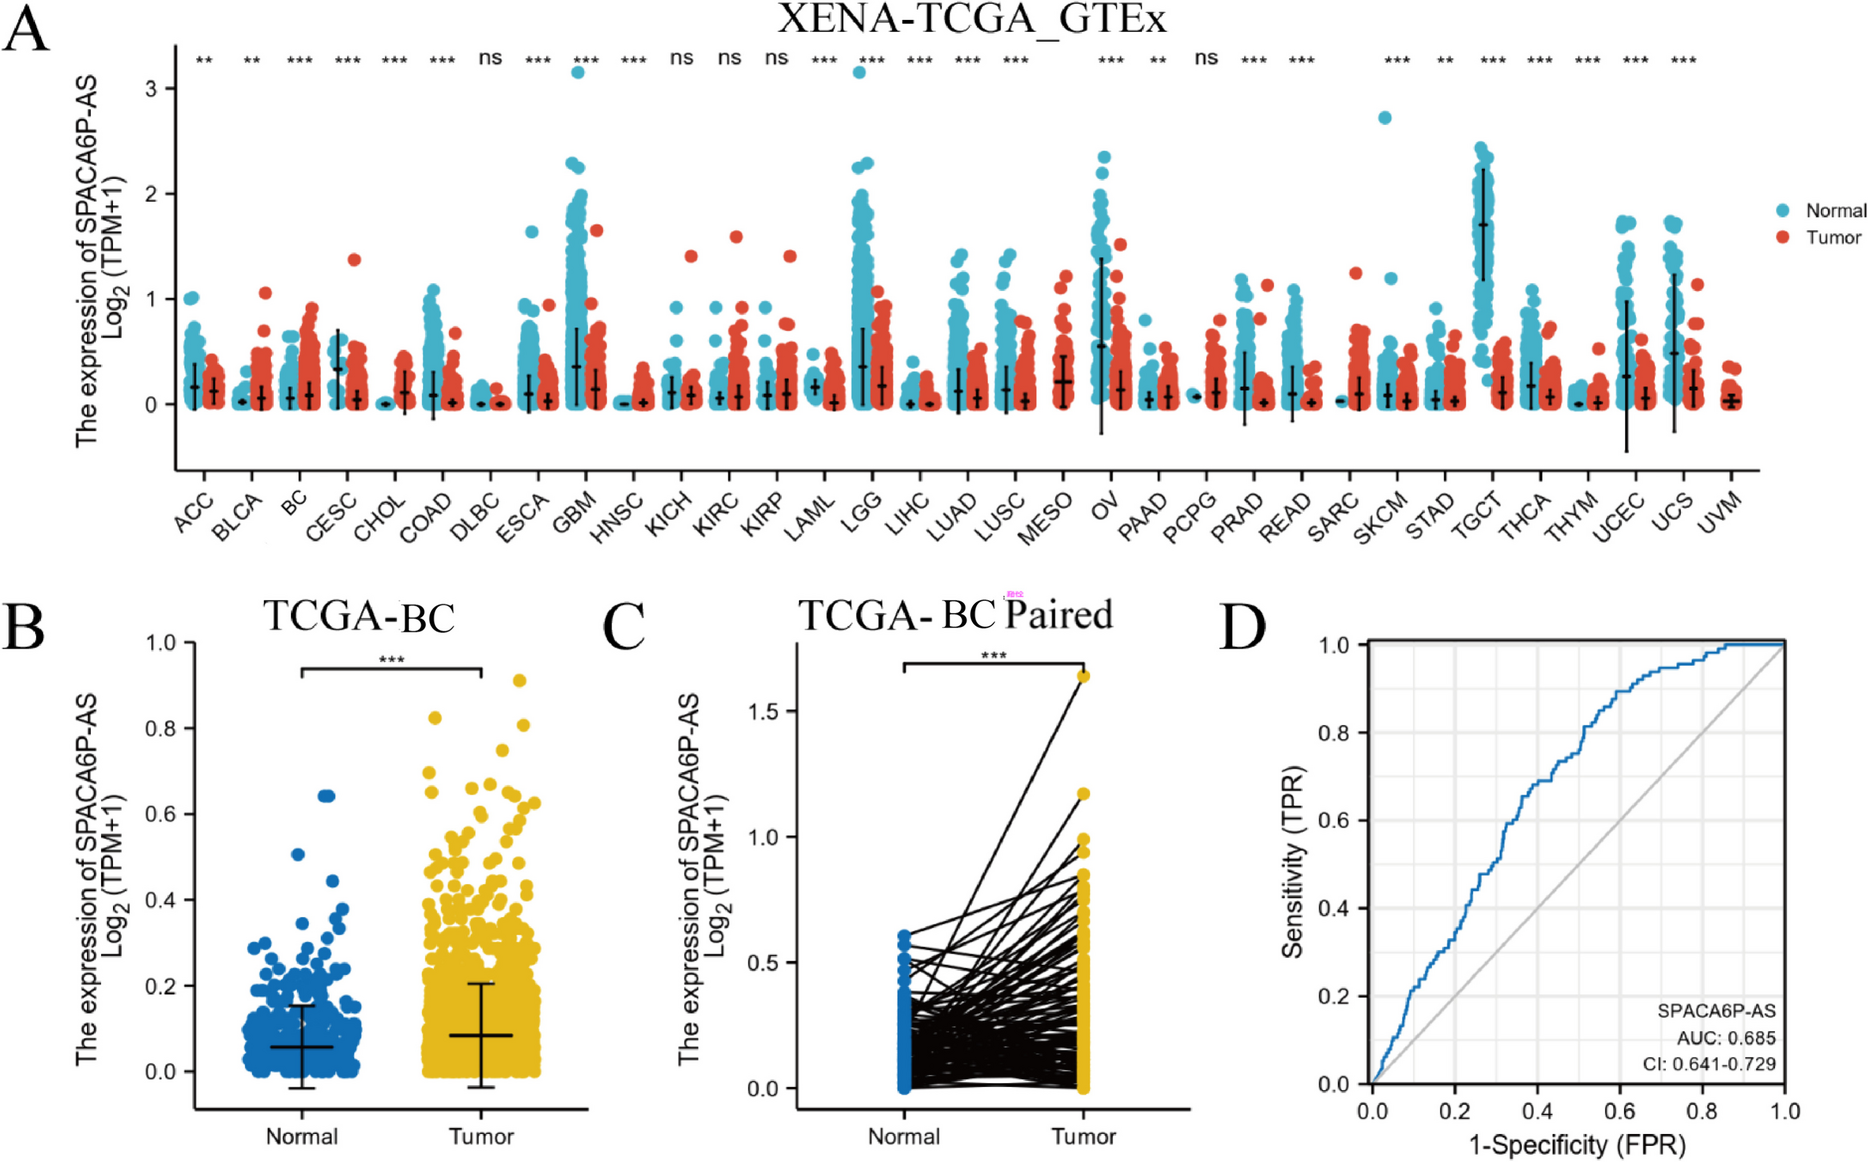
RNA sequencing data of tumor tissues from 1083 BC patients and 113 adjacent normal tissue samples were sourced from TCGA database, along with clinical data. Furthermore, the Genotype-Tissue Expression (GTEx) database provided 179 normal breast tissue samples. Utilization of the DESeq2 R package (version 1.20.0, Bioconductor) enabled the performance of data analysis following the guidelines in PMID: 25516281. The expression levels of the lncRNA SPACA6P-AS were ranked across all patient samples to establish the median expression level. Based on this median expression level, two distinct groups were formulated within the BC patient cohort: the high expression group (N = 542) and the low expression group (N = 541). A comparison of HTSeq-counts data between the high and low expression groups of lncRNA SPACA6P-AS was executed. The threshold was established at |log2 Fold Change (FC)|> 1.5, and adjusted p-values were calculated utilizing the Benjamini–Hochberg approach, considering an adjusted p < 0.05 as significant. Identification of differentially expressed genes (DEGs) was carried out using the R package limma to investigate biological variances between the high and low expression groups.
Construction and evaluation of nomograms
Through the utilization of multivariate Cox regression models, prognostic nomograms were formulated specifically for patients diagnosed with BC using the 'survival' and 'rms' packages in R software (version 4.2.0). The total prognostic score for every individual identified with BC was calculated considering clinical parameters such as age, pathological staging, tumor size, etc. Calibration plots of the nomograms were used to assess prediction accuracy, while the concordance index (C-index) and bootstrapping with 1000 resamples were employed to evaluate the model's discriminative ability.
Enrichment analysis
Enrichment analysis of Gene Ontology (GO) and Kyoto Encyclopedia of Genes and Genomes (KEGG) pathways was carried out employing the clusterProfiler R package (version 3.14.3), involving over-representation analysis (ORA) (Yu et al. 2012). The objective of this stage was to pinpoint key biological processes (BP) and signaling pathways connected to the differential expression of SPACA6P-AS.
Gene set enrichment analysis (GSEA)
The GSEA software (version 3.0) was employed for the implementation of the GSEA analysis. DEGs between high and low SPACA6P-AS expression groups were subjected to 1000 permutation analyses to obtain normalized enrichment scores (NES), with NOM p-values below 0.05 considered significant.
ssGSEA immune infiltration analysis
The GSVA R package (version 1.34.0) was employed to perform single-sample gene set enrichment analysis (ssGSEA) on 24 types of tumor-infiltrating immune cells in order to quantitate immune infiltration in BC tumor samples (Bindea et al. 2013). This analysis was conducted based on 509 gene features linked to various immune cells, including natural killer cells (NK cells), tumor-infiltrating neutrophils (TIN), CD56 bright/dim NK cells, and others. The correlation between immune cell infiltration and lncRNA SPACA6P-AS expression was investigated through Spearman correlation analysis.
Cell culture
In this study, we used two human BC cell lines, MDA-MB-231 (ATCC, CRM-HTB-26™) and MCF-7 (ATCC, HTB-22), to simulate different subtypes of BC. Cellular growth occurred in Dulbecco's Modified Eagle Medium (DMEM) containing 10% fetal bovine serum (FBS, Gibco, 12484028) and 1% penicillin–streptomycin (Gibco, 15140–122), providing essential nutrients and preventing microbial contamination. Cultures were upheld at 37 °C in a 5% CO2 incubator (Forma™ Steri-Cult™, 3308E) to replicate physiological conditions. There was a renewal of the medium bi-daily, and cells were passaged upon reaching approximately 80% confluence to maintain vitality and proliferative capacity.
For evaluating the impact of lncRNA SPACA6P-AS on immune cells, tumor cell lysates were prepared as follows: Cell suspensions of MDA-MB-231 were exposed to six rapid freeze–thaw cycles in liquid nitrogen and subsequently treated in a 37 °C water bath. Subsequent ultrasonication lasting 15 s facilitated the extraction of tumor antigens from lysed cancer cells. The cell debris was removed from the lysates by centrifugation at 1500 rpm for 15 min at 4 °C. Subsequently, the supernatant was passed through a 0.2 µm filter from Millipore (SLGP033RB). Measurement of protein quantities in the lysates was carried out by employing the Bio-Rad Bradford protein assay kit (500–0006).
Cell transfection
Human BC cell line MDA-MB-231 cells were transfected and grouped as follows: sh-NC group (transfected with the sequence 5'-GGGUGAACUCACGUCAGAA-3'), sh-SPACA6P-AS-#1 group (transfected with the sequence 5'-GAGATAGGCACAGAGACATTC-3'), and sh-SPACA6P-AS-#2 group (transfected with the sequence 5'-GGCACAGAGACATTCTGAGAG-3'). These groups were also utilized in establishing a mouse xenograft model. Subsequent cell experiments were conducted using the transfection of sh-SPACA6P-AS with better transfection efficiency in MDA-MB-231 cells, MCF-7 cell line, and dendritic cells (DCs). The transfection procedures adhered to the manufacturer's guidelines of Lipofectamine 2000 (Invitrogen, part number: 11668019) to ensure maximal transfection efficiency and minimal cellular toxicity. After 48 h post-transfection, the silencing efficiency of the sh-SPACA6P-AS sequence was assessed using RT-qPCR (A31673, Applied Biosystems™). The specific primer sequences are detailed in Table S1.
Cell proliferation assay
The impact of lncRNA SPACA6P-AS on the proliferation capability of BC cells was carried out using the CCK-8 assay. After transfection, the cells received treatment involving the CCK-8 reagent (ab228554, Abcam, USA) at 24, 48, and 72 h and incubated for a specified duration adhering to the manufacturer's prescribed guidance. Subsequently, the absorbance values post-reaction were measured using a spectrophotometer (1681150, Bio‐Rad, USA) at a wavelength of 450nm to quantify the proliferative activity of the cells (Nie et al. 2024).
Migration and invasion experiments
The involvement of lncRNA SPACA6P-AS in BC cell migration and invasion was analyzed using Scratch and Transwell invasion assays. For the scratch assay, cultured cells in 6-well plates (Corning, 3516) were allowed to grow until reaching 90% confluency. To initiate the experiment, a scratch of approximately 1 mm in size was meticulously made using a 200 µL pipette tip. Cultivated cells were subjected to serum-deprived conditions for 24 to 48 h, and the healing process was observed and photographed using a phase contrast microscope (Olympus, CKX53). For the Transwell invasion assay, the porous membrane of the upper chamber (Corning, 3422) was coated with Matrigel (BD Biosciences, 354234). The upper compartment received the processed cell suspension, while the lower compartment was filled with DMEM supplemented with 10% FBS. Post 24 h of incubation, non-migratory cells in the upper chamber were eliminated using a cotton swab, and the migrated cells that traversed the membrane were subsequently fixed with 4% paraformaldehyde (Catalog: G1101, Servicebio) and stained with 0.1% crystal violet (C0775, Sigma-Aldrich, St. Louis, MO, USA) for the purpose of cell enumeration under a microscope (Li et al. 2024; Katz et al. 2017).
Construction of a nude mouse animal model
In this experiment, from Beijing Vital River Laboratory Animal Technology Co., Ltd. (catalog number: 401, Beijing, China), 18 healthy female BALB/c Nude mice were procured. Aseptic housing was provided for the mice in a designated animal facility, where conditions involved maintaining a humidity level between 60 and 65% alongside a temperature spectrum ranging from 20 to 25°C. Following a week of acclimation nourishment, the mice were randomly allocated to three separate groups for the study following the end of the adaptation period. The group size was fixed at 6 mice, which were then transfected with sh-lncRNA SPACA6P-AS#1, sh-lncRNA SPACA6P-AS#2, and sh-NC MDA-MB-231 cells, respectively. Health assessments were conducted on the mice before the commencement of the experiment. Each mouse received approximately 1 × 10⁶ cells via subcutaneous injection in the flank (Sang et al. 2018). Post-injection, the mice's health status and tumor growth were regularly monitored and recorded. Tumor size was measured with a ruler, calculated using the formula volume = length × width2/2, and mice were euthanized two weeks after injection.
Hematoxylin and eosin (H&E) staining and immunohistochemistry
Nude mouse xenograft tumor tissues were fixed with 4% formaldehyde solution, dehydrated and cleared with xylene (Catalog Number: 214736, Fisher Scientific) and a series of ethanol concentrations (Catalog Number: BP2818-4, Fisher Scientific). Subsequently, the tissues were encased in paraffin and sliced into sections measuring 4 µm in thickness. The slices were melted in an oven at 56 °C, deparaffinized twice with xylene, and sequentially immersed in 100%, 95%, 90%, and 75% ethanol. Subsequent staining steps included immersion in hematoxylin (Catalog Number: 51275, Sigma) for 3 s, rinsing in tap water for 1 min, staining with 1% eosin Y (Catalog Number: 318906, Sigma) for 5 min, followed by a repeated dehydration process (70%, 80%, 90%, 95%, 100% ethanol). Coverslips were sealed with neutral gum (Catalog Number: G8593, Beijing Solarbio Science and Technology Co., Ltd.), air-dried, and observed under a microscope for recording (Wu et al. 2023; Yang et al. 2023).
The slides were deparaffinized at 58 °C for 30 min, undergo antigen retrieval with citrate buffer (pH 6.0, Catalog Number: CL-K943, Shanghai Yihai), followed by blocking of endogenous peroxidase with 3% hydrogen peroxide (Catalog Number: H1009, Sigma-Aldrich). Subsequently, non-specific binding was blocked using 5% BSA (Catalog Number: A9647, Sigma-Aldrich). The slides were then incubated with Ki-67 antibody (Catalog Number: ab15580, Abcam) overnight at 4 °C. The next day, staining was performed using secondary antibody and DAB chromogen (Catalog Number: K5007, DAKO), followed by counterstaining of cell nuclei with hematoxylin and mounting with mounting medium. Cell counting under an optical microscope (Optika, XDS-3, Ponteranica, Italy) was conducted by randomly selecting 5 fields per slide and counting 100 cells per field to determine the percentage of Ki-67 positive cells. Immunohistochemistry specificity was confirmed by performing positive control (BC tumor tissues) and negative control (non-immune serum without primary antibody) (Bouraoui et al. 2018; Vieira Costa et al. 2024).
Obtaining peripheral blood mononuclear cells and cultivating DCs
Peripheral blood was collected from healthy donors (n = 3, 2 males, 1 female, average age 34.2 ± 2.3 years) using sterile heparinized Falcon tubes (BD Biosciences, Cat. No. 352054). The separation of peripheral blood mononuclear cells (PBMCs) from blood samples was carried out utilizing Ficoll gradient separation method (GE Healthcare, Cat. No. 17144002). Monocytes were subsequently separated from PBMCs through adherence to a plastic surface. To achieve this, PBMCs were seeded at a concentration of 5 × 10⁶ cells per milliliter in serum-free RPMI-1640 medium (Gibco, Cat. No. 11875–093) in 6-well plates (Corning, Cat. No. 3516). Following incubating at 37 °C for 2 h, non-adherent cells were discarded, and culturing of the adherent cells was conducted in a medium supplemented with 50 µM 2-mercaptoethanol (Sigma-Aldrich, Cat. No. M6250), 20 ng/mL recombinant human IL-4 (rhIL-4, PeproTech, Cat. No. 200–04), and 40 ng/mL recombinant human GM-CSF (rhGM-CSF, PeproTech, Cat. No. 300–03). Fresh medium enriched with rhGM-CSF and rhIL-4 was introduced to the remaining culture halves on days 2 and 4. On day 6, immature dendritic cells (iDCs) were harvested, and the culture received an addition of 80 µg/mL of mixed lysate from human BC cell lines. After 5 h of incubation, 100 ng/mL of lipopolysaccharide (LPS, Sigma-Aldrich, Cat. No. L4391) was incorporated into the culture medium. Mature dendritic cells (mDCs) loaded with tumor cell lysates were obtained after a 24-h incubation at 37 °C.
Identification of the morphology and phenotypic characteristics of DCs
The morphology of mononuclear cells and DCs was observed and captured through an inverted optical microscope (Optika, XDS-3, Ponteranica, Italy). To investigate the phenotypic features of iDCs, mDCs, and mDCs with silenced SPACA6P-AS, surface markers including CD11c (anti-CD11c-FITC, BioLegend, catalog number: 301306), HLA-DR (anti-HLA-DR-APC, BioLegend, catalog number: 307606), CD40 (anti-CD40-CF Blue, BioLegend, catalog number: 33432), and CD86 (anti-CD86-PerCP-cy5.5, BioLegend, catalog number: 305430) were used for labeling. Cell evaluation was performed using the MACSQuant flow cytometer (Miltenyi Biotec, Auburn, CA, USA), followed by analysis of the results using FlowJo v10.5.3 software (BD Biosciences).
Autologous CD3 + T cell isolation process
Autologous CD3 + T cells were isolated from PBMCs of the same donor used for DC culture using Magnetic-Activated Cell Sorting (MACS) and the Human Pan T Cell Isolation Kit (Miltenyi Biotec, part number: 130–096-535). Briefly, following the separation of PBMCs, the cell suspension was subjected to centrifugation at 300 × g for a period of 10 min. The supernatant was removed, and for every 1 × 10⁷ cells, the mixture contained 10 µL of the pan-T cell biotin antibody mix and 40 µL of MACS buffer was introduced. After incubation at 2–8°C for 5 min, the addition involved introducing 30 µL of MACS buffer along with 20 µL of the pan-T cell microbeads mix. The cells underwent a cleansing process using MACS buffer, were then placed in cold conditions between 2–8°C for 10 min, and finally suspended in 500 µL of MACS buffer. The cell suspension was loaded onto a MACS column and placed in the magnetic field of a MACS separator. Cells flowing through the column without labeling were indicative of the CD3 + T cells selected negatively in the process.
Assessment of CD3 + T lymphocyte proliferation using CFSE labeling
CFSE (Carboxyfluorescein Succinimidyl Ester) was employed to tag the isolated CD3 + T cells, adhering to the instructions outlined by the manufacturer. In a brief outline, the separated T cells were resuspended in PBS and incubated with 5 µM CFSE at 25 °C, under light-protected conditions for 5 min. The reaction was terminated through supplementing RPMI-1640 medium with 20% FBS. After washing, the collected cells were transferred to pre-warmed culture medium. To evaluate the ability of mature DCs and SPACA6P-AS silenced mDCs to promote the proliferation of autologous T cells, co-culture experiments of DCs and T cells were conducted. In a V-bottom 96-well plate, control group mDCs and silenced SPACA6P-AS mDCs were co-cultured with CFSE-labeled autologous CD3 + T lymphocytes at ratios of 1:5 and 1:10. The positive control group included T cells activated with 5% phytohemagglutinin (Sigma Chemical Co., part number: L4144-10MG), while the unstimulated group consisted of T cells co-cultured with iDCs. Upon completion of a four-day incubation period in a light-shielded environment, the expansion of T cells tagged with CFSE was evaluated via flow cytometry analysis. The control group was made up of unlabeled CD3 + T lymphocytes.
Immunohistochemical staining
For immunohistochemical staining, cells were first fixed with 4% formaldehyde solution (Servicebio, G1101) and dehydrated and cleared with xylene (Fisher Scientific, X3-1L) and graded ethanol concentrations (Fisher Scientific, BP2818-4). The tissue samples were subsequently encased in paraffin and cut into sections with a thickness of 4 µm. The segments were subjected to a heating process at 58 °C for a duration of 30 min to remove paraffin, subsequent to antigen retrieval in citrate buffer (pH 6.0, Servicebio, CL-K943). The endogenous peroxidase activity was suppressed by treatment with 3% hydrogen peroxide (Sigma-Aldrich, H1009), and nonspecific binding was blocked with 5% BSA (Sigma-Aldrich, A9647). The specimens were subsequently subjected to an overnight incubation in the presence of the Ki-67 antibody (Abcam, ab15580). The following day, secondary antibodies and DAB chromogen (DAKO, K5007) were applied, and nuclei were counterstained with hematoxylin. Slides were then mounted.
Cytokine assay
Recently harvested CD3 + T cells were cultured together with control mDCs and SPACA6P-AS-silenced mDCs at a 1:5 ratio in 24-well plates to study the capabilities of control and SPACA6P-AS-silenced mDCs to stimulate cytokine secretion when autologous T cells are around. Post a 48-h DC stimulation, supernatants were harvested from the co-culture, and the concentrations of IFN-γ, TGF-β, and IL-4 were assessed using ELISA kits from R&D systems (Minneapolis, Minnesota, USA, DY285-05, DY240-05, and DY204-05). Levels of IL-12 and IL-10 in the supernatants of control and SPACA6P-AS-silenced mDCs were also assess through ELISA kits (R&D Systems, Minneapolis, Minnesota, USA, DY1270-05).
Statistical analysis
The statistical analysis predominantly employed R software (version 4.2.0). DEGs was identified using the DESeq2 R package, with a threshold set at |log2 FC|> 1.5, and significance determined by Benjamini–Hochberg method with adjusted p-value < 0.05. For survival analysis, the The Cox proportional hazards regression model was performed to evaluate the relationship between lncRNA SPACA6P-AS expression and patient survival rates, calculating the survival rates at 1, 3, and 5 years. The estimation of survival curves was carried out utilizing the Kaplan–Meier (KM) approach, while variation in survival outcomes between different cohorts was assessed using log-rank tests. GO and KEGG pathway enrichment analyses, as well as GSEA, were employed via the clusterProfiler package and GSEA software, respectively. The GSEA analysis was based on 1000 permutations to obtain normalized enrichment scores (NES), with significance set at NOM p < 0.05. Immune infiltration analysis using ssGSEA was carried out with the GSVA R package, and Spearman rank correlation coefficients were used for correlation analysis. Two-tailed statistical tests were utilized with a significance threshold set at p < 0.05. In situations involving multiple comparisons, adjustments of p-values were carried out using the Benjamini–Hochberg technique. A minimum of three trials were performed for each test, with outcomes shown as mean ± standard deviation (SD). Group contrasts were evaluated utilizing Analysis of Variance (ANOVA) accompanied by post-hoc Tukey HSD analysis when required (GraphPad Prism, GraphPad Software, Version 8.0). Correlation analysis was carried out using Spearman or Pearson correlation coefficients (IBM SPSS Statistics, IBM, Version 25), with significance considered at p < 0.05.

留言 (0)