
記住我

All experimental procedures were approved by the Animal Ethics Committee of Bengbu Medical University Affiliated to First Hospital and conducted in accordance with the Guide for the Care and Use of Laboratory Animals.
High-throughput transcriptome sample sequencing and data quality controlHigh-throughput transcriptome sequencing was conducted on three typical rats, and three rats were successfully modeled for DO. Using the Trizol reagent (Thermo, 16,096,020), the total RNA from each specimen was extracted. The concentration, purity, and integrity of the RNA were ascertained utilizing the Qubit®2.0 Fluorometer® (Life Technologies, Q33216) equipped with the Qubit® RNA Assay Kit (Shanghai Bioji Biotechnology Co., Ltd., HKR2106-01, Shanghai, China), the Nanometer Spectrophotometer (IMPLEN), and the RNA Nano 6000 Assay Kit (Agilent, 5067–1511) in the Bioanalyzer 2100 System, respectively. Each sample contained a total RNA content of 3 μg, which was designated as the input material for RNA sample processing. The NEBNext® UltraTM RNA Library Prep Kit (NEB, E7435L, Beijing, China), which was compatible with Illumina® (USA), was employed to produce the subsequent cDNA library. This library's quality was then assessed on the Agilent Bioanalyzer 2100 system. The indexed samples were organized into clusters utilizing the TruSeq PE Cluster Kit v3 cBot HS (Illumina) (PE-401–3001, Illumina) within the cBot Cluster Generation System. Post-cluster generation, the library was prepared on the Illumina-Hiseq 550 platform, resulting in the production of 125 bp/150 bp paired-end reads (Arunachalam et al. 2022; Linkner et al. 2021). The quality of the paired-end reads in the raw sequencing data was inspected using FastQC v0.11.8 software (www.bioinformatics.babraham.ac.uk). The raw data underwent preprocessing through the Cutadapt software 1.18 (www.bioinformatics.babraham.ac.uk), encompassing the removal of Illumina sequencing adaptors and poly(A) tail sequences. Reads with an N content surpassing 5% were eliminated using a Perl script. Those reads boasting a base quality greater than 20 and a coverage of 70% were extracted through the FASTX Toolkit software 0.0.13 (http://hannonlab.cshl.edu/fastx_toolkit/). The BBMap software (https://sourceforge.net/projects/bbmap/) was utilized to rectify paired-end sequences. In the final step, the curated high-quality read fragments were mapped to the reference genome using hisat2 software (version 0.7.12). The DO-related RNA-seq dataset was subsequently procured (Deng et al. 2020; Peng et al. 2019).
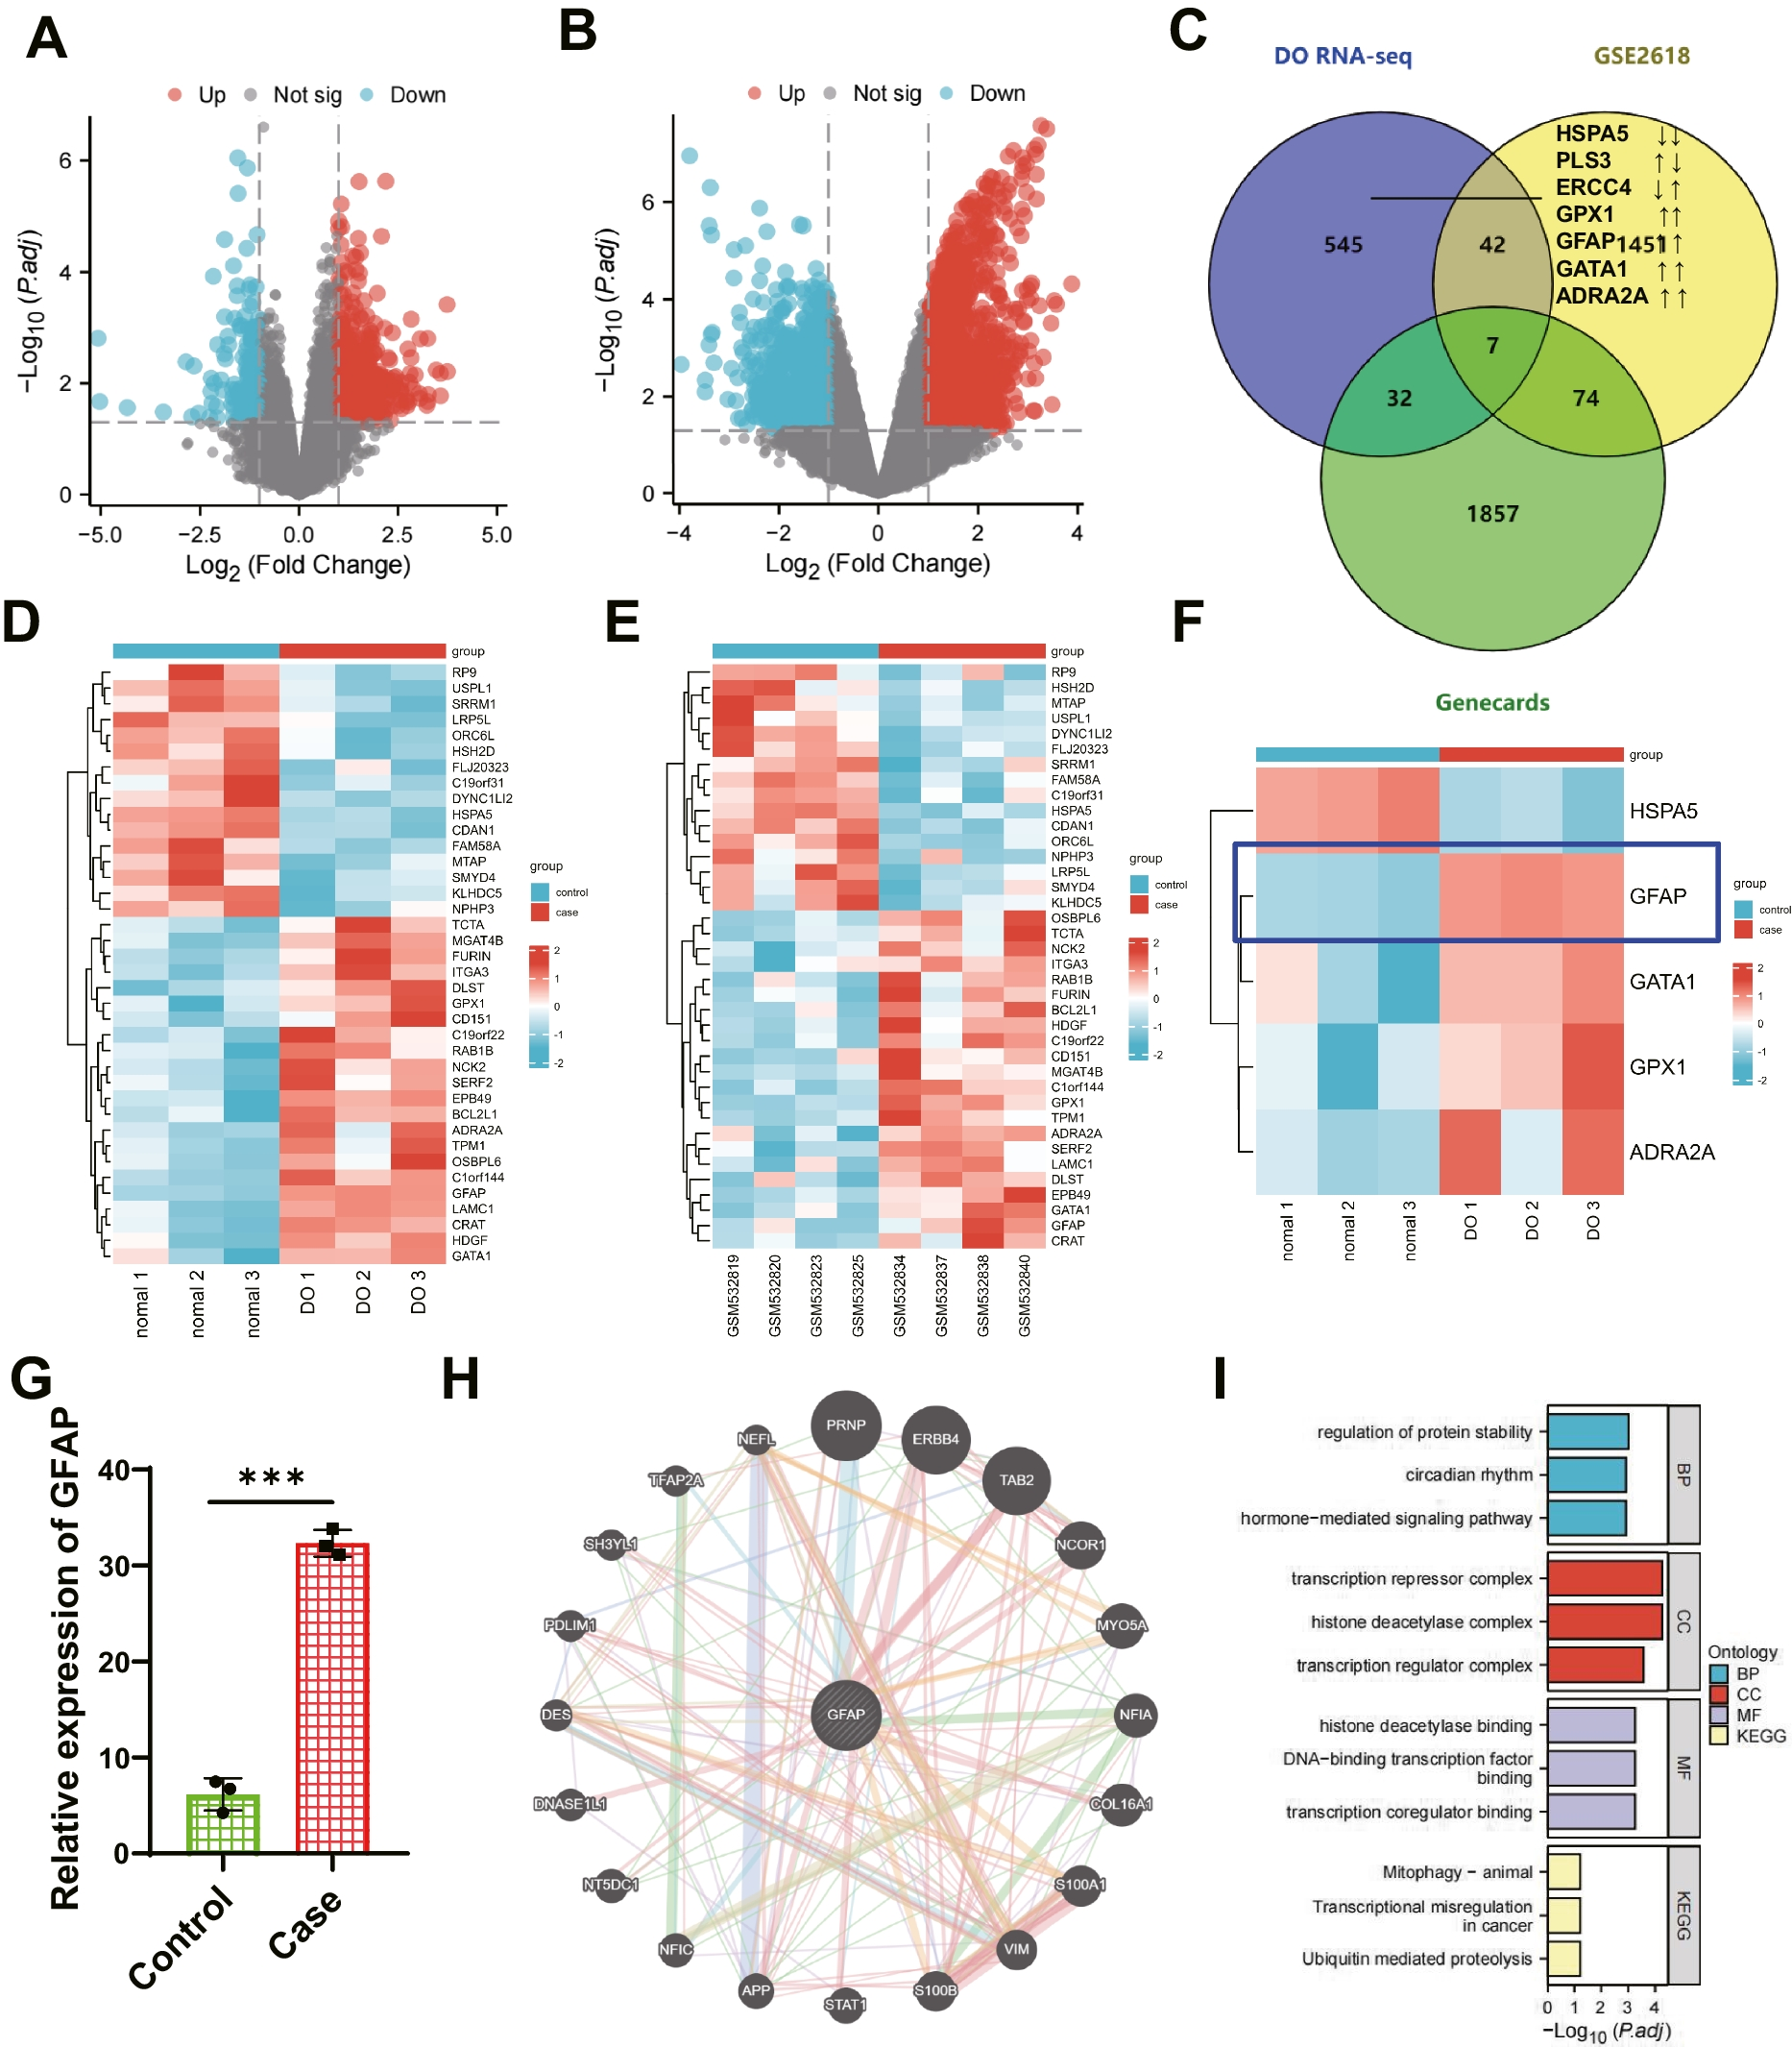
Bioinformatics analysisThe diabetes dataset GSE26168 was obtained by sequencing DO-related RNA-seq data and utilizing the Gene Expression Omnibus (GEO) database (https://www.ncbi.nlm.nih.gov/gds). Differentially expressed genes (DEGs) in two datasets were identified using the "limma" package (Ritchie et al. 2015) of R software and a threshold of P value < 0.05 and |log10FC|> 1. A volcano plot was generated using the "ggplot2" package of R software.
To retrieve the DO-related target genes, the GeneCards database (https://www.genecards.org/) was employed, resulting in 1970 genes with a Relevance score > 5. A Venn analysis was conducted on the results of the dataset analysis and the GeneCards database retrieval using the Draw Venn Diagram tool (http://bioinformatics.psb.ugent.be/webtools/Venn/). This analysis led to the identification of the target gene GFAP. Furthermore, protein interactions between GFAP and other genes were predicted through the Genemania website (http://genemania.org/), and protein interactions between target genes and functional genes were analyzed using the String database (https://string-db.org/) (Szklarczyk et al. 2023). Gene ontology (GO) functional annotation and Kyoto Encyclopedia of Genes and Genomes (KEGG) pathway enrichment analysis and visualization were performed on co-expressed genes using the Xiantaozi academic platform (https://www.xiantaozi.com/) (Liu et al. 2021).
To determine the upstream miRNAs of GFAP, the Norwalk database (http://mirwalk.umm.uni-heidelberg.de/interactions/), mipmap database (https://mirmap.ezlab.org/app/) (Vejnar and Zdobnov 2012), and miRBD database (http://www.mirdb.org/) (Chen and Wang 2020) were utilized. The retrieved results were subjected to Venn analysis using the Draw Venn Diagram tool (http://bioinformatics.psb.ugent.be/webtools/Venn/), resulting in the identification of candidate miRNAs.
DO rat model establishmentSeventy Sprague Wistar rats, aged 7–8 weeks and weighing approximately 180 ± 20 g, were procured from the Vital River Co., Ltd (Beijing, China). These rats were accommodated in an SPF environment, maintaining a temperature of 25 ± 2℃ and a relative humidity between 60–70%. They experienced a 12-h light–dark cycle and were granted unrestricted access to both food and water. Following a week of acclimatization, these rats were ramdonly segregated into a control group (six rats) and a model group (64 rats). In the model group, a type 2 diabetes model was established in 64 rats via streptozotocin injection (60 mg/kg). Random blood glucose concentrations were ascertained, and a level surpassing 16.7 mmol/L confirmed the successful creation of the diabetes model. Concurrently, normal Sprague–Dawley rats were administered a saline solution. An mCT-40 was utilized to scan the femur, and metrics such as bone volume over total volume (BV/TV), trabecular thickness, trabecular number, and bone mineral density (BMD) were deduced via μCT software. After model establishment, every four weeks, parameters such as bone mass volume ratio, trabecular bone thickness, and number of trabecular bones were assessed, and alterations in bone density were observed for both groups. Disparities in BMD and BMC between the groups were discerned, validating the effective development of the DO rat model (Liu et al. 2020).
From the total, 55 therapeutic group rat models were successfully formulated. These were categorized into the GMNPE-EVs group, EVs group, and four additional groups—each containing six rats. The four supplementary groups included the overexpression (oe)-NC group (lentiviral oe-NC), the oe-GFAP group (lentiviral oe-GFAP), the sh-NC group (lentiviral sh-NC), and the sh-GFAP group (lentiviral sh-GFAP). Lentiviruses were administered to these groups via the rat tail vein at a functional titer of 5 × 10⁶ TU/mL, with an allocation of 100 μL for each rat for 1 week (Liu et al. 2020).
Forty-eight DO rats were arbitrarily allocated into four distinct groups, with six rats per group. These groups were designated as follows: PBS + oe-NC group (PBS supplemented with lentiviral oe-NC), mimic-NC-GMNPE-EVs + oe-NC group (GMNPE-EVs derived from BMSCs combined with lentiviral oe-NC), miR-15b-5p-mimic-GMNPE-EVs-oe-NC group (GMNPE-EVs derived from BMSCs with miR-15b-5p mimic and lentiviral oe-NC), and the miR-15b-5p mimic-GMNPE-EVs + oe-GFAP group (GMNPE-EVs derived from derived from BMSCs with miR-15b-5p mimic and lentiviral oe-GFAP). Both GMNPE-EVs (at a dosage of 400 μL of nanoparticles/kg in PBS) and lentiviral doses (100 μL per individual rat) were delivered to the rats via tail vein injection. To encourage the congregation of GMNPE nanoparticles in the bloodstream at the femoral location, N52 neodymium magnets were used to exert an external magnetic field on the rat's femoral site.
Detection of gene expression levels by RT-qPCRThe extraction of total RNA was carried out using Trizol Reagent (10,296,010, Thermo Fisher) from Invitrogen. The quality and concentration of RNA were measured using the ND-1000 UV–Vis spectrophotometer (Nanodrop, Thermo Fisher). Reverse transcription was performed utilizing the PrimeScript™ RT-qPCR Kit (RR086A, TaKaRa, Mountain View, California). Real-time quantitative reverse transcription polymerase chain reaction (RT-qPCR) was conducted using the SYBR Premix Ex TaqTM (DRR820A) from TaKaRa on the LightCycler 480 system provided by Roche Diagnostics in Pleasanton, California. U6 was employed as an internal reference for miRNA, while GAPDH served as an internal reference for mRNA. The amplification primers were designed and supplied by Shanghai General Biological Technology Co., Ltd., with their corresponding sequences listed in Table S1. The fold change in gene expression was calculated using the 2−ΔΔCt method.
Detection of protein expression levels by Western blotTotal proteins were extracted from rat bone tissue and osteoclasts that underwent induced differentiation. Initially, cells from each group were digested and harvested using trypsin sourced from Sigma-Aldrich (T4799-5G, Shanghai, China). Subsequently, these cells were lysed employing an enhanced RIPA lysis buffer supplemented with protease inhibitors procured from Wuhan Bodex Technology (AR0108, Wuhan, China). The protein concentration was ascertained using the BCA Protein Quantification Kit provided by Wuhan Boshido Company (AR1189, Wuhan, China). Proteins were then separated via SDS-PAGE, and the partitioned proteins were relayed onto a PVDF membrane. This membrane was then subjected to incubation at ambient temperature with 5% BSA (9048–46-8, Solarbio, Beijing, China) for an hour. Subsequent to this, the following antibodies were introduced in sequence: GFAP rabbit antibody, TRAP rabbit antibody, NFATC1 mouse antibody, MMP9 rabbit antibody, HSP70 mouse antibody, CD9 rabbit antibody, CD81 rabbit antibody, Calnexin rabbit antibody, GAPDH, and CD63. The membrane was then treated with either anti-mouse or anti-rabbit HRP secondary antibody at room temperature for another hour. ECL working solution was introduced (Omt-01, Beijing Oumijia De Medical Technology Co., Ltd., Beijing, China) for blot visualization. The gray intensity of the bands was quantified using ImageJ software, with GAPDH being utilized as the internal control.
Hematoxylin and eosin (H&E) stainingThe prepared sections are subjected to staining using the safranin staining solution (H8070, Solarbio, Beijing, China) at room temperature for 5–10 min. The slices are then rinsed with distilled water and dehydrated in 95% ethanol. Proceeding, the slices are placed into the eosin staining solution (G1100, Solarbio, Beijing, China) for 5–10 min, followed by completing the regular dehydration and permeabilization, and finally mounting the slides.
micro-CTThe femoral bone tissue section underwent a micro-CT scan utilizing the mCT-40 system sourced from Scanco Medical, Switzerland. This examination aimed to elucidate the development of the femoral bone tissue. The operational parameters set for this scan were a current of 385μA, a voltage of 65 kV, a pixel dimension of 9 μm, a 1.0 mm AI filter, and a rotational increment of 0.4°. The image data was subsequently reconstructed using Bruker's NRecon software, and analytical procedures were carried out using CTAn software. A specific bone tissue section, measuring 0.5 mm × 0.5 mm × 0.25 mm, was isolated above the growth plate on the femoral head. The Region of Interest (ROI) was manually defined to pinpoint the targeted zone beneath the cartilage within this volume parameter. Following this, a consistent threshold range (50 ~ 255) was applied to binarize the trabecular bone, facilitating the identification of the desired region. Several micro-CT-derived parameters were evaluated, encompassing a) Bone volume fraction (BV/TV), which denotes the proportion of bone surface area relative to the tissue volume; b) Trabecular thickness (Tb. Th), an indicator of the average cross-sectional thickness reflecting structural alterations in trabecular bone; c) Trabecular number (Tb. N), representing the count of intersections between bone and non-bone tissue across a specified length; and d) BMD, which measures the concentration and distribution of mineral within the skeletal framework.
Enzyme-Linked Immunosorbent Assay (ELISA)The serum sample was obtained from rat venous blood through centrifugation of the coagulated blood sample at room temperature for 10 min at a centrifugal force of 2000 × g. The serum samples were subsequently stored at -80 °C. For the experiment, the CTX-I ELISA kit (YS03100B, Shanghai YaJi Biotechnology, Shanghai, China) and the TRAP5b ELISA kit (YS03672B, Shanghai YaJi Biotechnology, Shanghai, China) were utilized. The ELISA plate was read using a microplate reader (Bio-Rad) under conditions set at 450 nm, and a standard curve was constructed for subsequent data analysis.
Isolation and identification of BMSCsThe bilateral tibia and femur of the rats were excised, and the bone marrow was subsequently flushed using modified Dulbecco's Modified Eagle Medium (DMEM)/F12 (DF-041, Sigma Aldrich, Shanghai, China) to procure a suspension of mixed cells. This mixture was centrifuged at a speed of 1000 rpm for 5 min, allowing for the isolation of the sediment-rich in BMSCs. The sedimented cells were then resuspended in DMEM/F12 and incubated at a temperature of 37 °C in a 5% CO2 environment. The culture medium was routinely replaced every 2–3 days. The cellular morphology was inspected utilizing transmission electron microscopy, and the Western blot method was employed to assess surface marker proteins, confirming the identity of the isolated BMSCs (Ramezani et al. 2020).
For the identification of BMSCs, a 1 × 10⁶/mL single-cell suspension was generated through a PBS wash. The suspension was then treated with fluorescently tagged antibodies, specifically CD44-FITC (MA5-17,522, Thermo Fisher Scientific), CD29-FITC (11–0291-82, Thermo Fisher Scientific), CD90-FITC (ab226, Abcam, UK), and CD45-FITC (ab33916, Abcam, UK). Following an incubation period at 4℃ for 30 min, any antibodies that did not bind were removed with a PBS wash. The samples were then analyzed using flow cytometry to determine the expression of the aforementioned labeled antibodies. In alignment with the guidelines of the BMSCs differentiation induction kit (PD-003/4/5, Procell, China), alizarin red (ARS), oil red O, and Alcian blue stainings were applied to observe the osteogenic, adipogenic, and chondrogenic differentiation potentials of the BMSCs.
Separation and identification of osteoclastsThe rat's femur was dissected, and the epiphyses at both ends of the long bone were removed. The rinsed cells were then cultivated in the bone marrow cavity using phenol red α-MEM medium (with 10% FBS, 41,061,037, Thermofisher), supplemented with 5 ng/mL M-CSF (purchased from PeproTech, 400–28). The rinsed cells were seeded into a culture plate with 24 cell culture wells. The cells were cultured in a cell culture incubator at 37 ℃, 5% CO2, and saturated humidity for 3 days. Bone marrow-derived macrophages (BMMs) adhered to the cells, while the floating cells were discarded. The cells were maintained in DMEM medium (containing high glucose and 10% FBS), supplemented with 1% penicillin/streptomycin (R22148, Shanghai Yuanye Biotechnology), 20 ng/mL M-CSF, and 50 ng/mL RANKL (78,214.2, Stemcell Technologies Inc.). After 7 days, mature BMMs were evaluated using fluorescence staining with antibodies for F4/80 (ab6640, 1:200) and CD11b (ab8878, 1:50).
Cell transfection and cell sortingGFAP-shRNA was acquired from Thermo Fisher (USA). HEK293T cells (BFN60810479, procured from ATCC) were cultured utilizing the slow virus transfection technique in DMEM medium (Gibco) enriched with 10% FBS at 37 °C with 5% CO2. Both the GFAP-shRNA cell line (termed as sh-GFAP) and the control cell line (referred to as sh-NC) were established. The constructed luciferase reporter gene plasmids (sh-NC-luc, sh-GFAP-luc) were co-transfected with helper plasmids into the HEK293T cells. The target sequence specifics are provided in Table S2.
Regarding the retroviral-mediated cell transduction, BMMs were sourced from cells in the logarithmic growth phase and cultured in phenol red-free α-MEM medium enriched with M-CSF (5 ng/mL). These cells were placed in a 6-well plate at a density of 3 × 10⁵ cells per well. Upon reaching a cell confluence of 70–90%, a predetermined volume of the packaged lentivirus (with an MOI of 10 and a working titer of approximately 5 × 10⁶ TU/mL) and 5 μg/mL polybrene (TR-1003, Merck) was introduced to the culture medium to initiate transfection. Four hours post-transfection, the medium was diluted with an equivalent volume. Subsequently, 24 h post-transfection, the medium was refreshed. The transfection's efficacy was evaluated through a luciferase reporter gene 48 h post-transfection. Stably transfected cell lines were screened using a suitable concentration of puromycin (A1113803, Gibco, Grand Island, NY). After ensuring no cellular death, cells cultivated in a purine-deficient medium were gathered and subjected to an inefficiency analysis using RT-qPCR (Yan et al. 2015).
To mediate the transfection of GMNPE-EVs through a slow virus, logarithmic growth phase BMSC cells were seeded in a 6-well plate with 3 × 10⁵ cells per well. Once the cell confluency reached 70–90%, an appropriate amount of packaged lentivirus (MOI = 10, working titer approximately 5 × 10⁶ TU/mL) was added and transfected with the culture medium containing 5 μg/mL polybrene (TR-1003, Merck). After transfection for 4 h, the polybrene was diluted by adding an equal amount of medium. Fresh medium was replaced after 24 h of transfection. Subsequently, the transfection efficiency was assessed after 48 h using a luciferase reporter gene. EVs were captured by GMNPE and cultured with BMMs using a lentivirus-mediated method.
The cells were divided into various groups: oe-NC group (lentiviral overexpression NC group), oe-GFAP group (lentiviral oe-GFAP group), sh-NC group (lentiviral silencing NC group), sh-GFAP group (lentiviral silencing GFAP group), mimic-NC-GMNPE-EVs + oe-NC group (GMNPE-EVs constructed from EVs isolated from BMSCs with lentiviral oe-NC), miR-15b-5p mimic-GMNPE-EVs + oe-NC group (GMNPE-EVs constructed from EVs isolated from BMSCs overexpressing miR-15b-5p and lentiviral oe-NC), miR-15b-5p mimic-GMNPE-EVs + oe-GFAP group (GMNPE-EVs constructed from EVs isolated from BMSCs overexpressing miR-15b-5p and lentiviral oe-GFAP), inhibitor NC-GMNPE-EVs + sh-NC group (GMNPE-EVs constructed from EVs isolated from BMSCs with lentiviral sh-NC), miR-15b-5p-inhibitor-GMNPE-EVs + sh-NC group (GMNPE-EVs constructed from EVs isolated from BMSCs with miR-15b-5p inhibitor and lentiviral sh-NC), and miR-15b-5p-inhibitor-GMNPE-EVs + sh-GFAP group (GMNPE-EVs constructed from EVs isolated from BMSCs with miR-15b-5p inhibitor and lentiviral sh-GFAP).
TRAP stainingThe TRAP staining technique was utilized to identify multinucleated osteoclasts. Once sections were deparaffinized and dehydrated, they were rinsed in distilled water for approximately 5 min. The sections were subsequently positioned inversely in a double sodium carbonate solution vessel. The container was then introduced to the anti-TRAP antibody solution, ensuring immersion for a period ranging between 5 and 20 min for thorough interaction with the sections. Excess anti-TRAP antibodies were removed, and the sections returned to their physiological conditions. Thereafter, secondary antibodies, either fluorescently labeled or enzyme-associated, were applied for detection (Chinnaiah et al. 2022; Rui et al. 2012).
For BMM cultivation, the recommended medium was α-MEM devoid of phenol red, augmented with 20 ng/mL M-CSF, 50 ng/mL RANKL, and 10% FBS. BMM culture was sustained in the medium refreshed every 3 days. The procedure for staining TRAP-positive multinucleated cells entailed the following steps: cells were initially fixed using 2.5% glutaraldehyde for 30 s before being rinsed with deionized water. After combining 0.5 mL of concentrated pomegranate red GBC solution with 0.5 mL of nitrite solution, and allowing it to stand for 2 min post-mixing, 45 ml of pre-warmed deionized water was added, followed by 0.5 mL of naphthol AS-BI phosphate solution, 2 mL of acetic acid solution, and finally, 1 mL of tartaric acid solution. Once the staining solution was prepared, it was dispersed into a 6-well plate for staining and incubated under dark conditions at 37 °C for 4 h. Post incubation, sections were counterstained with hematoxylin for 1 min, and subsequently washed with an alkaline solution until nuclei appeared a deep blue hue. Visualization and enumeration of the stained cells were conducted utilizing an inverted microscope (IX73, OLYMPUS).
Dual-luciferase reporter gene experimentTwo plasmids, pmirGLO-GFAP-WT and pmirGLO-GFAP-MUT, were generated to incorporate the respective binding sites of miR-15b-5p and the 3'UTR of GFAP. The former represented the wild type, whereas the latter represented the mutant plasmid. HEK293T cells, procured from ATCC, were co-transfected with the miR-15b-5p mimic plasmid and the NC plasmid, NC mimic plasmid. These cells were cultured in a DMEM medium (Gibco), supplemented with 10% FBS, and incubated at 37℃ with 5% CO2 in a cell culture incubator. Following a 24-h transfection period, the cells were lysed and subsequently centrifuged at 12000 rpm for 1 min to collect the supernatant. Data was collected using the Dual-Luciferase Reporter Assay System (E1910, Promega), which employed a dual-luciferase reporter gene detection system. Sample activity of Firely luciferase was measured by adding 100 μL of Firely luciferase enzyme working solution, while Renilla luciferase enzyme working solution was added simultaneously to detect Renilla luciferase activity as an internal reference point.
Separation, extraction, and identification of EVsUpon BMSCs attaining a confluence of 80–90%, they were cultivated in serum-free MSC NutriStem® XF Media (Sartorius, Germany) for 48 h. Subsequent to this, a centrifugation process was carried out at 300 × g for 10 min, followed by another at 2000 × g for an equivalent duration to accumulate the supernatant and facilitate the elimination of deceased cells along with cellular debris. The gathered supernatant was then filtered via a 0.22 μm filter (Millipore, GVHP00010, Billerica, MA) and subjected to centrifugation at 100,000 × g for 2 h. After meticulous removal of the supernatant, the residual pellets were resuspended in 70 mL of cold PBS and centrifuged once more under the conditions of 4℃ and 100,000 × g for a 2-h duration. The PBS was then cautiously discarded. The purification process continued using the specified reagent kit and culminated with a resuspension in phosphate buffer (P1020, Solarbio, Beijing, China). This was followed by a secondary high-velocity centrifugation under identical conditions. The resultant precipitate was either stored at -80℃ for subsequent utilization or employed immediately.
Surface markers of EVs were identified employing the Western blot technique. Post the concentration process of the EVs suspension, the protein quotient was ascertained utilizing the BCA assay kit (23,227, Thermo Fisher Scientific), and an SDS-PAGE was formulated for protein denaturation and electrophoresis. Subsequently, a transfer was performed to detect the manifestation of specific EV marker proteins, namely HSP70, CD9, CD81, and Calnexin. The EV solution was incubated alongside Cy3 (S1050, Solarbio) at a ratio of 1:400 over 30 min. The DiR-tagged EVs were then acquired post centrifugation at 100,000 × g for 90 min to expel superfluous dye. This experimental procedure was reiterated thrice.
For EV identification via Transmission Electron Microscopy, 20 µL of EVs were deposited on a copper mesh and allowed to rest for 3 min, after which the surplus liquid was siphoned using filter paper. Subsequent to this, 30 μL of phosphotungstic acid solution (with a pH of 6.8) was added, and a room-temperature incubation ensued for 5 min. After drying under an illuminating lamp, visuals were captured employing a transmission electron microscope (Hitachi H-7650, sourced from Shanghai Bahe Instrument Technology Co., Ltd.). The dimensional distribution of the EVs was gauged utilizing a nanotechnology particle analysis instrument, specifically the Zeta View_Particle Metrix, acquired from Dacang Huajia Scientific Instruments.
Synthesis and characterization of GMNPsTo generate GMNPs or GMNPs labeled with RhB, the progressive immobilization of different chemical substances on the surface of Fe3O4@SiO2 core–shell magnetic nanoparticles (MNPs) was conducted. Initially, MNPs were dispersed in 100 mL anhydrous ethanol, followed by the addition of 2.5 mL of either MPTS solution (50 wt% ethanol) or a mixed solution of 2,3-dimethyl maleic anhydride/MPTS (molar ratio 1:9) and RhB in ethanol (50 wt%) to the suspension. The mixture was stirred for 8 h and subsequently filtered. The resulting solid was washed with ethanol and dried under vacuum, resulting in the production of Fe3O4@SiO2-C = C with or without an RhB label.
Next, Fe3O4@SiO2-C = C was dissolved in a mixture of methanol and tetrahydrofuran (THF) (1:1 v/v) in a 20 mL flask. Then, 1 mL of mercaptopropionic acid was added and stirred for 10 min. Afterward, 60 mg of 2,3-dimethyl maleic anhydride was added, and the solution was irradiated under UV light (365 nm) for 1 h while being stirred to initiate the thiol-ene reaction. Following this, the lights were turned off, and stirring of the solution was continued overnight. The resulting product was collected by centrifugation, washed multiple times with ethanol, and dried under vacuum at 60 °C for 12 h, resulting in the production of Fe3O4@SiO2-NH-NH2 with or without RhB labeling.
Subsequently, Fe3O4@SiO2NH-NH2 nanoparticles (50 mg) were mixed thoroughly with methanol (20 mL) containing CHO-PEG 4000-CHO (1 g) and stirred at room temperature for 12 h. After adding 20 μL of ice-cold acetic acid, the mixture was further stirred for 12 h. After washing the modified nanoparticles with ethanol and water, the particles were dried under vacuum at 60 °C for 12 h, leading to the production of Fe3O4@SiO2-PEG-CHO (GMNPs or GMNPs labeled with RhB).
The intermediate and final products were analyzed using scanning electron microscopy (SEM) (S-4800, Hitachi, acquired from Shanghai Fulei Optical Technology Co., Ltd.), energy-dispersive spectroscopy (IQLAAHGABMFAAWMACL, Thermo Fisher), and Fourier-transform infrared spectroscopy (912A0770, Thermo Fisher). The magnetization curve was recorded using the Micromag model 2900 alternating gradient magnetometer (Princeton Measurements Cooperation). X-ray diffraction patterns were obtained using copper Kα irradiation in the RINT2000 vertical wind velocity meter (Rigaku). The size and size distribution of particles were measured using dynamic light scattering (DLS) (Nano ZS90, Malvern).
Preparation and biocompatibility study of GMNPEThe GMNPE was formulated by amalgamating the anti-CD63 antibody (PA5-92,370, Thermo Fisher) with aldehyde-functionalized MNPs, designated as Fe3O4@SiO2PEG-CHO or simply GMNP. Initially, the GMNP solution was purified via magnetic separation, ensuring a concentration of 1 mg per milliliter, and subsequently resuspended in PBS. The anti-CD63 antibody was introduced and a thorough amalgamation was ensured. This compound was then incubated at 4 °C with rotational agitation overnight to yield GMNPE. For the fabrication of a fluorescently labeled GMNPE, a similar procedure was adhered to, but GMNPs marked with RhB were utilized in lieu of the conventional GMNPs.
After the antibody attachment, the GMNPE was thrice rinsed using PBS and preserved at a temperature of 4 °C. A comparative analysis of MNPs, GMNPs, and GMNPE was conducted via TGA to assess the antibody's loading capacity onto GMNPE via TGA (utilizing STA 6000, Perkin Elmer). Both MNPE and GMNPE were co-incubated with HSA (sourced as MABX1932 from Sigma Aldrich, Shanghai, China) for three days at 37 °C. The adsorptive capacity of HSA was ascertained using FITC-tagged HSA through fluorescence spectroscopy. Additionally, the stability of HSA was scrutinized. The adsorption capacity percentage was computed by dividing the quantity of HSA that had adhered to the nanoparticles by the overall quantity of HSA that was adsorbed.
Preparation and characterization of GMNPE-EVsThe fluorescent labeling of purified EVs was conducted using the green PKH67 membrane dye (MINI67, purchased from Shanghai Sigma Aldrich Trading Co., Ltd). To collect EVs, the GMNPE nanoparticles mentioned above were incubated with suspended EVs or serum at 37 °C. After a 2-h incubation, magnetic separation was performed to obtain GMNPE-EVs, which were then subjected to three washes with PBS. The morphology of the resulting GMNPE-EVs was observed using a high-resolution transmission electron microscope (200 kV, CM200, Philips). Both GMNPE and EVs were fluorescently labeled with RhB and PKH67 to confirm their binding relationship.
To assess the binding ability of GMNPE to EVs, the reduction of EVs in the serum before and after co-culture was calculated. The obtained data was compared with the corresponding GMNPN values of the IgG control dose to determine the relative collection amount of EVs. The total protein concentration in EVs was quantified using the BCA protein assay method (71,285-M, purchased from Shanghai Sigma Aldrich Trading Co., Ltd.). The percentage of vesicle binding capacity was calculated by dividing the number of vesicles by the number of nanoparticles used for capture.
The magnetic separation of EVs was confirmed through Western blot analysis. Briefly, positive control EVs, GMNPE-EVs, and GMNPN-EVs were prepared using Radioimmunoprecipitation Assay (RIPA) buffer (20–188, purchased from Sigma-Aldrich Trading Co., Ltd. Shanghai). The solution was removed through centrifugation, and separation was carried out using SDS-PAGE, which was subsequently transferred to PVDF membranes. The membrane was washed and blocked at 4 °C for 1 h, followed by incubation overnight with the primary antibody CD63 (rabbit anti, PA5-92,370, Thermo Fisher) at room temperature. Subsequently, the membrane was washed with TBST for 5 min, repeated three times, and then incubated and developed with the goat anti-rabbit IgG secondary antibody (ab205718, 1:20,000 dilution, Abcam) and the developing solution. Finally, the protein analysis was performed using ImageJ 1.48 software.
Phagocytosis of GMNPE-EVs by osteoclastsThe uptake proficiency of osteoclasts for GMNPE-EVs was assessed by co-culturing RhB-marked GMNPE with PKH67-tagged EVs at 37 °C alongside osteoclasts for three days. Following the incubation, the culture was rinsed three times using PBS and subsequently fixed using polyformaldehyde for 15 min. To ascertain the intracellular localization of GMNPE-EVs, the cytoskeleton and cell nuclei were stained with Hoechst 33,342, procured from Sigma Aldrich, Shanghai, China.
Immunofluorescent stainingGMNPN and GMNPE were immobilized in 4% PFA solution at room temperature and underwent a 30-min treatment for permeabilization and blocking. They were then incubated with anti-CD63 antibody (PA5-92,370, Thermo Fisher) at a dilution of 1:100 at 4 °C. On the following day, the cells were washed three times with a Blank solution and subsequently incubated with Goat Anti-Rabbit Antibody coupled with Alexa Fluor® 555 (#60,839, 1:50 dilution, CST) without light exposure. Finally, the cells were observed under a fluorescent microscope (Zhao et al. 2018; Guan et al. 2020).
RhB-labeled GMNPE-EVs and PKH67-labeled EVs were injected into the bodies of DO rats. N52 neodymium magnets were then employed to apply an external magnetic field at the femur site in the rats, facilitating the accumulation of flowing GMNPE nanoparticles at the femur site. After the rats were euthanized, their femurs, brains, livers, kidneys, and other tissues were extracted and prepared for longitudinal cryosectioning. A fluorescence microscope (80i, purchased from Shanghai Henghao Instruments Co., Ltd.) was utilized to observe these tissues.
CCK-8 assayDuring their logarithmic growth phase, osteoclasts were plated in a 96-well plate at a concentration of 5 × 10³ cells per well. Subsequently, 10 μL of the CCK-8 reagent solution (C0038, Beyotime Biotechnology Co., Ltd., Shanghai, China) was introduced to each well. The plate was then incubated in a humidified chamber set at 37℃. An hour post-incubation, the absorbance of each well was measured at 450 nm using a Micro-plate Reader (abx700005, Beijing Qiwei Yicheng Technology Co., Ltd.), and the results were meticulously recorded.
Statistical analysisGraphPad Prism 8.0 software was utilized to process all the data. The data is presented as the mean ± standard deviation (mean ± SD). An independent t-test was employed to compare the two groups, whereas a one-way analysis of variance (ANOVA) was used to compare data among multiple groups. Levene's test was conducted to assess the homogeneity of variances. If the variances were found to be homogeneous, pairwise comparisons were performed using Dunnett's t-test and LSD-t-test. In cases where the variances were unequal, Dunnett's T3 test was employed. A p-value below 0.05 indicated statistical significance in the comparisons between the two groups.
留言 (0)